April 2025 EOM Report — Inter Market Dynamics

Written by
A Sign Of Time
Head of Education & Toodegrees Analyst

How To Read This Report
The End of Month (EOM) Report is a comprehensive monthly market review produced by A Sign Of Time for the Toodegrees Library. Each report covers the full month across multiple asset classes — US Index Futures, Currency Markets, and Bond Futures — bringing together macro context, technical analysis, and institutional data into one structured overview.
The report is divided into the following sections: a Monthly Recap covering macro events and index performance; Technical Analysis Pages applying HTF Power of Three, IPDA Lookback, Seasonality, COT, and Open Interest to Nasdaq Futures; an Inter-Market Dynamics section covering the US Dollar and major pairs; and a curated set of Additional Resources and a closing Conclusion.
All analysis is for educational purposes and reflects market conditions as of end-of-April 2025. Seasonal data and historical patterns do not guarantee future results.
Section 1
Monthly Recap — US Indices
Recent Events
During President Trump's first 100 days of his second term, U.S. financial markets experienced significant turbulence. The S&P 500 dropped 7.3%, the Dow Jones lost 6.8%, and the Nasdaq plummeted 11% — marking the worst performance during a presidency's opening stretch in over 50 years. This downturn was largely attributed to aggressive trade policies and tariff announcements, including a universal 10% tariff on imports declared on April 2, which triggered sharp declines across equity markets.
Central Bank Policies
Two major central banks had monetary policy announcements in April:
European Central Bank (ECB)
Reduced the interest rate by 0.25 basis points to 2.4% — the second consecutive rate cut, aimed at supporting the Eurozone economy amid trade uncertainty.
Bank of Japan (BOJ)
Maintained the short-term interest rate at 0.5%. Policy makers emphasized caution to prevent potential inflationary pressure from rapid policy changes.

April Results — US Index Futures
The month of April closed with notable divergence between the three major US Index Futures. Nasdaq 100 Futures ($NQ) recovered all of the Tariff-induced losses to close the month up +2.25%, while E-Mini S&P 500 ($ES) saw a marginal decline of -0.43% and E-Mini Dow Jones ($YM) declined -3.25%.
With President Trump announcing his Tariff proposition, markets went lower initially. However, since the 7th of April, all three indices have been recovering their losses — with $NQ being the standout, completely recovering the Tariff-induced selloff to close the month in positive territory.
Footnote: $NQ = E-Mini Nasdaq 100 Futures · $ES = E-Mini S&P 500 Futures · $YM = E-Mini Dow Jones Futures
Top Performers Per Index
Performance year-to-date, recorded on April 1st:
NASDAQ
- MSFT ~9%
- IDXX ~8%
- CEG ~7%
S&P 500
- PWR ~12%
- CARR ~11%
- HWM ~8%
DOW JONES
- NVDA ~4%
- AMZN ~3%
- CAT ~2%
Sentiment Analysis
Key Sentiment Drivers
The announcement of sweeping tariffs by the U.S. administration in early April led to significant market volatility. Although there was a temporary pause on these tariffs, the lack of a formal resolution continued to create uncertainty throughout the month.
The U.S. economy contracted by 0.3% in Q1 2025 — the first decline in three years — largely attributed to a surge in imports ahead of anticipated tariffs, which widened the trade deficit.
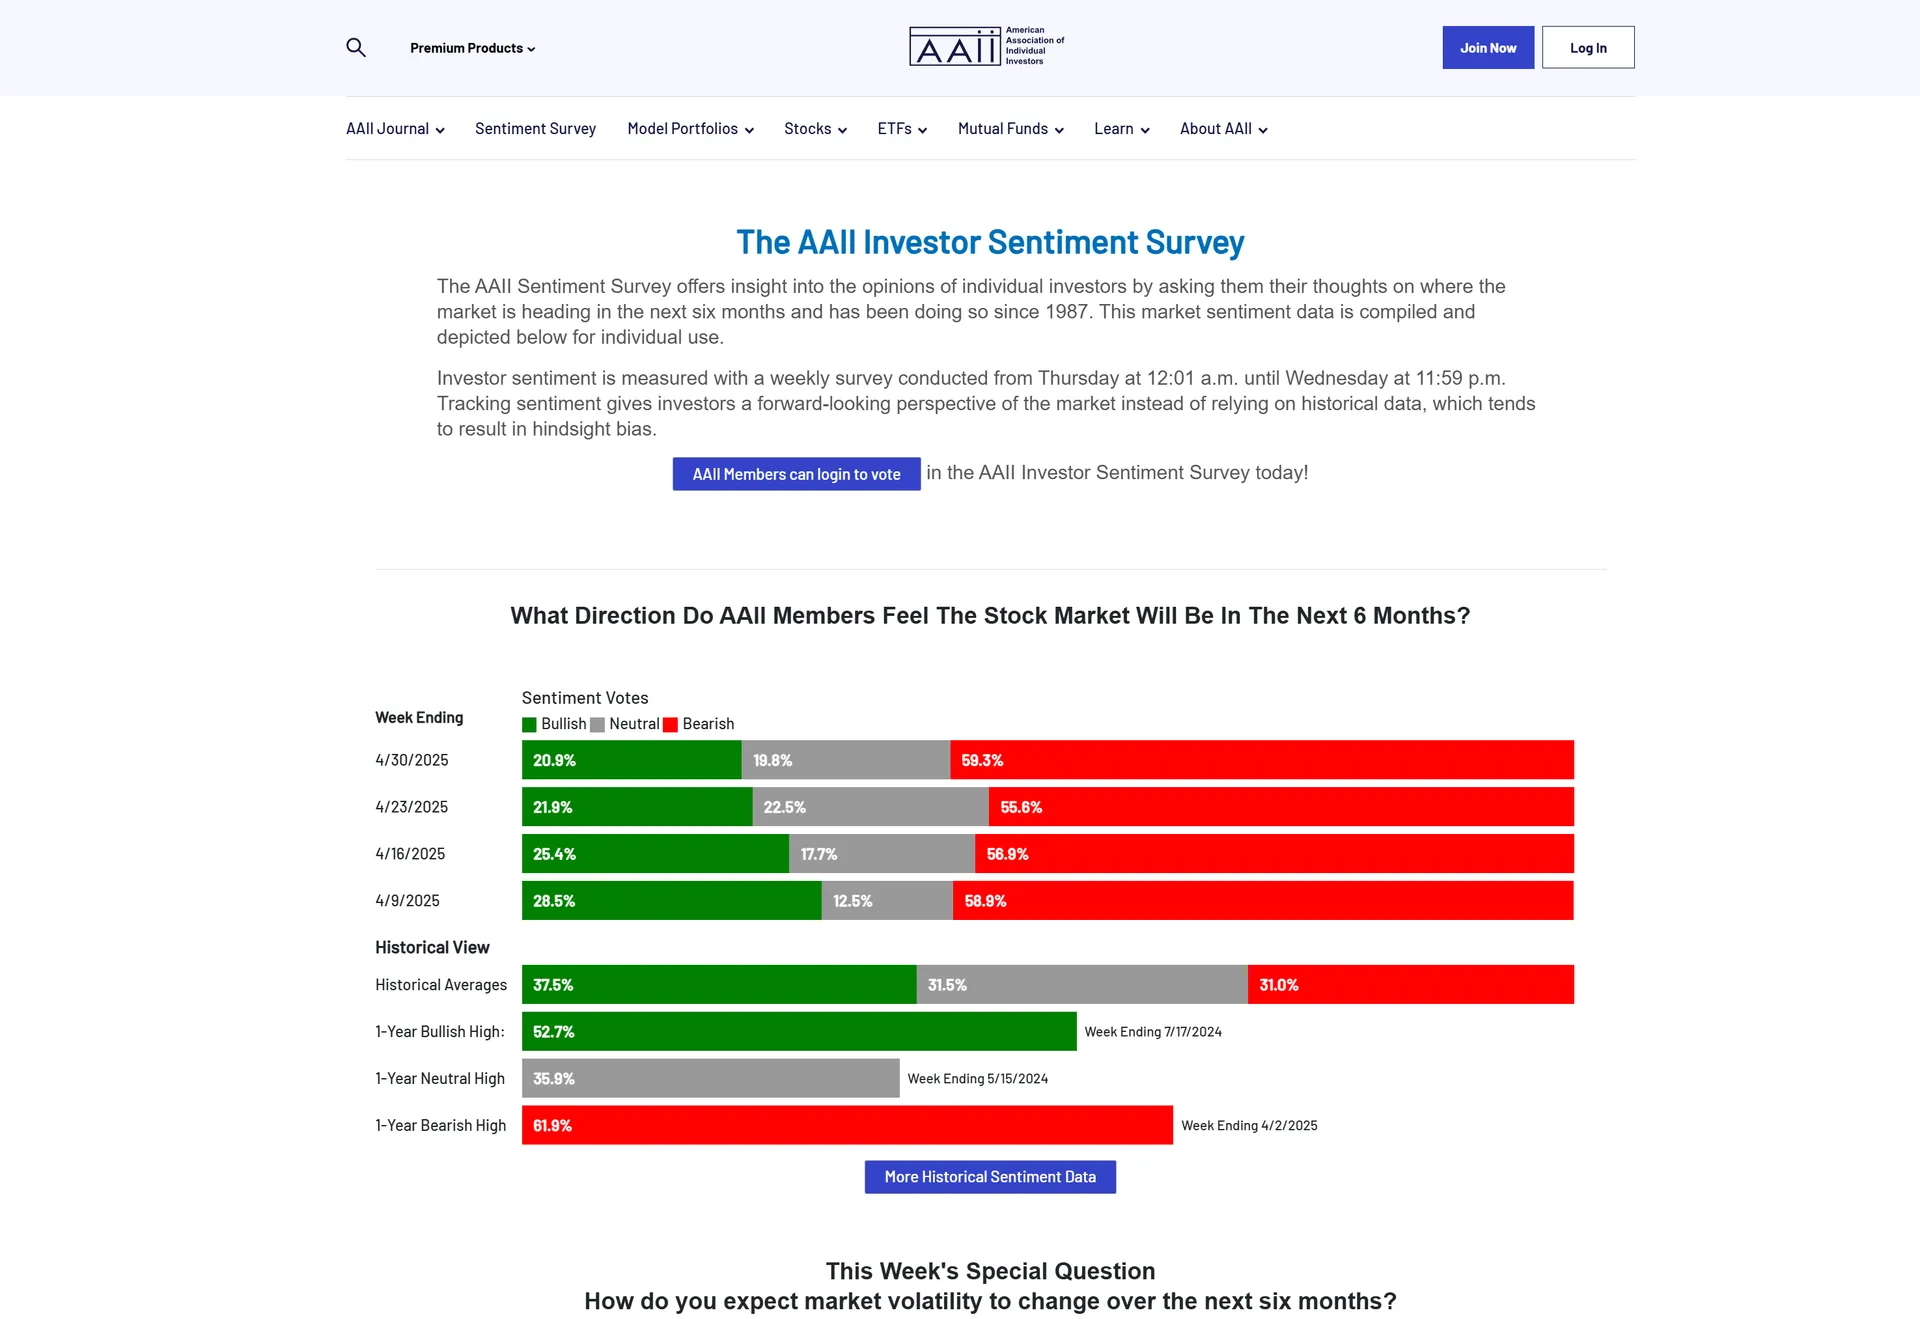
AAII Investor Sentiment Survey
On April 30th, 2025, bullish sentiment among investors stood at 20.9% — below the historical average (27.4% in March). Bearish sentiment stood at 59.3% — above the historical average (52.1% in March), reflecting a predominantly pessimistic investor outlook.
Fear and Greed Index
On May 1st, the Fear and Greed Index registered a value of 48 — Neutral. This represented a significant recovery from the previous report value of 15 — Extreme Fear.
Section 2
Technical Analysis — Nasdaq 100 E-Mini Futures
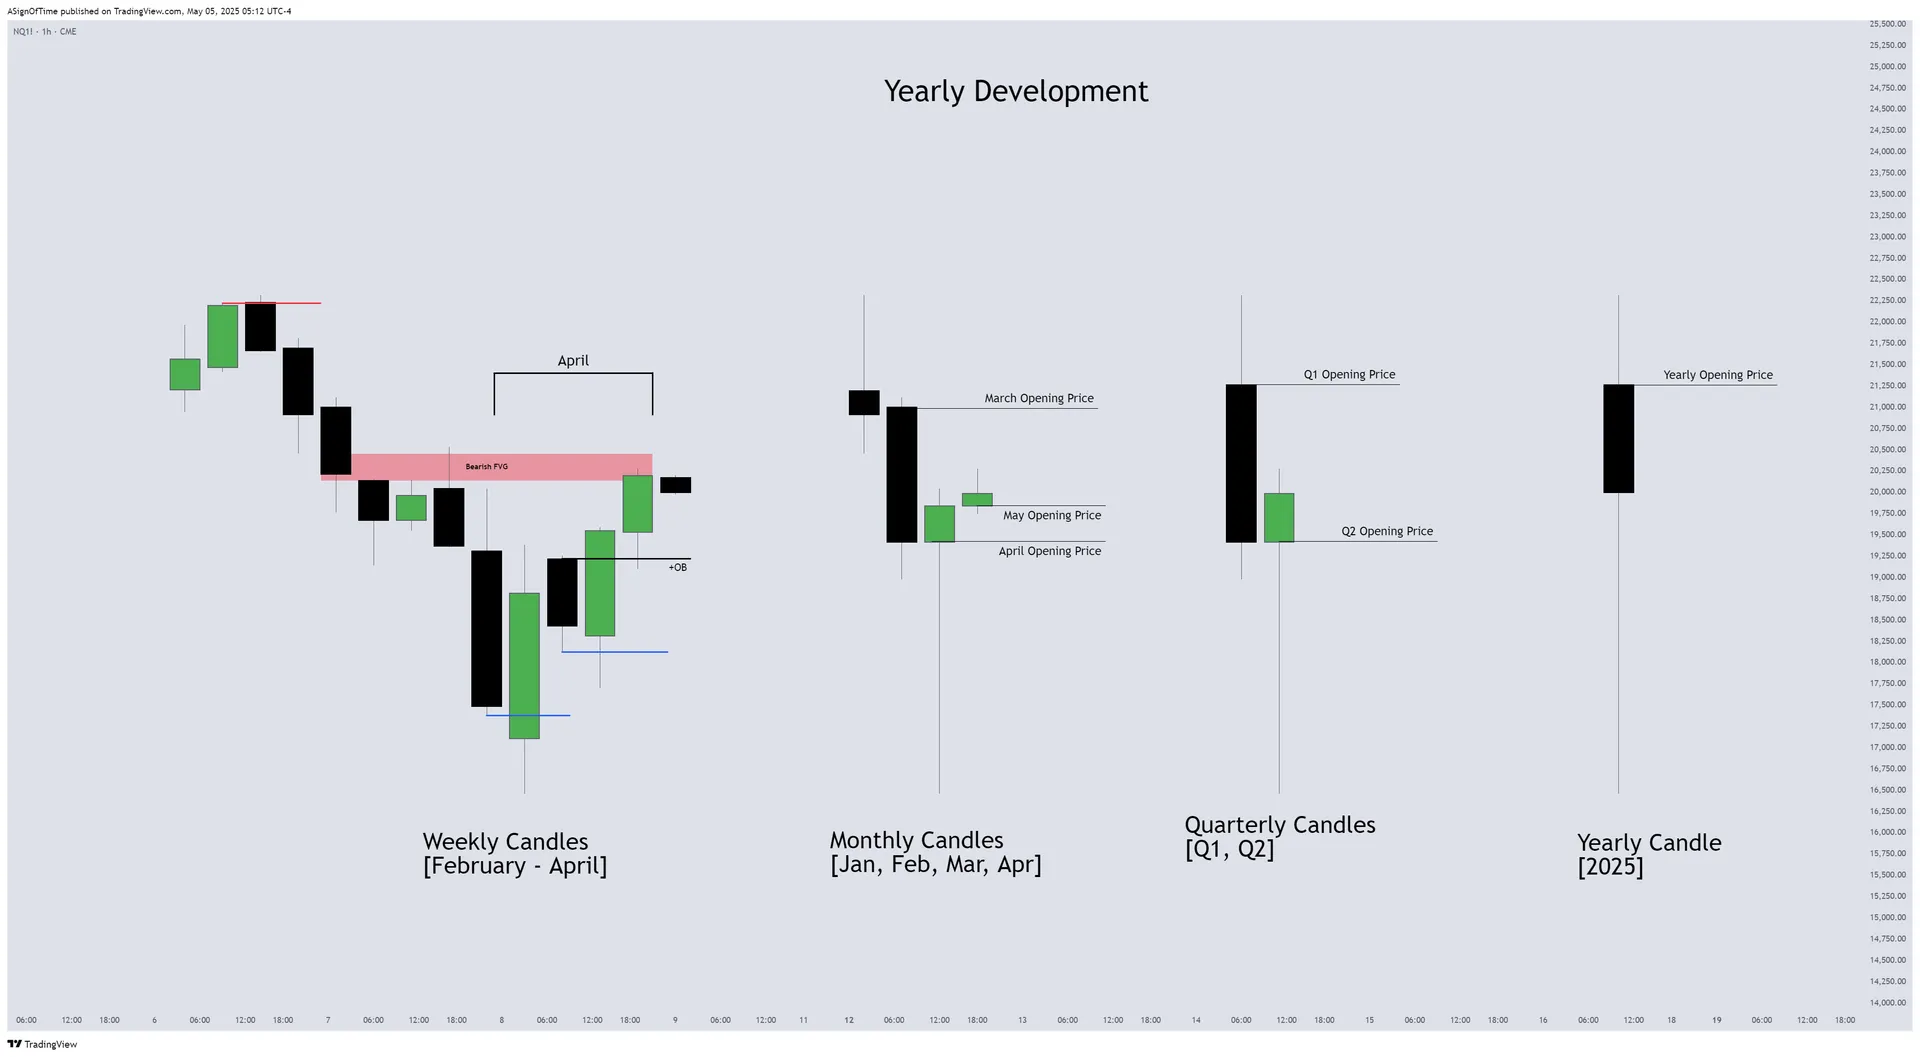
Monthly Recap — Monitoring Yearly Development
The higher timeframe Weekly and Quarterly candles show a strong rejection in April — a strong start of the month and quarter for the US Index. Looking at the Weekly candles on $NQ, we can see the development of this expansion lower and a possible reversal point.
The first week of April expanded lower with speed after trading into the Bearish FVG, however in the second week of April most of the losses were already recovered.
Analyst Insight
Tool used: HTF Power of Three°. The weekly structure on NQ shows a clear Market Maker Buy Model developing. Price swept the March lows (Sellside Liquidity), established a new short-term low, and has since been forming higher lows — a classic signature of institutional accumulation before a directional expansion higher.
Multi-Asset Analysis — IPDA Lookback (April Anchored)
On these charts, the IPDA Lookback tool has been anchored at the start of the new month. This allows us to view how April moved relative to the 60-day lookback, while also measuring Relative Strength across the three assets. The IPDA Lookback monitors time-based Liquidity Pools and PD Arrays from the last 20, 40, or 60 days.
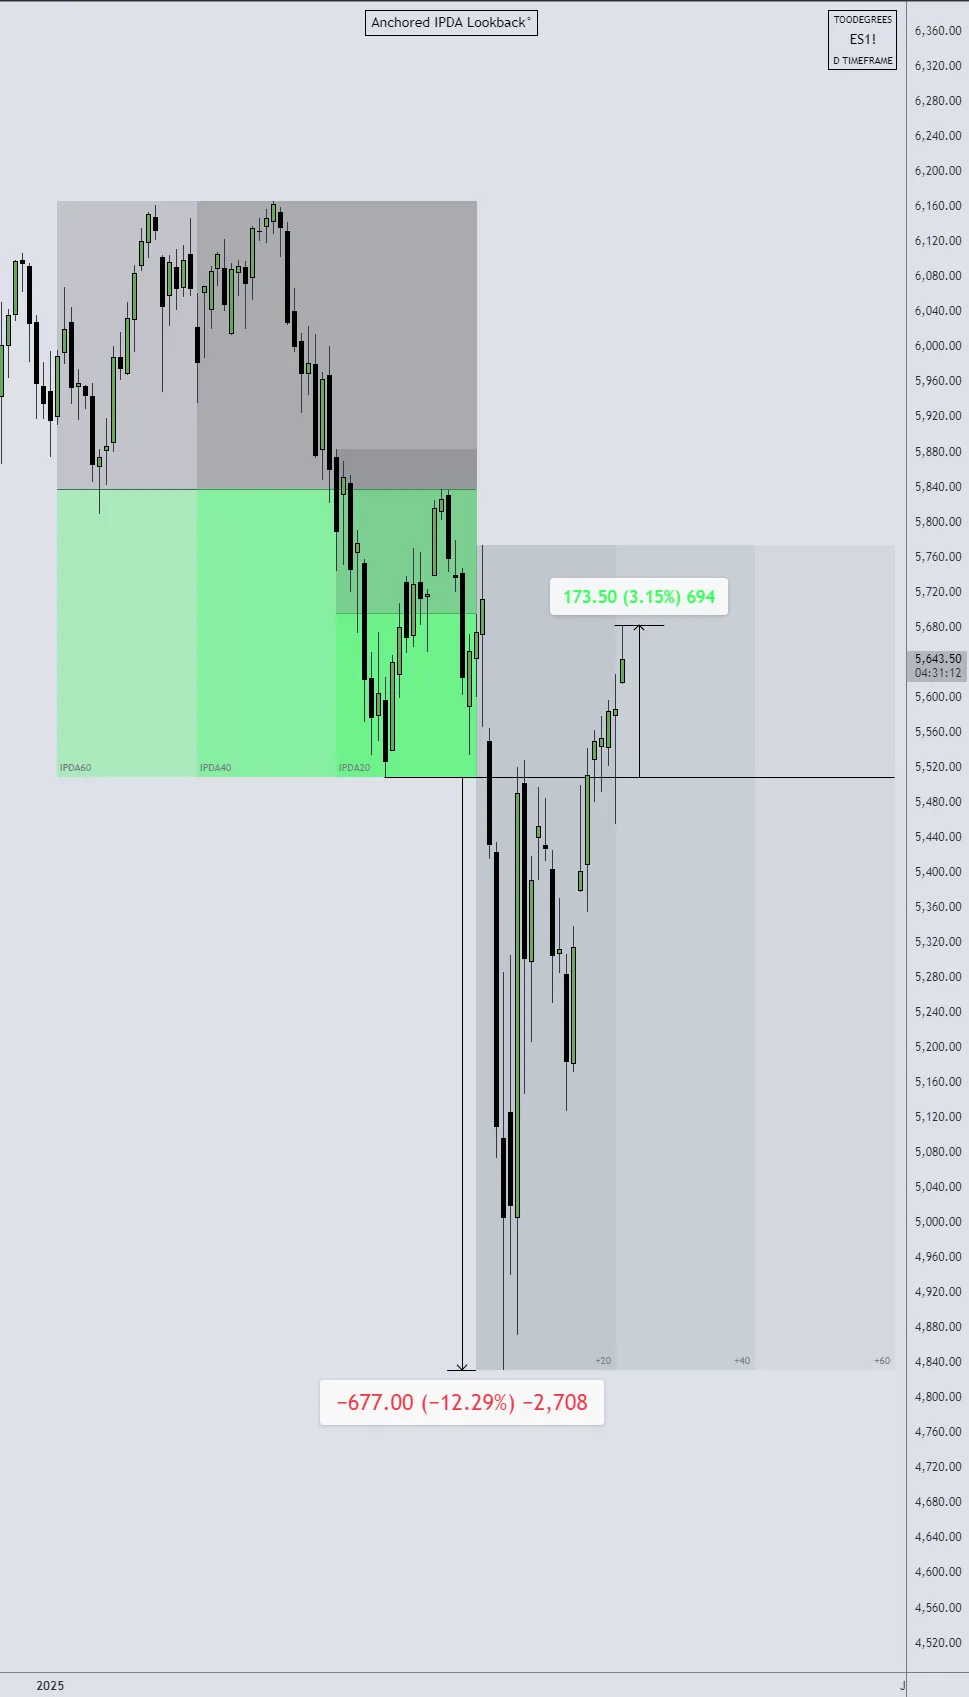
All three indices traded below the 60-Day IPDA Lookback liquidity pools during the Tariff selloff. By looking at how far each index extended below the liquidity pool, we can measure Relative Strength between them:
[E-MINI NASDAQ 100]
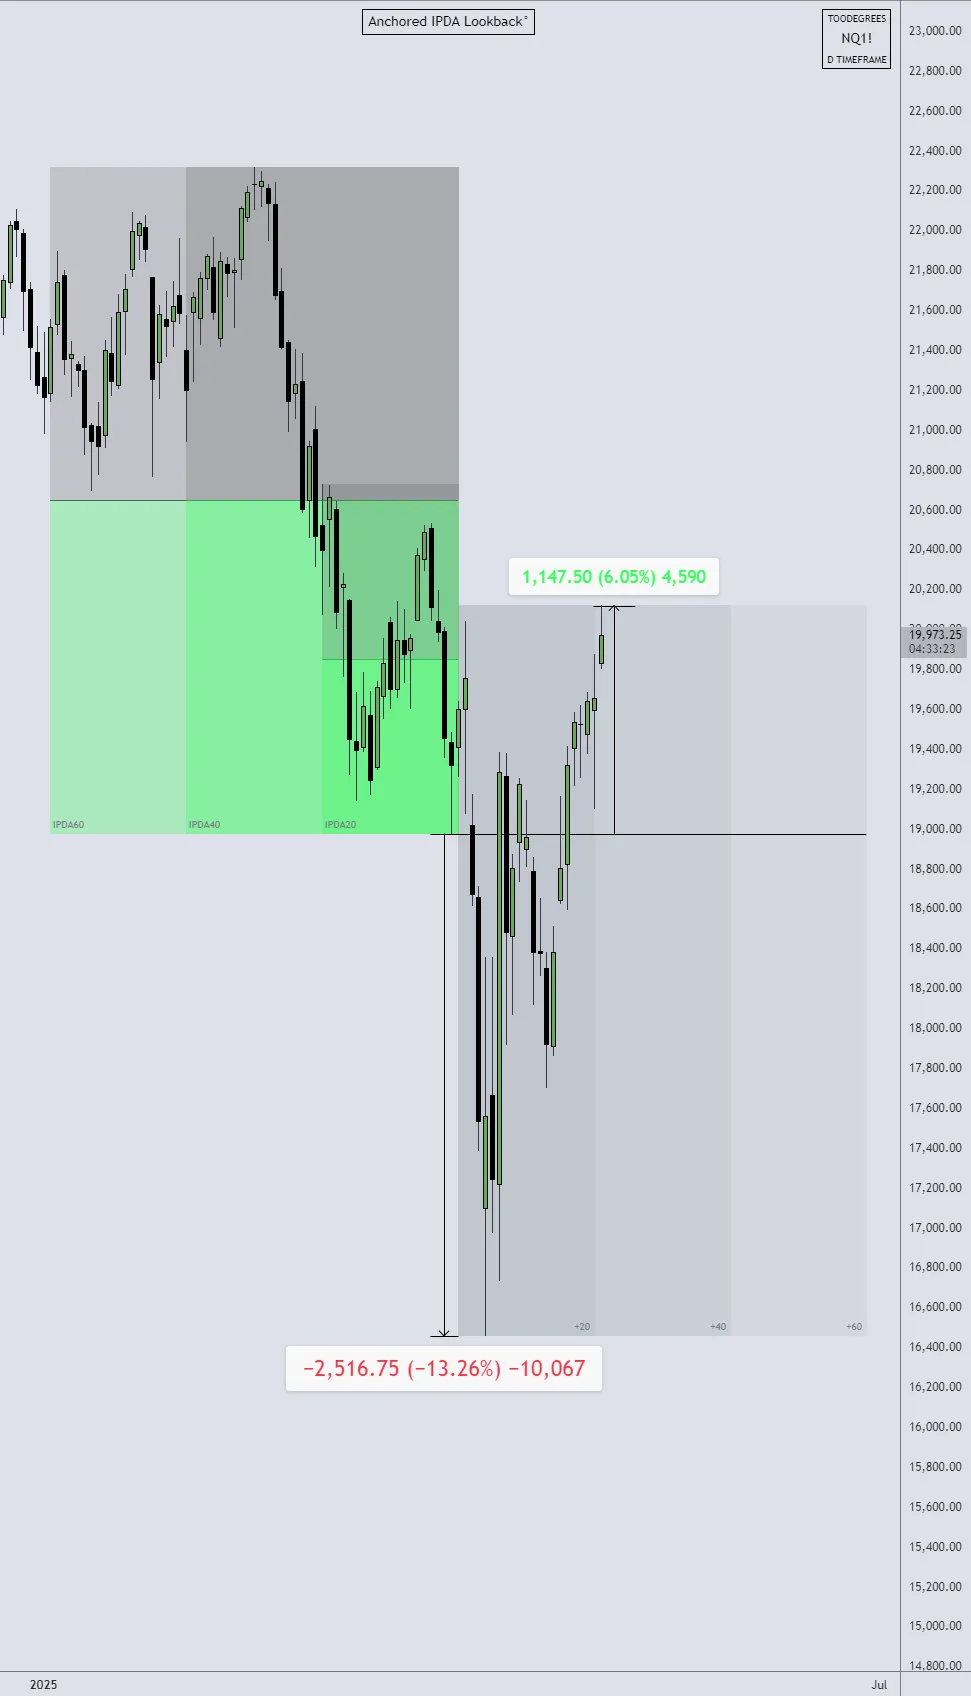
-13.26% below pool
[E-MINI S&P 500]
[E-MINI DOW JONES]
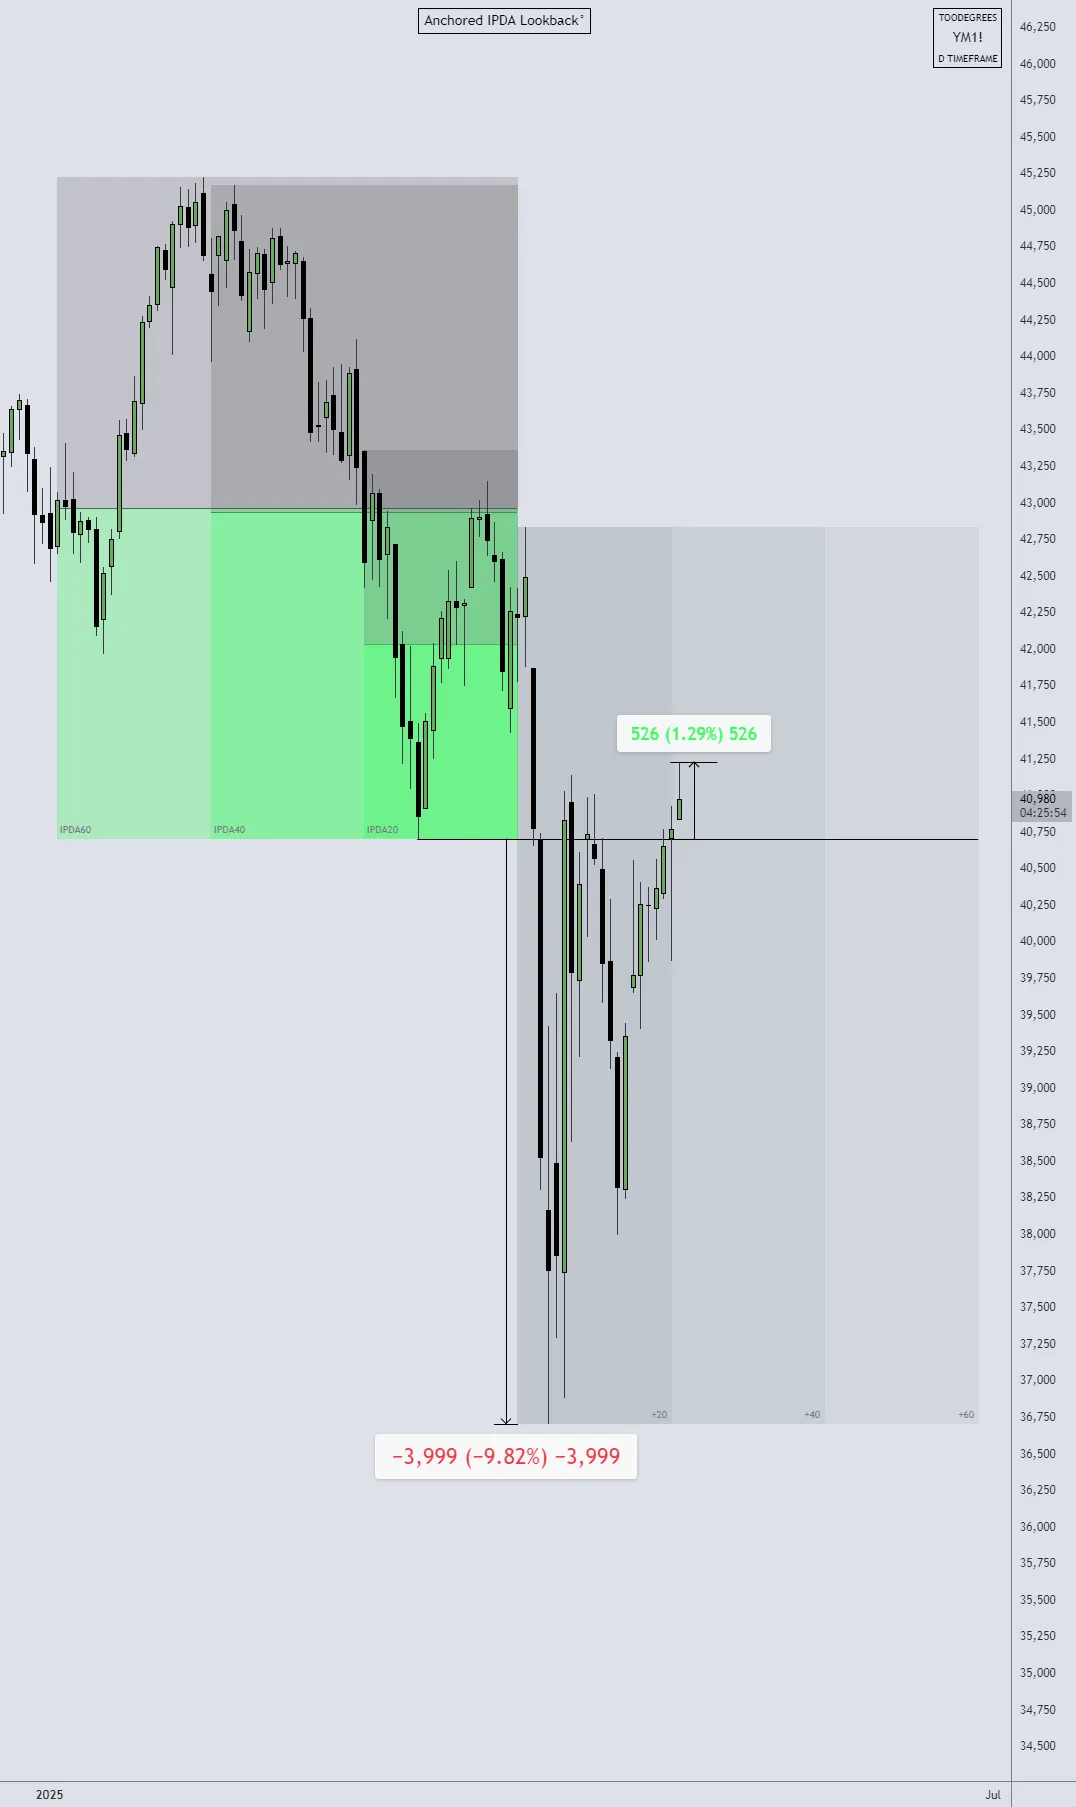
-9.8% (strongest)
Analyst Insight
The Dow Jones Futures ($YM) saw the smallest decline at -9.8% below the liquidity pool, making it the Relative Strength leader during the selloff. The Nasdaq ($NQ) had the biggest drop at -13.26%. All three indices have since started to recover and are now heading towards the midpoint of the lookback period, aligning with buyside liquidity pools.
Technical Analysis — NQ Futures
In the first week of April, the market expanded almost 3,300 points lower amidst the Tariff announcements, raiding the March Lows. Currently NQ shows signs of developing the buyside of the curve in a Market Maker Buy Model. Once a bearish consolidation is detected and orderflow is trapped to the downside, it causes a high-resistance move higher.
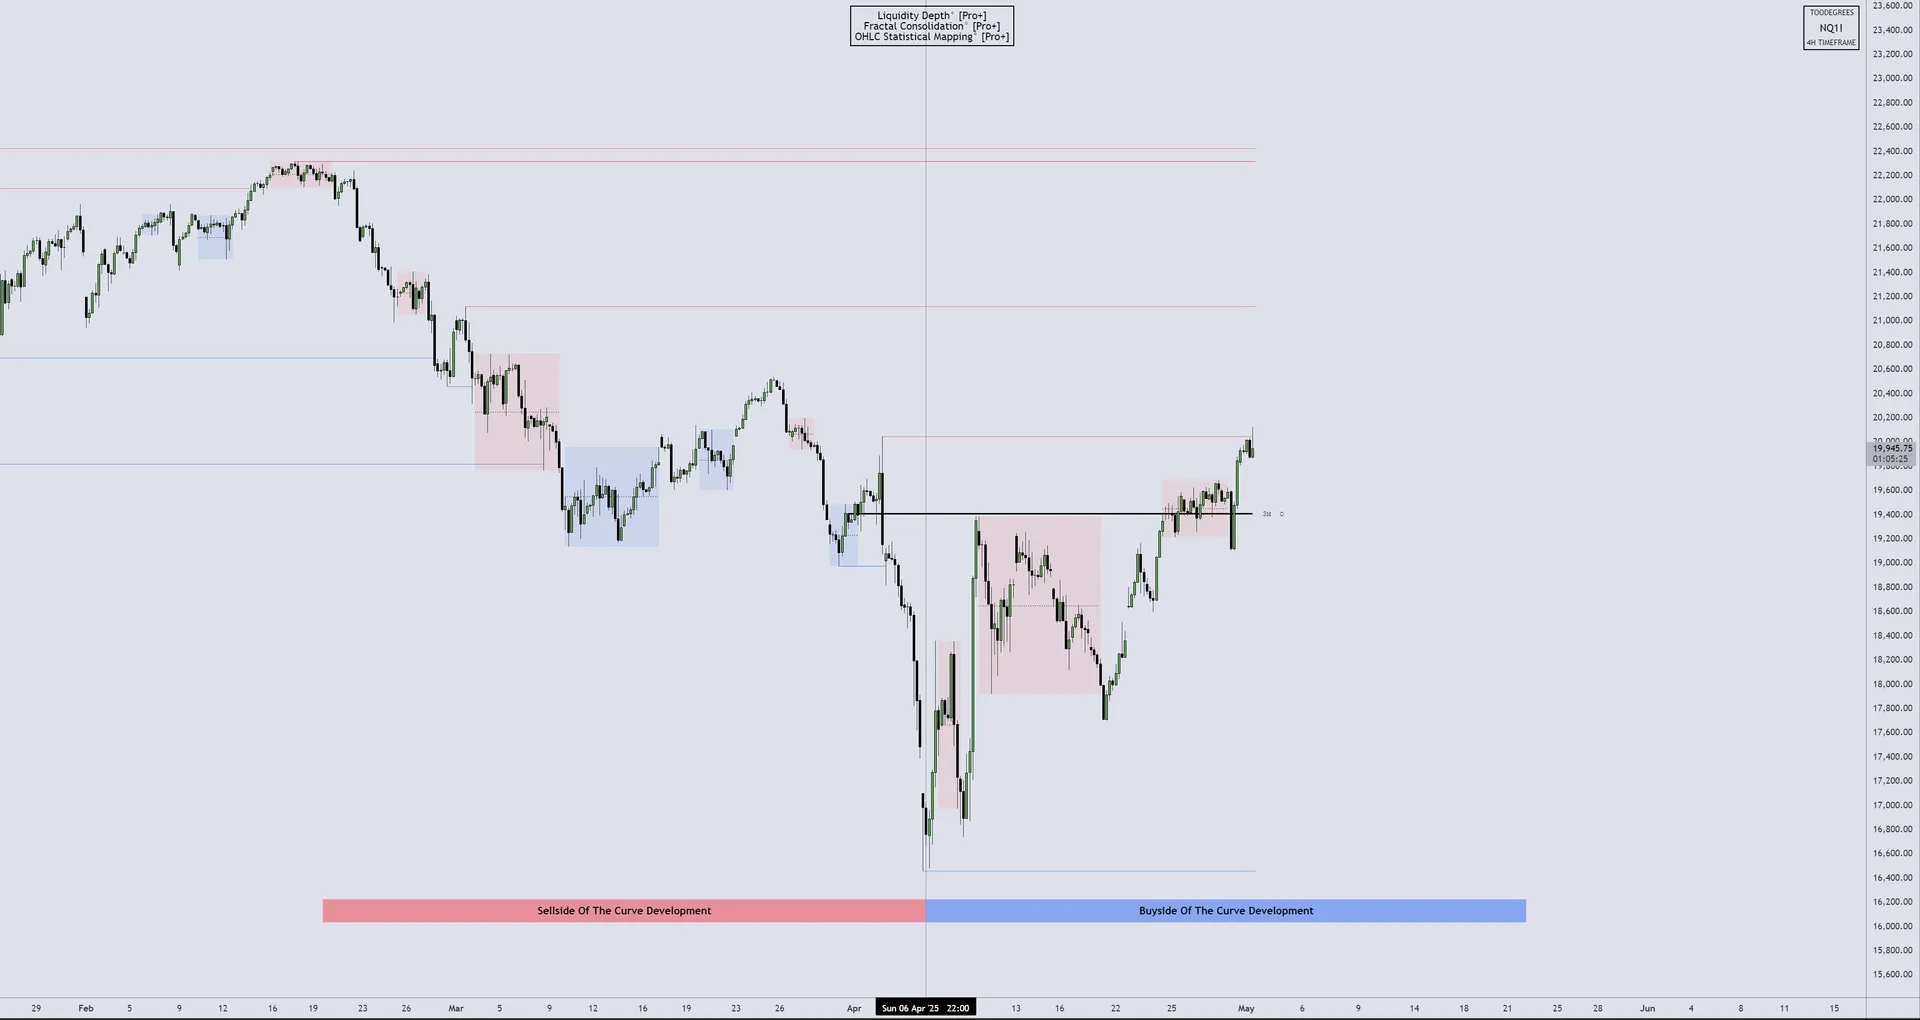
Analyst Insight
NQ is developing the classic signature of a Market Maker Buy Model: an aggressive sellside sweep (Tariff drop), followed by a consolidation phase where price traps bearish participants, then a high-resistance expansion higher targeting buyside liquidity pools. The recovery from April 7th aligns precisely with this pattern.
Seasonality Analysis — Nasdaq 100
Seasonal tendencies are recurring patterns and trends in markets such as stocks, bonds, currencies, and commodities. These patterns represent certain market trends that typically happen around the same time every year. The Seasonal Data can be used as a yearly roadmap but does not guarantee future results.
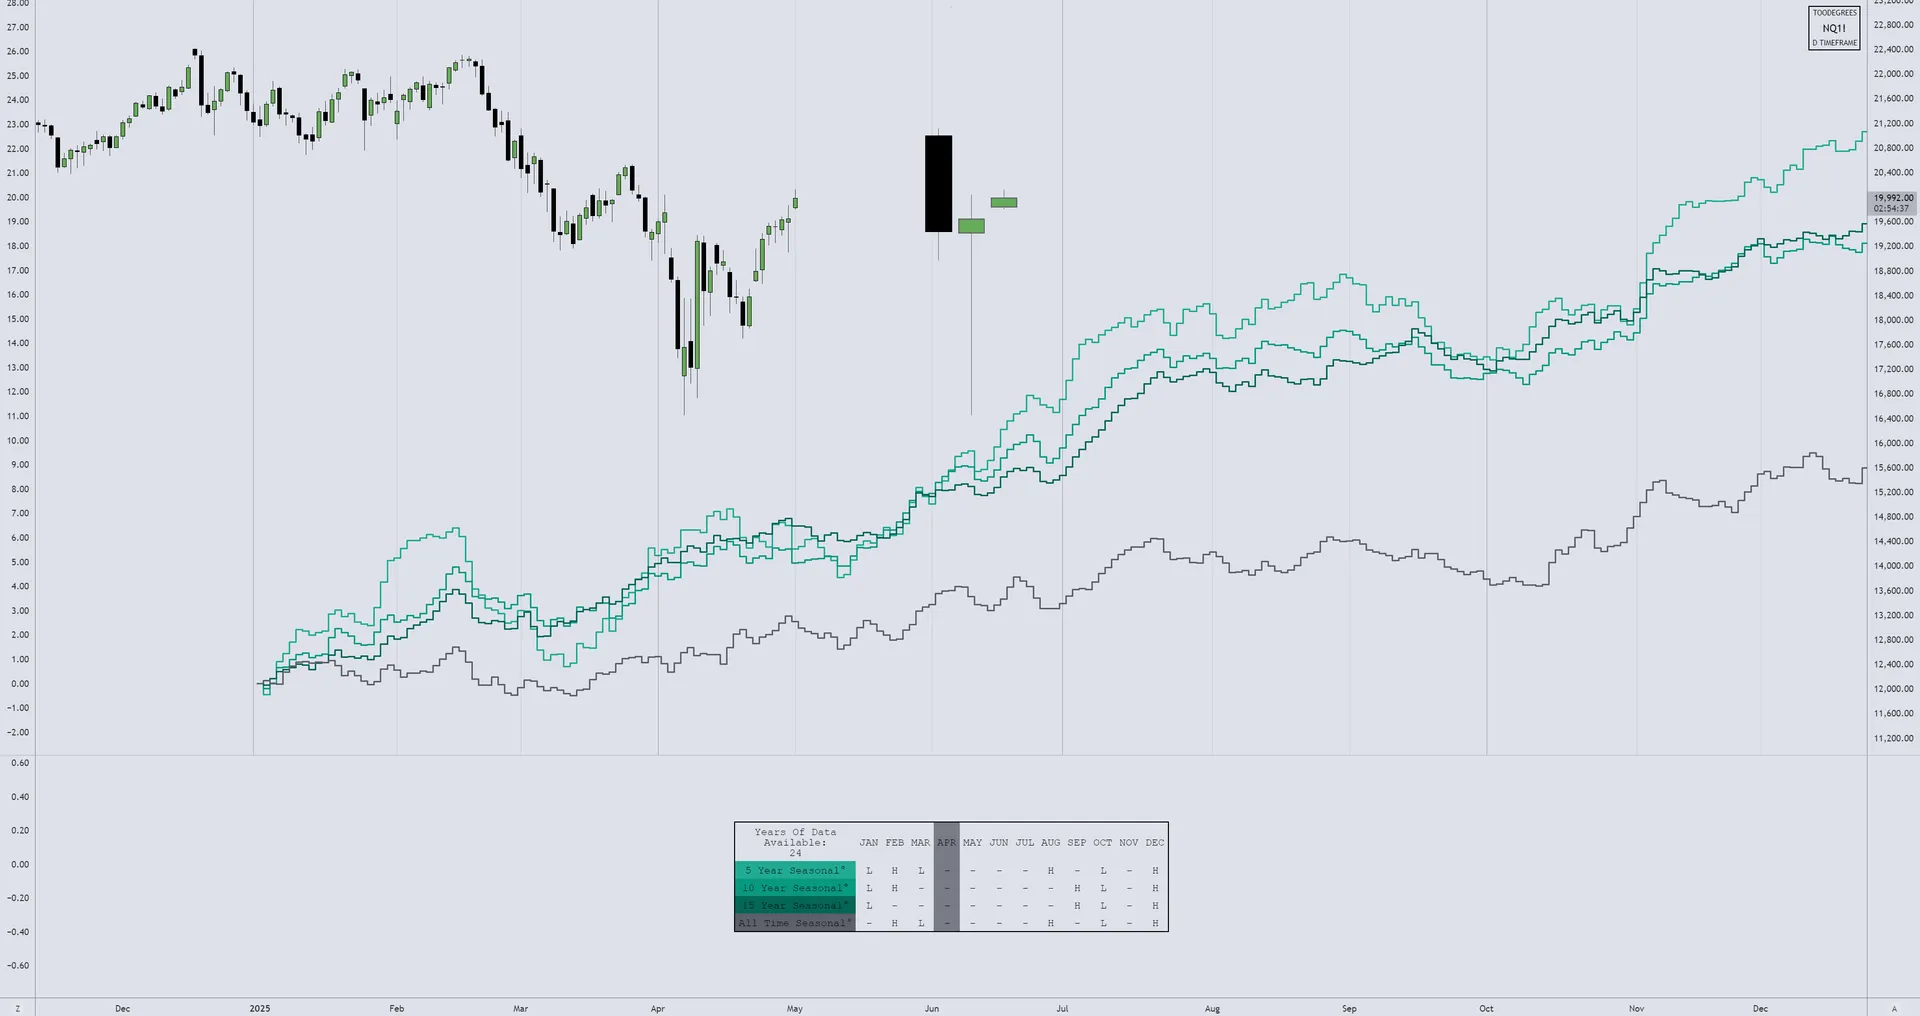
Analyst Insight
According to seasonal data, April is typically a bullish month for NQ. We can see that NQ aligned with seasonality after the large Tariff news drop. Historically Q2 is a bullish quarter, and NQ seems to be aligned with historical data thus far. This seasonal confluence adds further weight to the bullish bias being developed on higher timeframes.
Commitment of Traders — Nasdaq 100
The COT Report is a data-report released by the Commodity Futures Trading Commission (CFTC) on a weekly basis. It offers insight into the current long and short positions of market participants — broken down into Commercial Traders, Large Traders, and Small Speculators. The COT can reveal the Hedging Program of Commercial Traders.
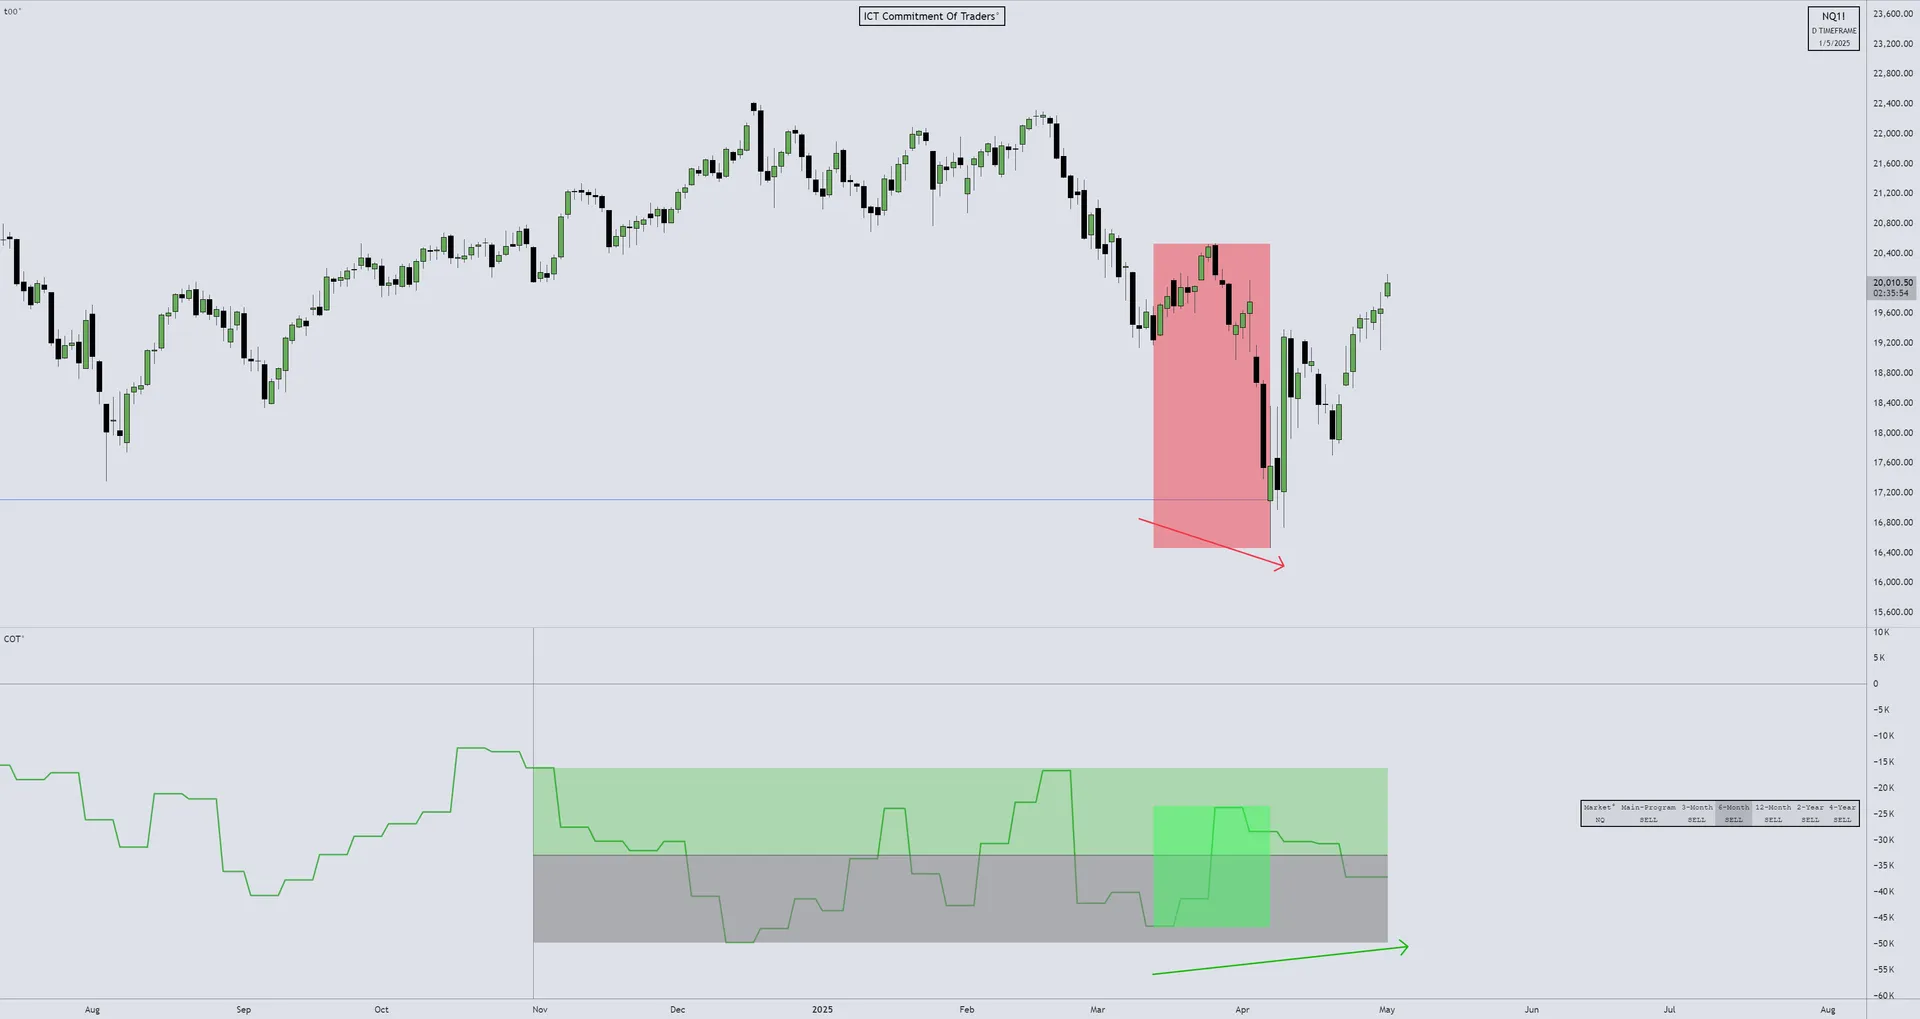
Analyst Insight
The red and green box mark the exact signatures we look for in the COT graph. The market trades lower, while the overall positioning goes higher on the commercial side. This signature helps identify potential reversal areas, especially when combined with HTF Liquidity Pools. Commercial accumulation during the Tariff selloff is a bullish divergence signal.
Open Interest — Nasdaq 100
Open Interest (OI) is a valuable metric released at the end of each trading day. It represents the number of outstanding futures contracts held by market participants for a given commodity or market. Comparing current OI to historical seasonal averages helps gauge the strength and conviction behind price moves.
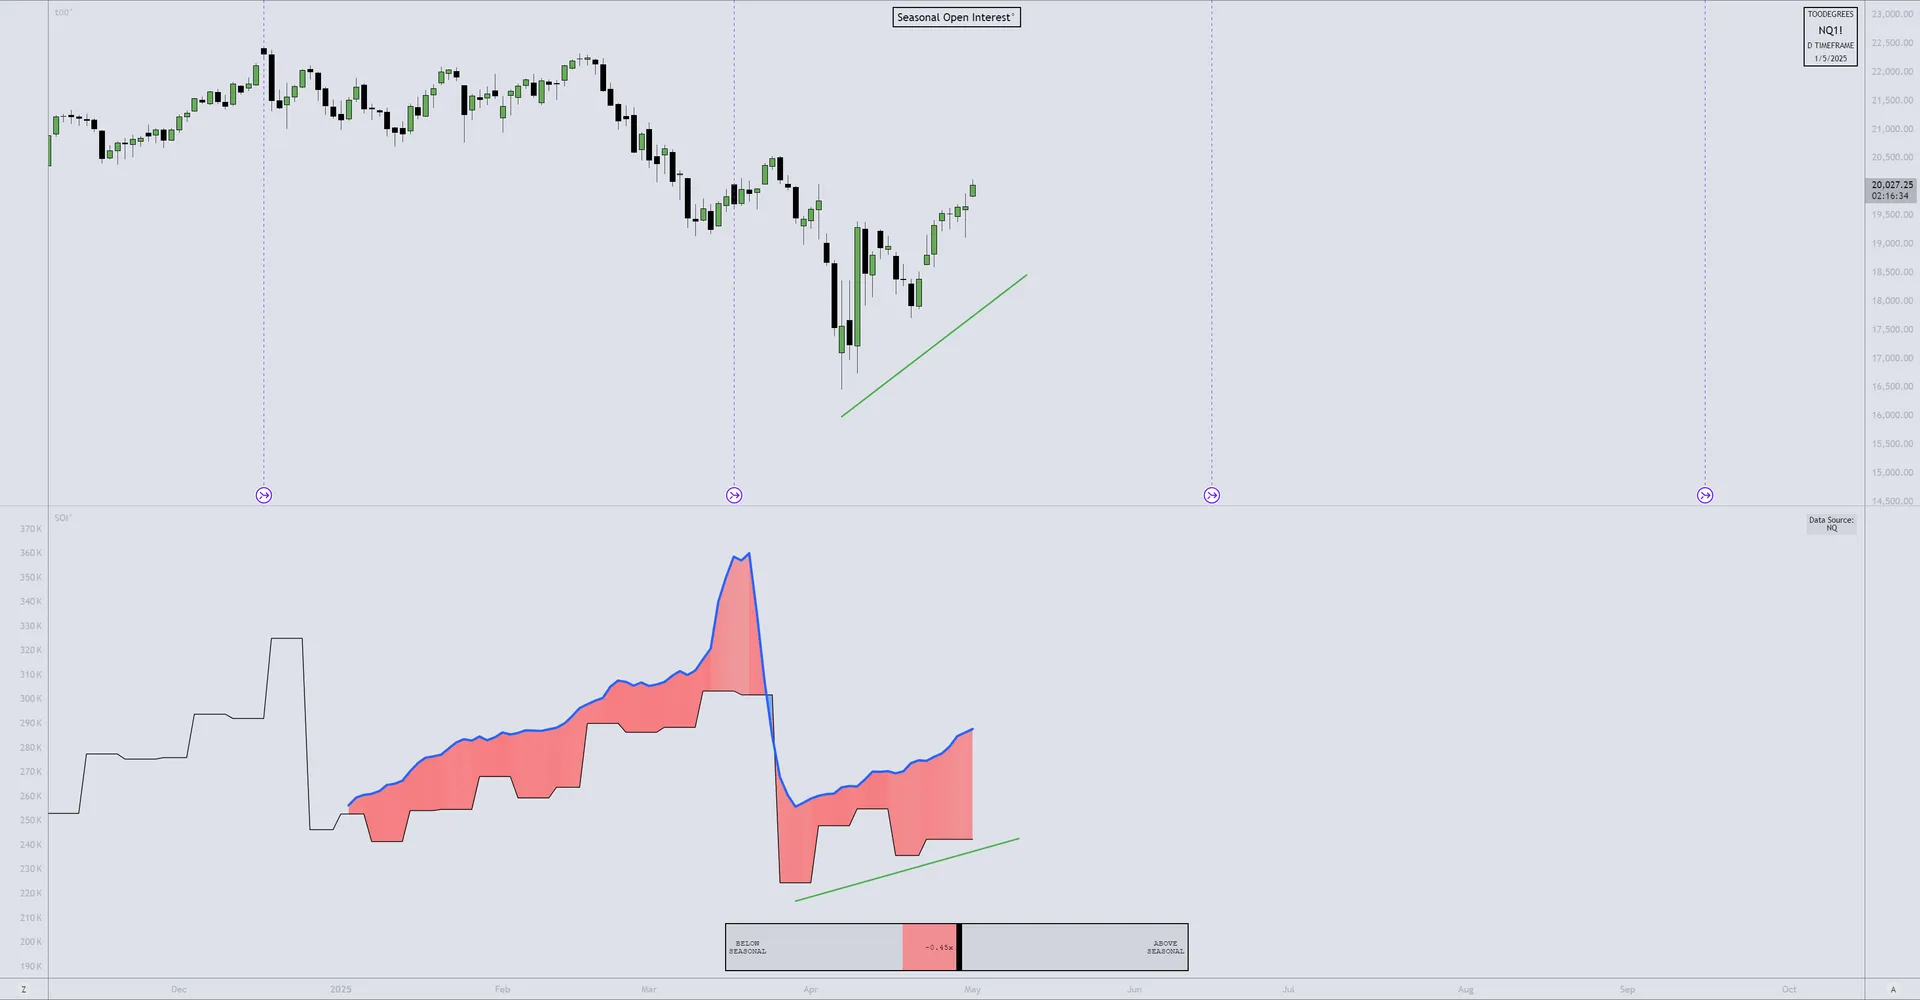
Analyst Insight
The Open Interest for NQ is still well below the seasonal average, indicating less broader participation compared to historical data. However, OI is slowly moving higher alongside price — which could indicate there is strength and conviction behind this recovery move.
Section 3
Inter-Market Dynamics — Currency Markets
April Results — Currency Markets
In April, the US Dollar closed 4.36% lower, while the Euro and Great British Pound closed 4.74% and 3.16% higher respectively. Both the DXY and foreign currencies continued their established trend from the previous months.
DXY Monthly Recap
The US Dollar Index saw an almost immediate decline as soon as April opened, after retracing into the Bearish Fair Value Gap. In the previous report, we outlined how the DXY created a Bearish FVG during March, which was our main Point Of Interest. As of now, the first month in Q2 has also closed lower.
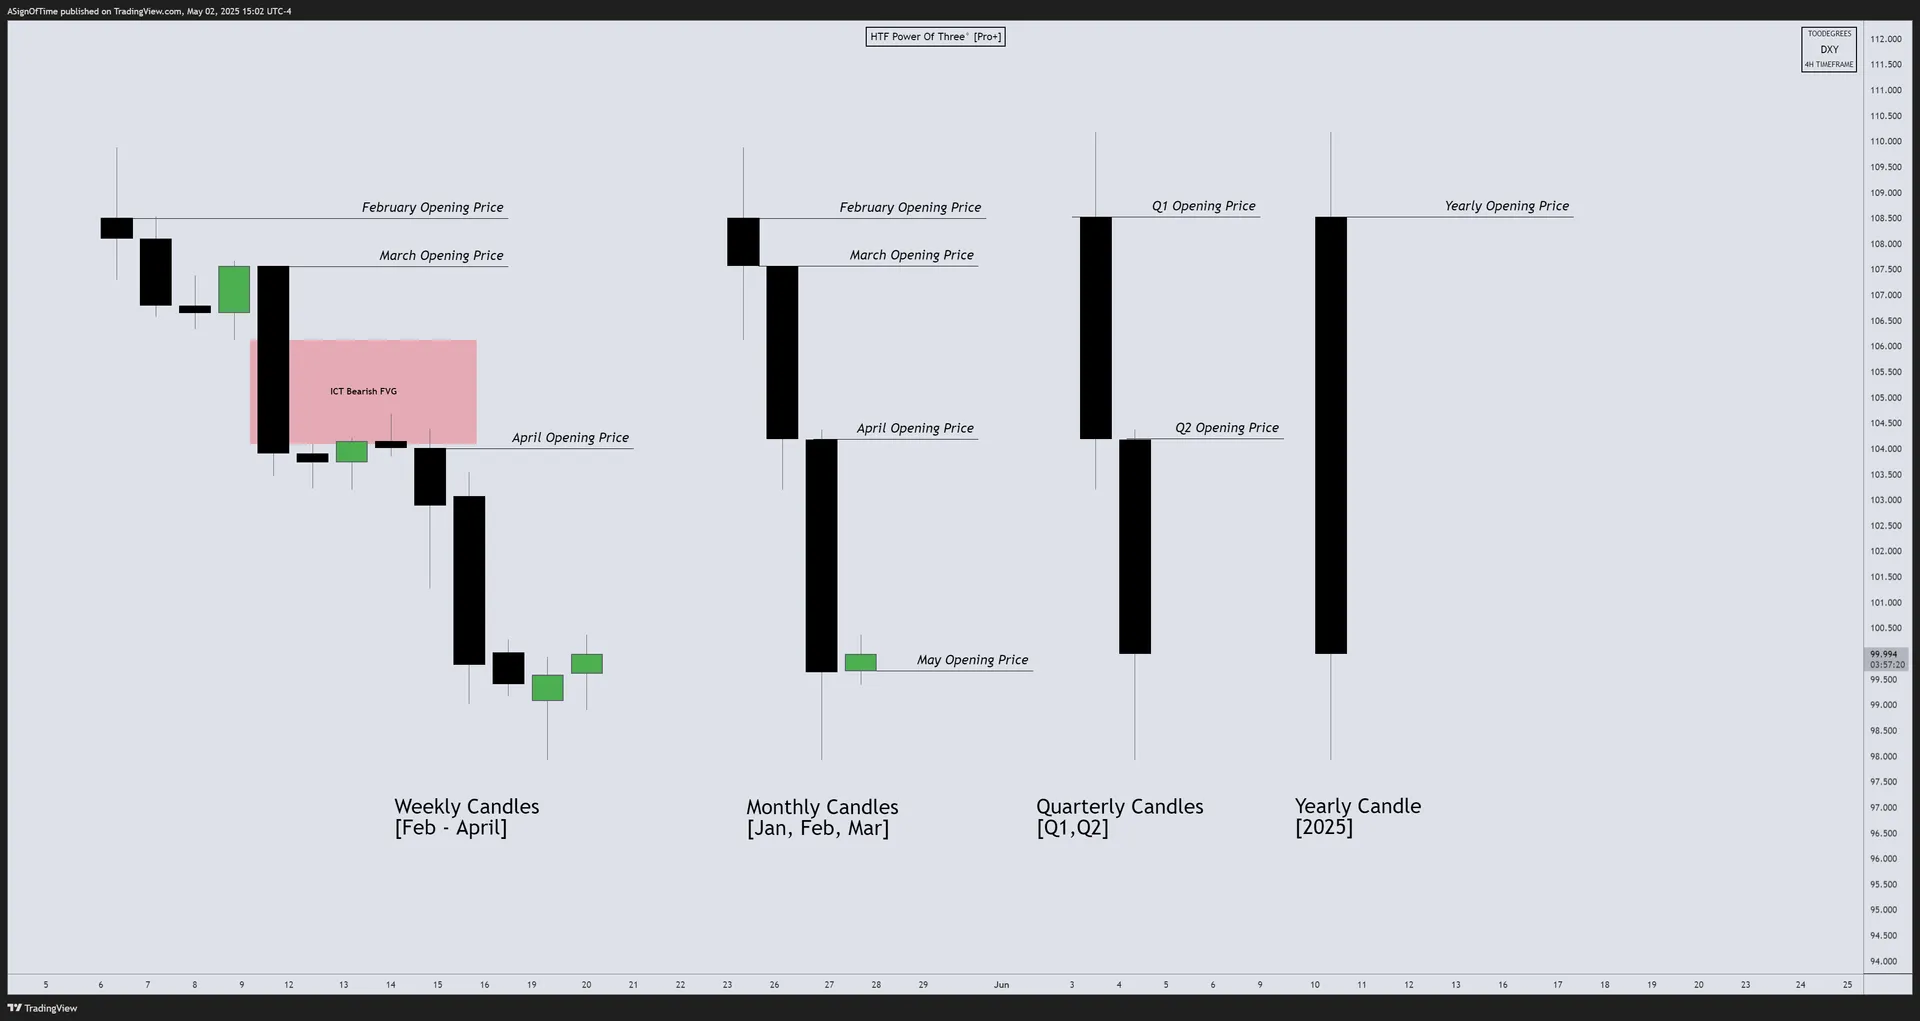
Technical Analysis — US Dollar Index (4H Chart)
The 4-Hour chart on DXY shows two possible scenarios in play. The DXY immediately expanded lower in Q2 and respected all the bearish consolidation phases up until the last week of April. The market has now closed above the most recent consolidation. We could be seeing a possible buyside curve development, in the form of a short/medium-term retracement.
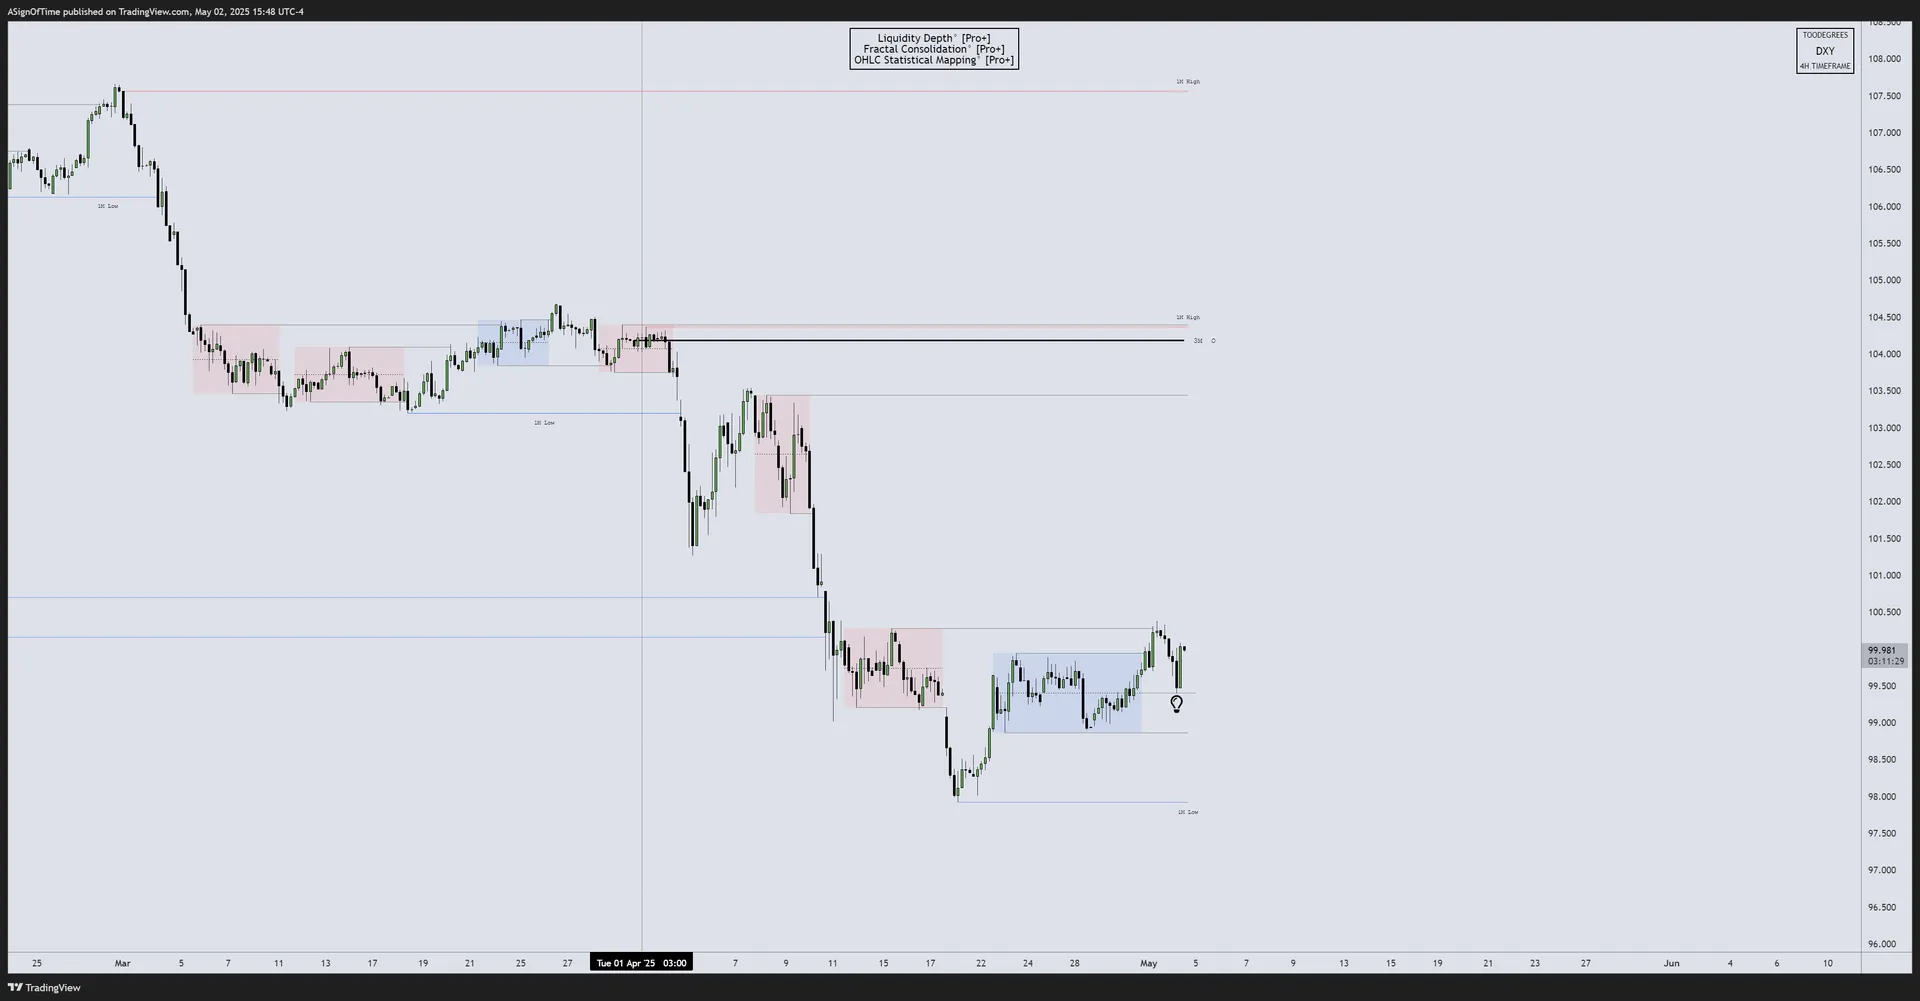
Analyst Insight
When viewing through the lens of Digital Time Theory (DTT), the DXY reached the Average Model Range Probability — the average expansion for a model based on historical data. Eventually DXY closed below it and expanded towards the 2–2.5 Deviation, signalling the completion of the bearish leg. A retracement in May is consistent with seasonal patterns and the potential reversion back into the range.
Seasonality Analysis — US Dollar Index
Seasonal tendencies are recurring patterns in markets that typically repeat around the same time each year. For the DXY, April has historically shown a tendency towards weakness, with May sometimes providing a short-term retracement before potential continuation.
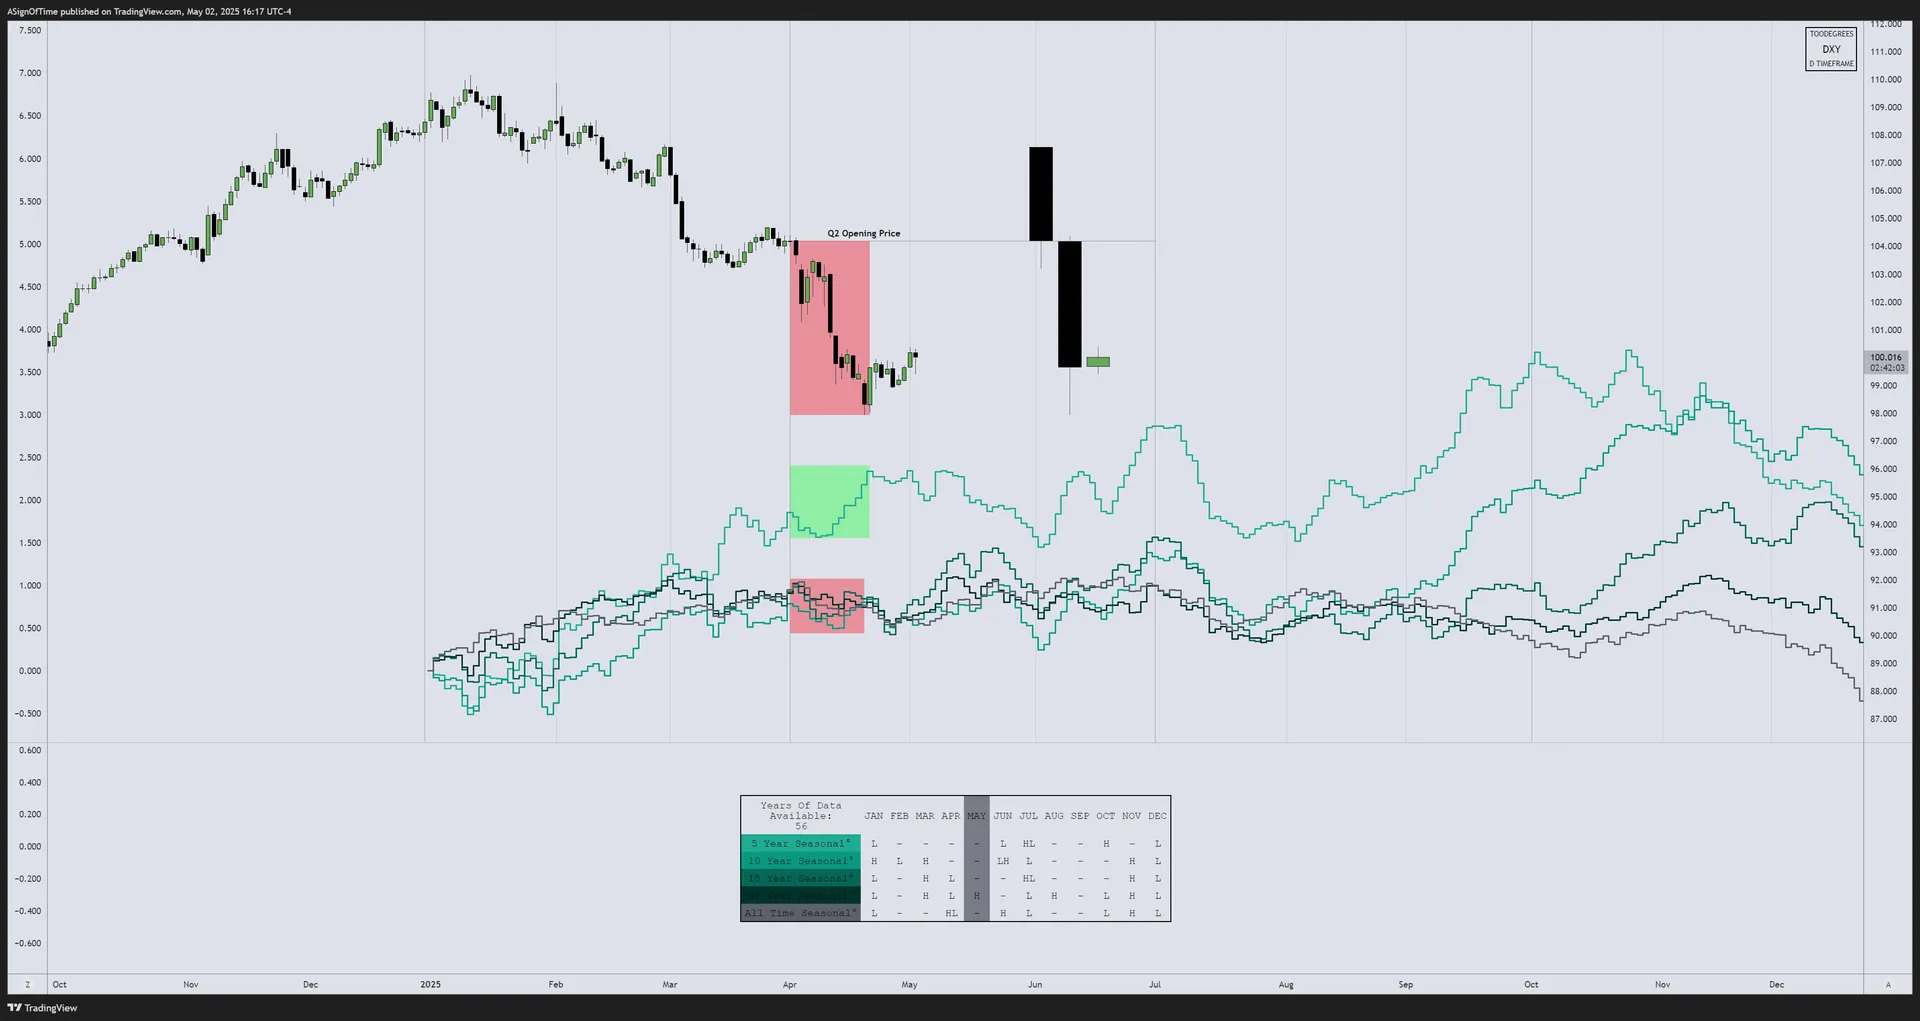
Analyst Insight
In April, the DXY moved aligned with the 10, 15, and 30-year seasonal data, while 5-year data had suggested a strengthening DXY. The potential for a deeper retracement identified in the technical analysis is consistent with seasonal patterns typically observed in May. Seasonal data does not guarantee future results.
Commitment of Traders — US Dollar Index
The COT Report (CFTC, weekly) provides insight into the current positioning of Commercial Traders, Large Traders, and Small Speculators. It highlights the hedging program of commercial participants — who tend to position opposite to the prevailing trend as they hedge their underlying exposure.
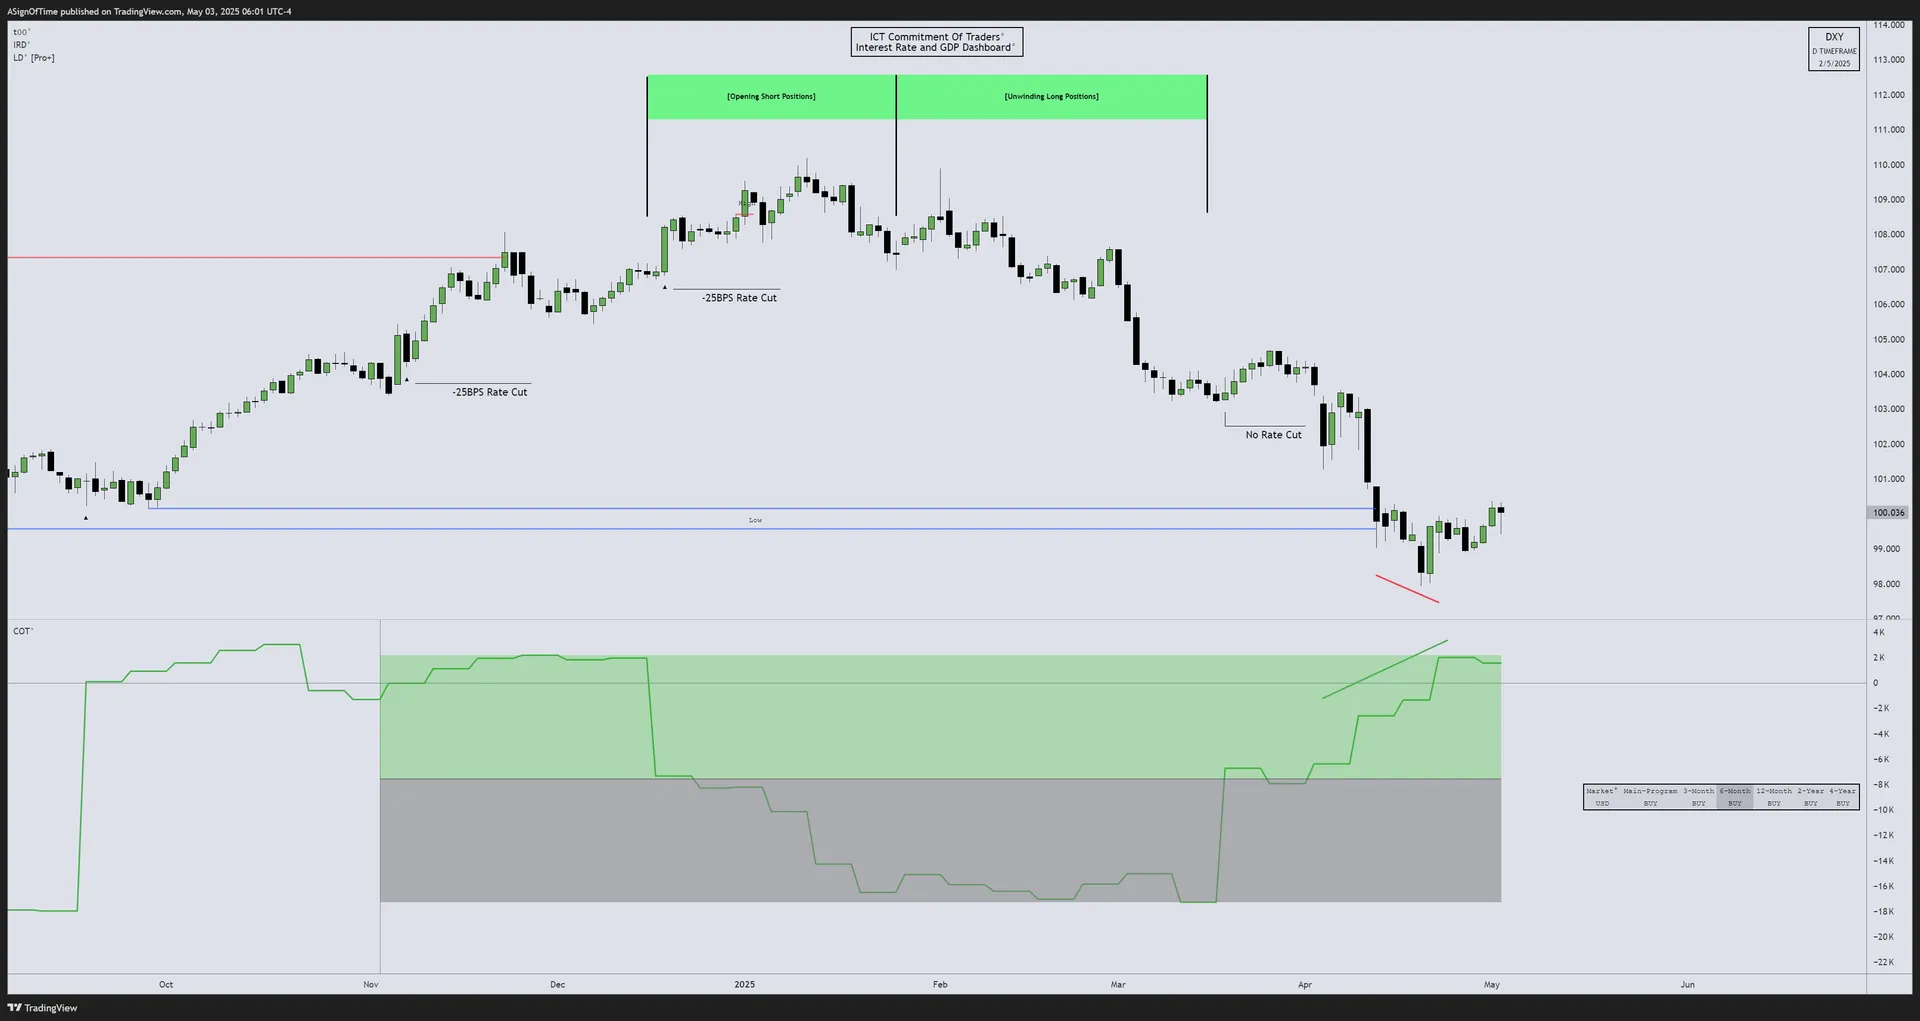
Analyst Insight
A noteworthy development on the COT graph is commercial traders accumulating more long positions while the market has been trading lower — specifically below the 2024 and 2023 sellside liquidity pools. On this chart we can see how commercial traders position themselves, especially around Interest Rate decisions. This supports the short-term retracement possibility outlined in the technical analysis.
Open Interest — US Dollar Index
Open Interest for the DXY provides insight into the total number of outstanding futures contracts. Comparing current OI to the seasonal average reveals whether market participants are increasing or reducing their overall exposure.
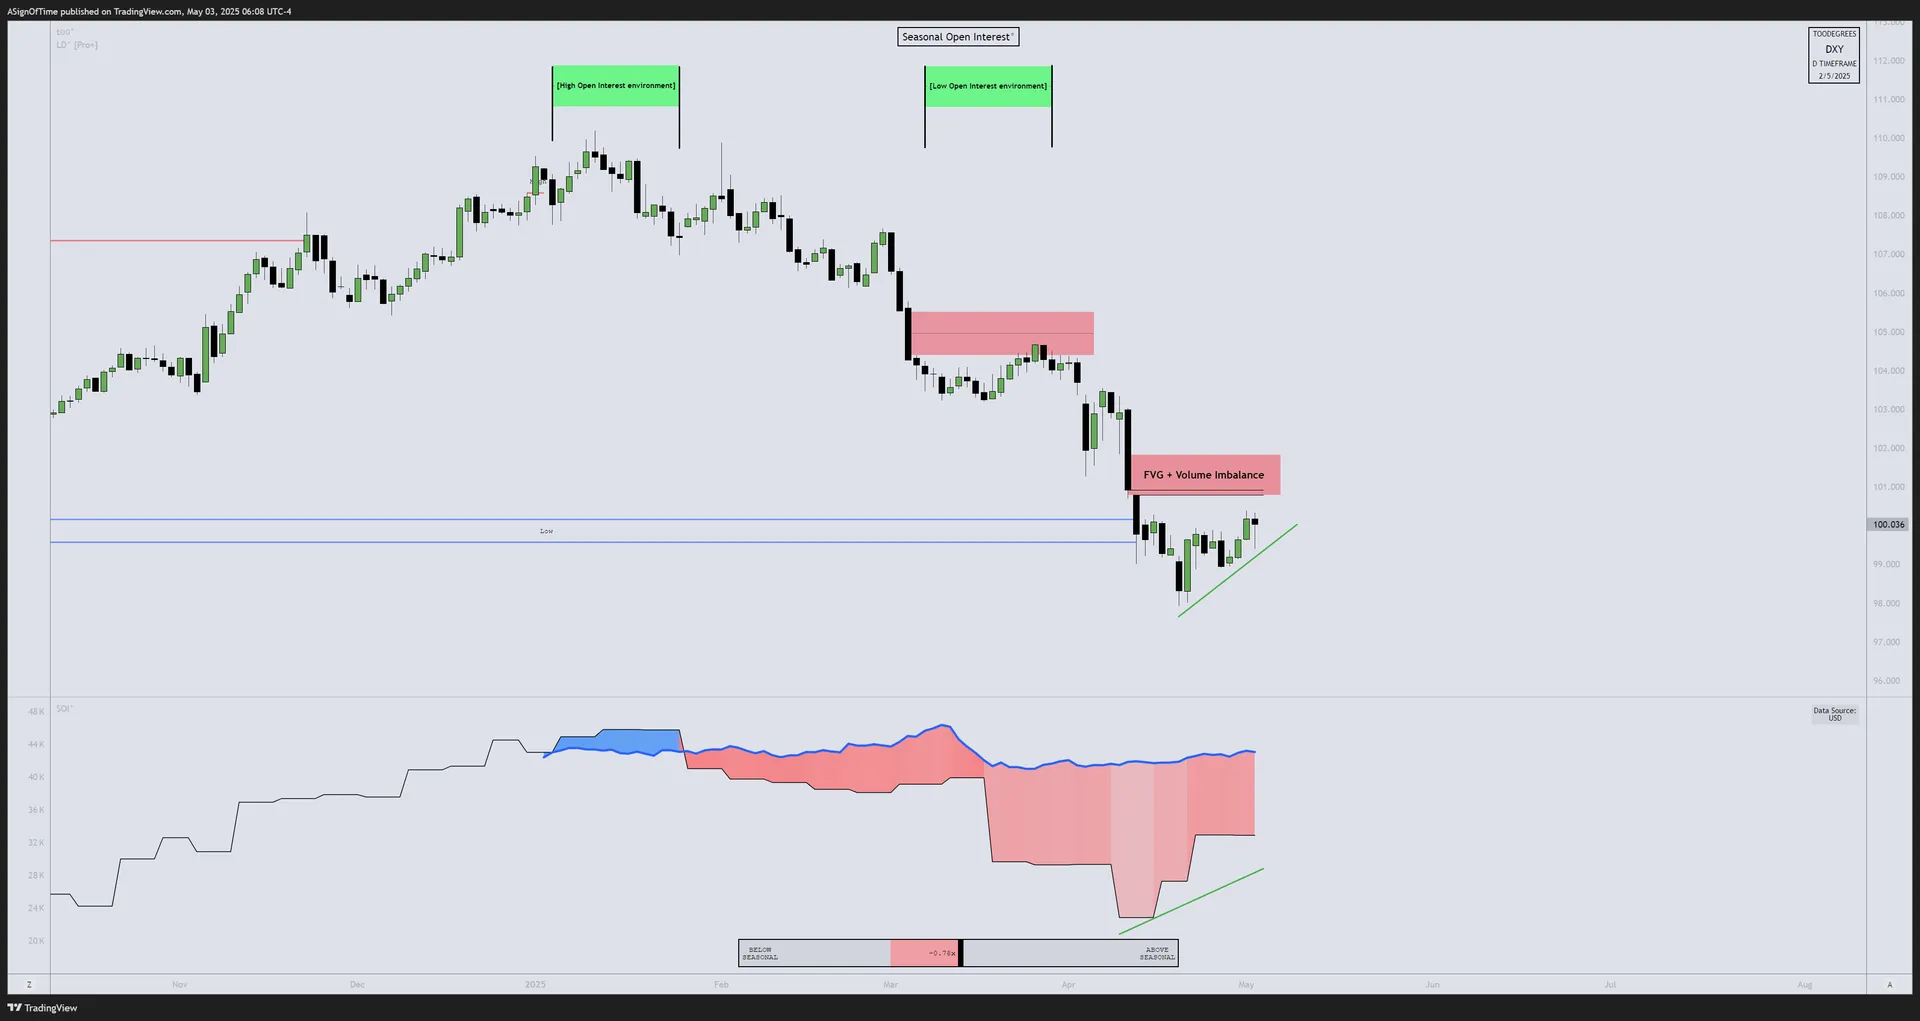
Analyst Insight
The previous report outlined how the lack of open interest accompanied by a climbing DXY would most likely result in the downtrend continuing rather than a reversal — and since then, the DXY has dropped massively. Now we are seeing the opposite: the DXY is slowly climbing higher while Open Interest is rising and Commercial Traders are adding long positions. This could indicate the DXY is seeking higher prices in the near term.
Multi-Asset Analysis — Currency IPDA (March Anchored)
On these charts, the IPDA Lookback tool has been anchored at the start of April 1st, 2025. This allows us to view how March moved relative to the 60-day lookback, while also measuring Relative Strength across DXY, EUR/USD, and GBP/USD.
[US DOLLAR INDEX]
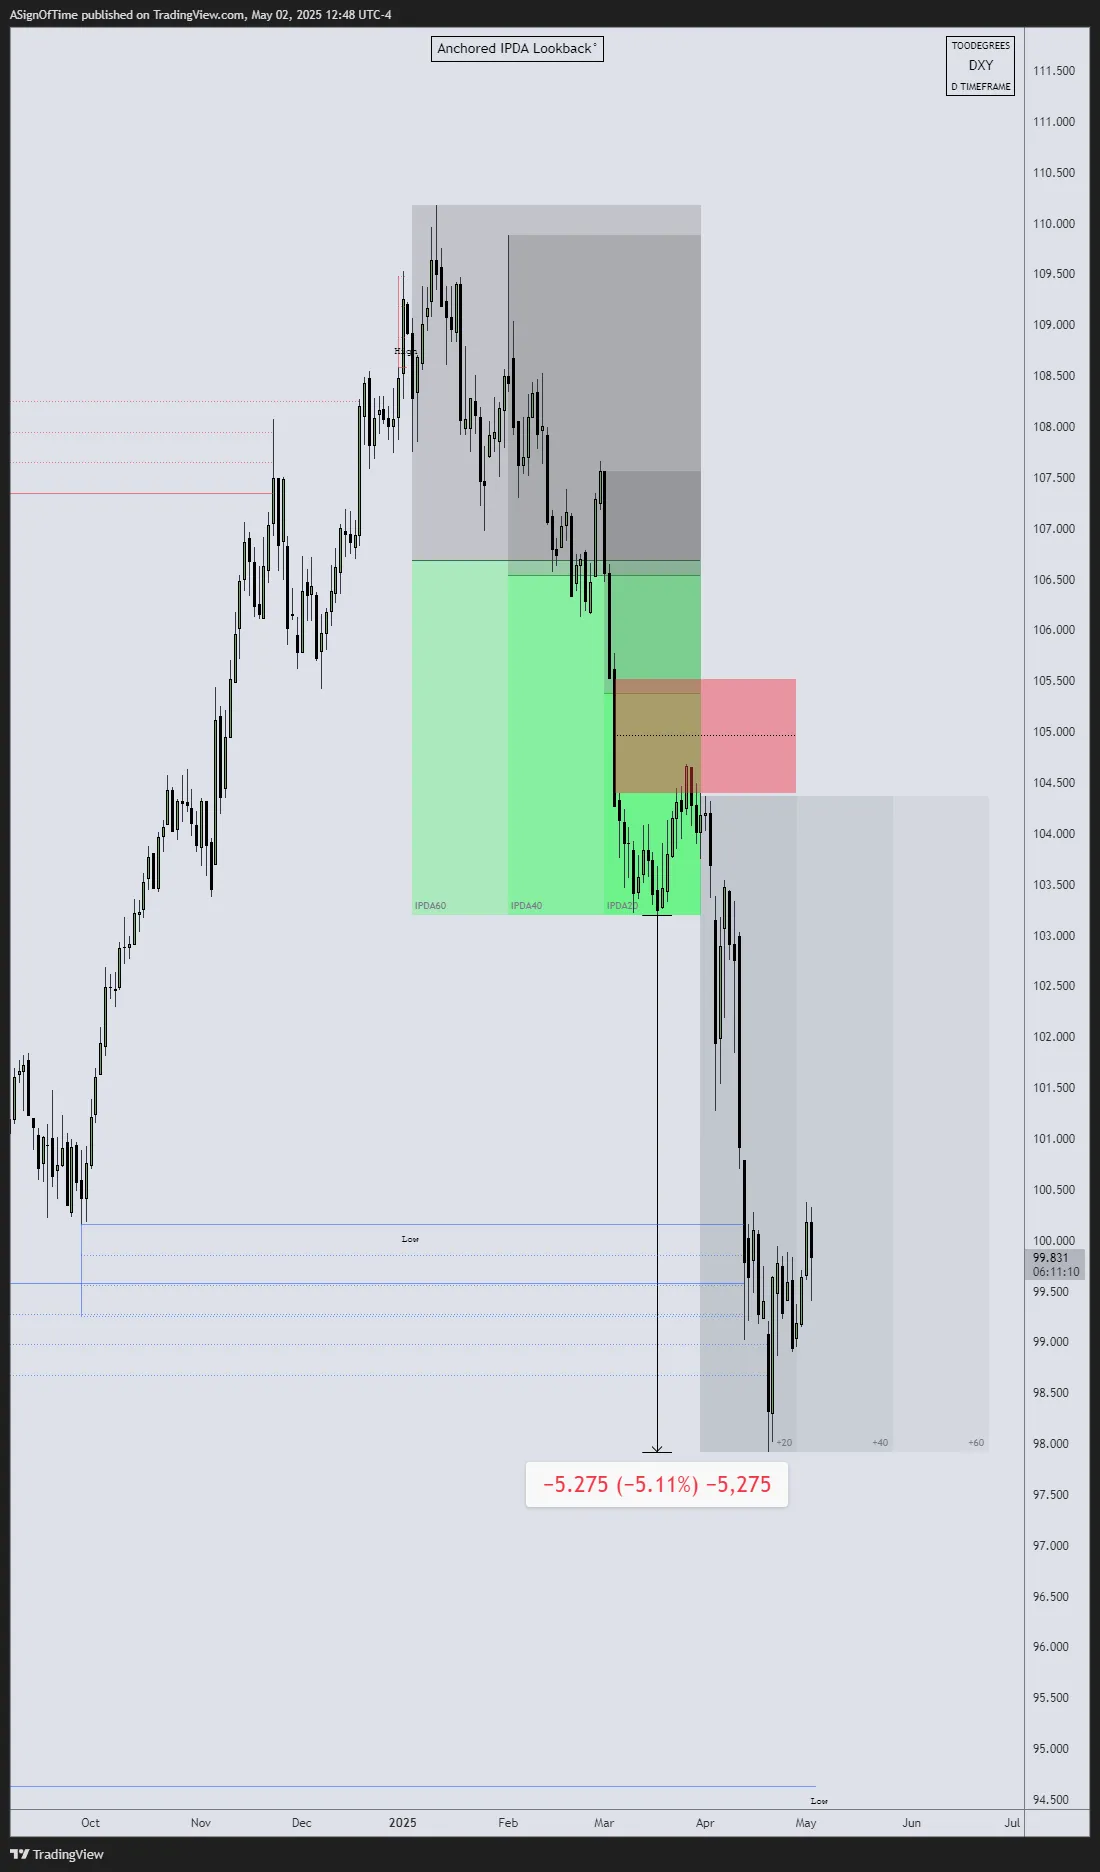
-5.11% below pool
[EUR/USD]
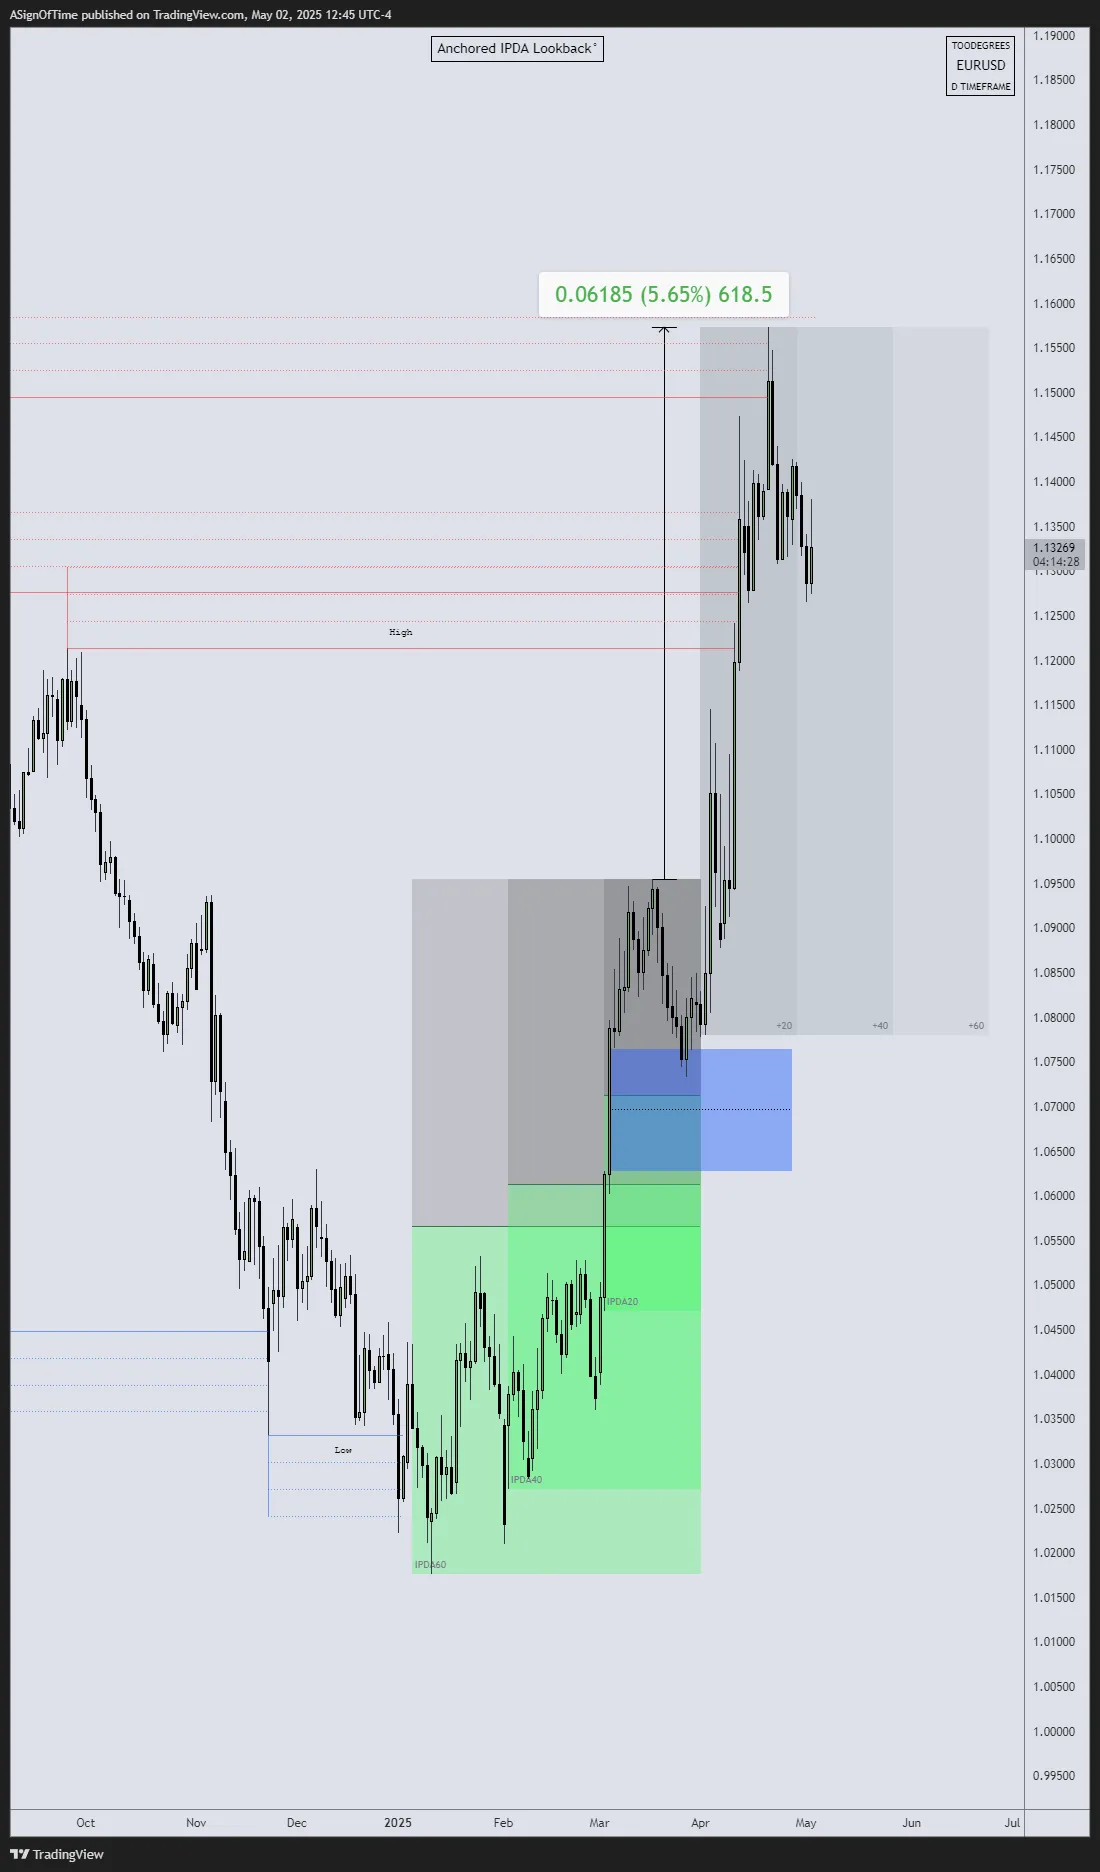
+5.65% at peak
[GBP/USD]
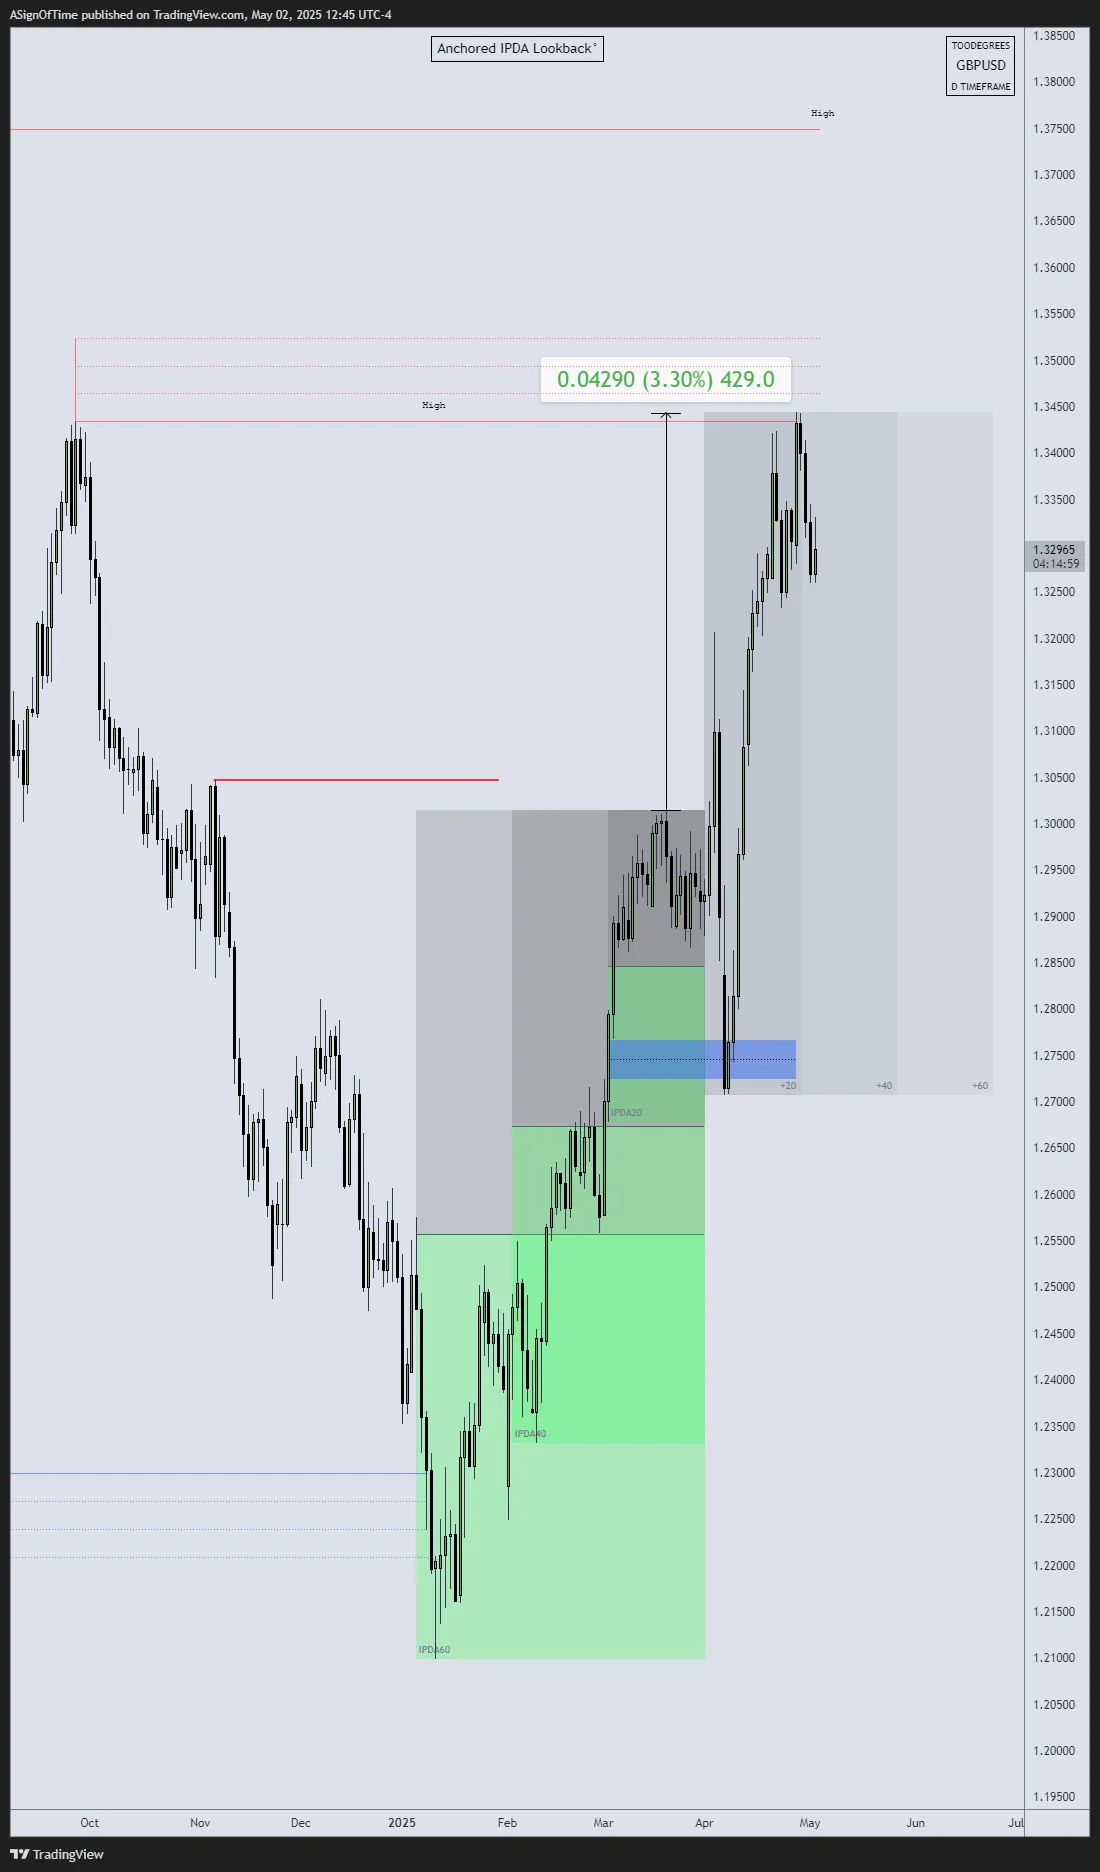
+3.30% above pool
Analyst Insight
The DXY traded below the 60-Day IPDA Lookback Liquidity pool as well as the 2024 Low, expanding -5.11% lower. The Euro, at its peak, gained +5.65% — all while hitting the same objectives as the DXY (mirror relationship). The Great British Pound increased +3.30% above the IPDA 60-Day Lookback Liquidity Pool, but failed to trade above the 2022 High — signalling a weaker Pound relative to the Euro. The Strength Leader is the Euro.
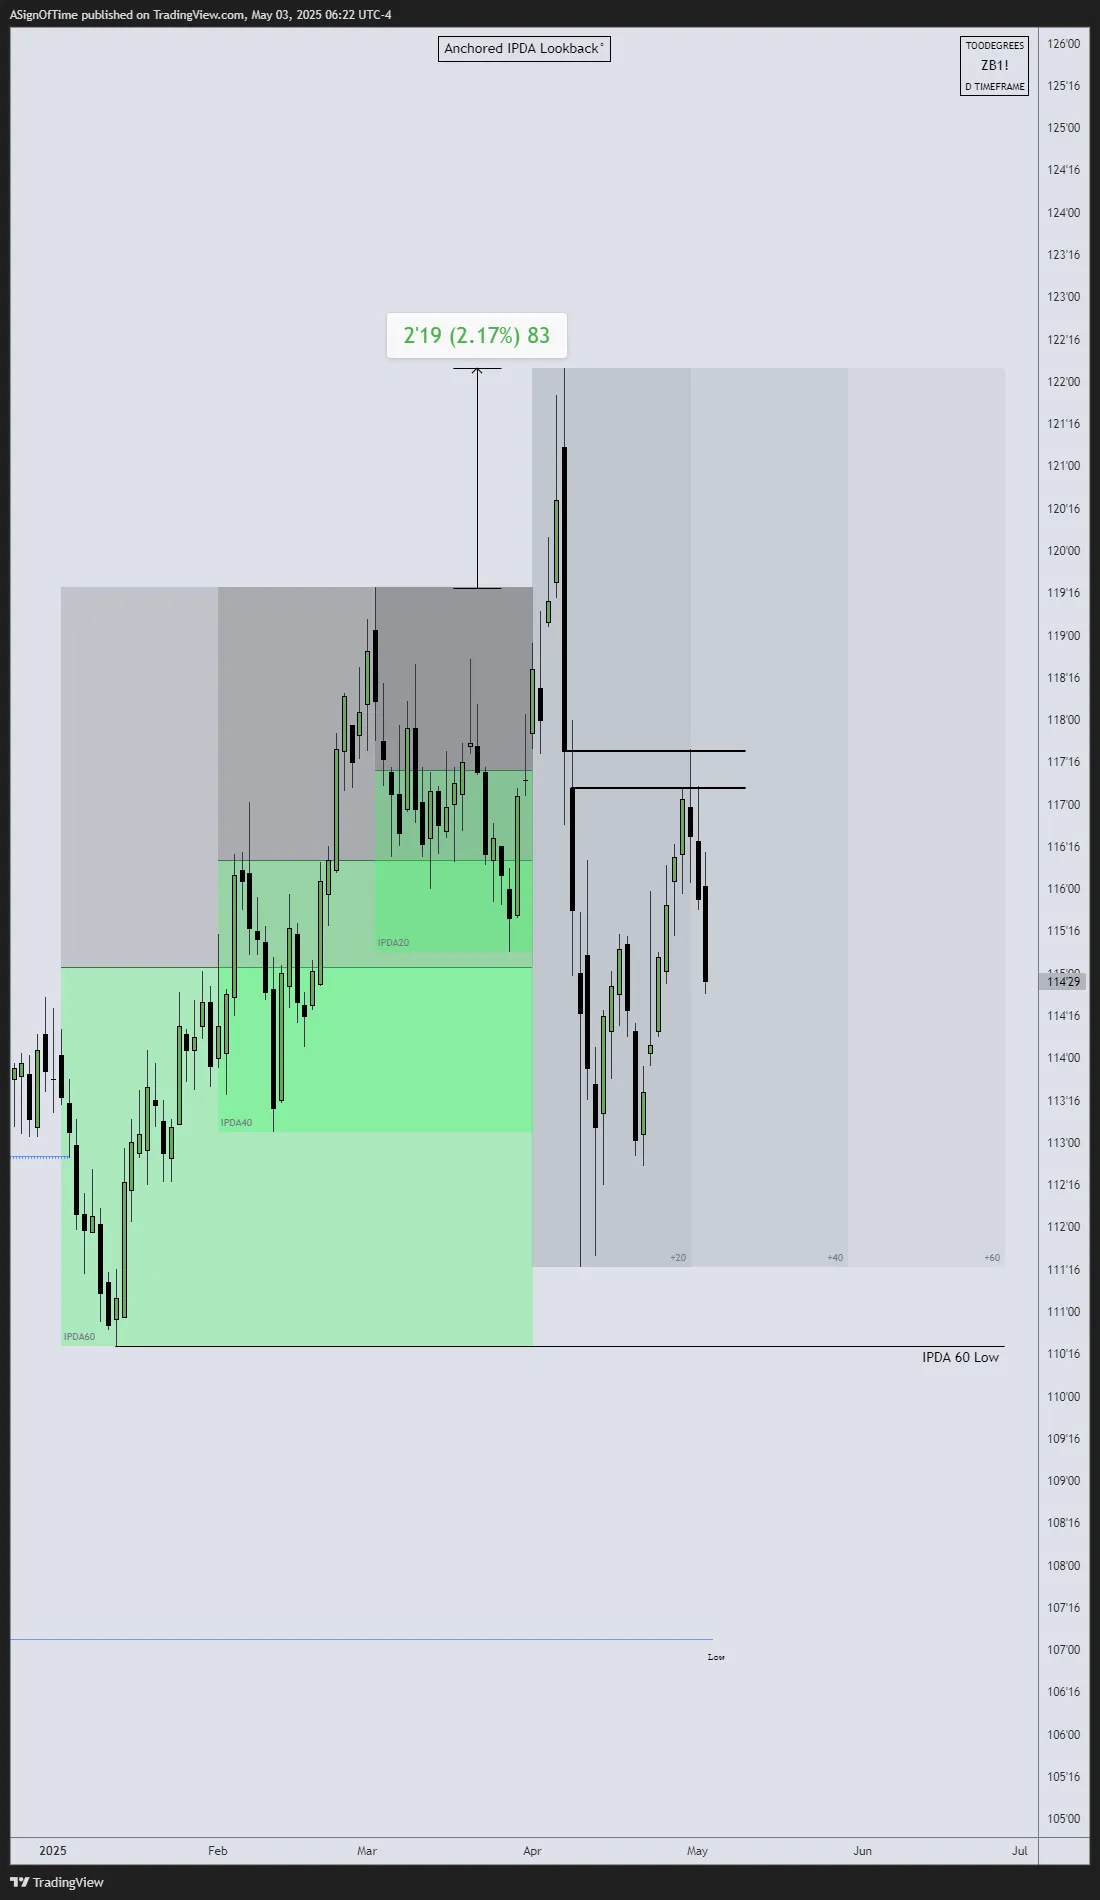
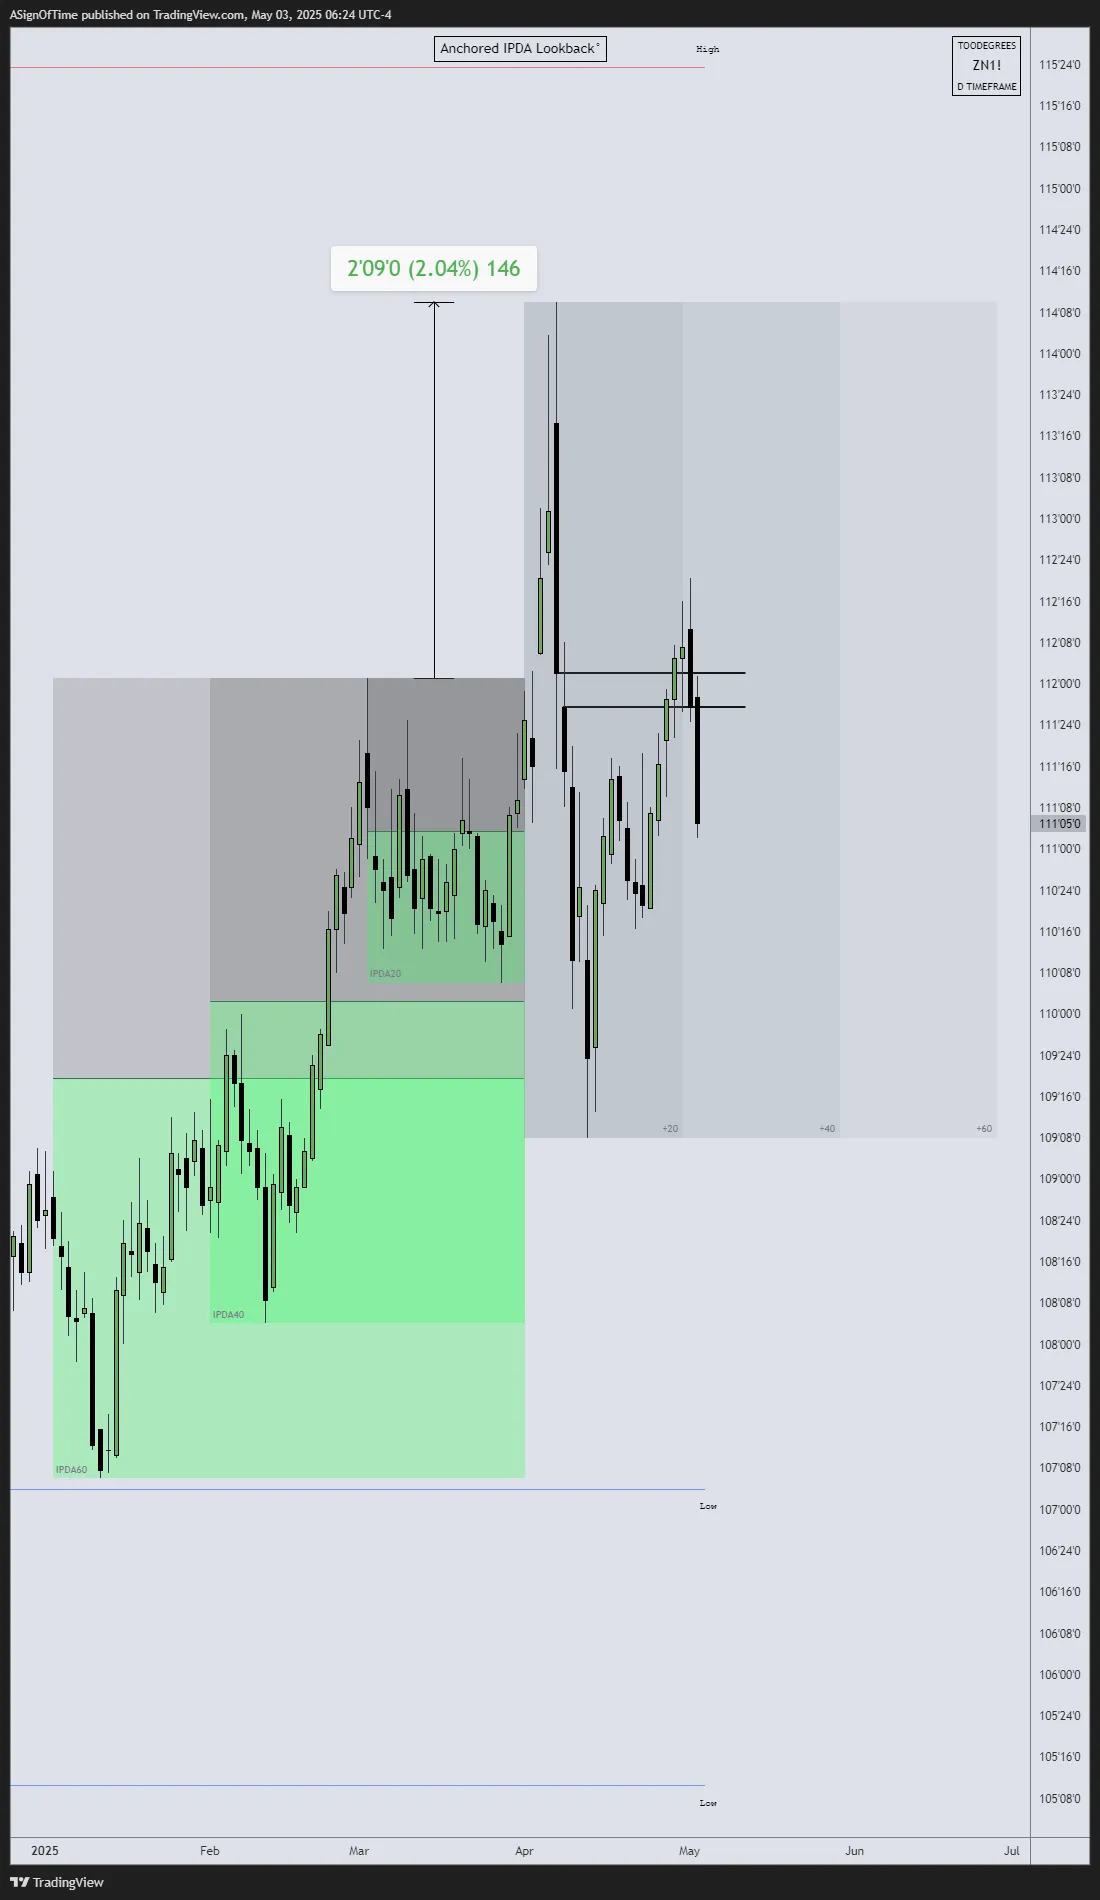
Multi-Asset Analysis — Bond Futures (April Anchored)
The IPDA Lookback tool anchored at April 1st, 2025 across three US Bond Futures: 30-Year T-Bond ($ZB), 10-Year T-Note ($ZN), and 5-Year T-Note ($ZF). This provides insight into relative strength across the yield curve.
[30-YEAR T-BOND $ZB]
[10-YEAR T-NOTE $ZN]
[5-YEAR T-NOTE $ZF]
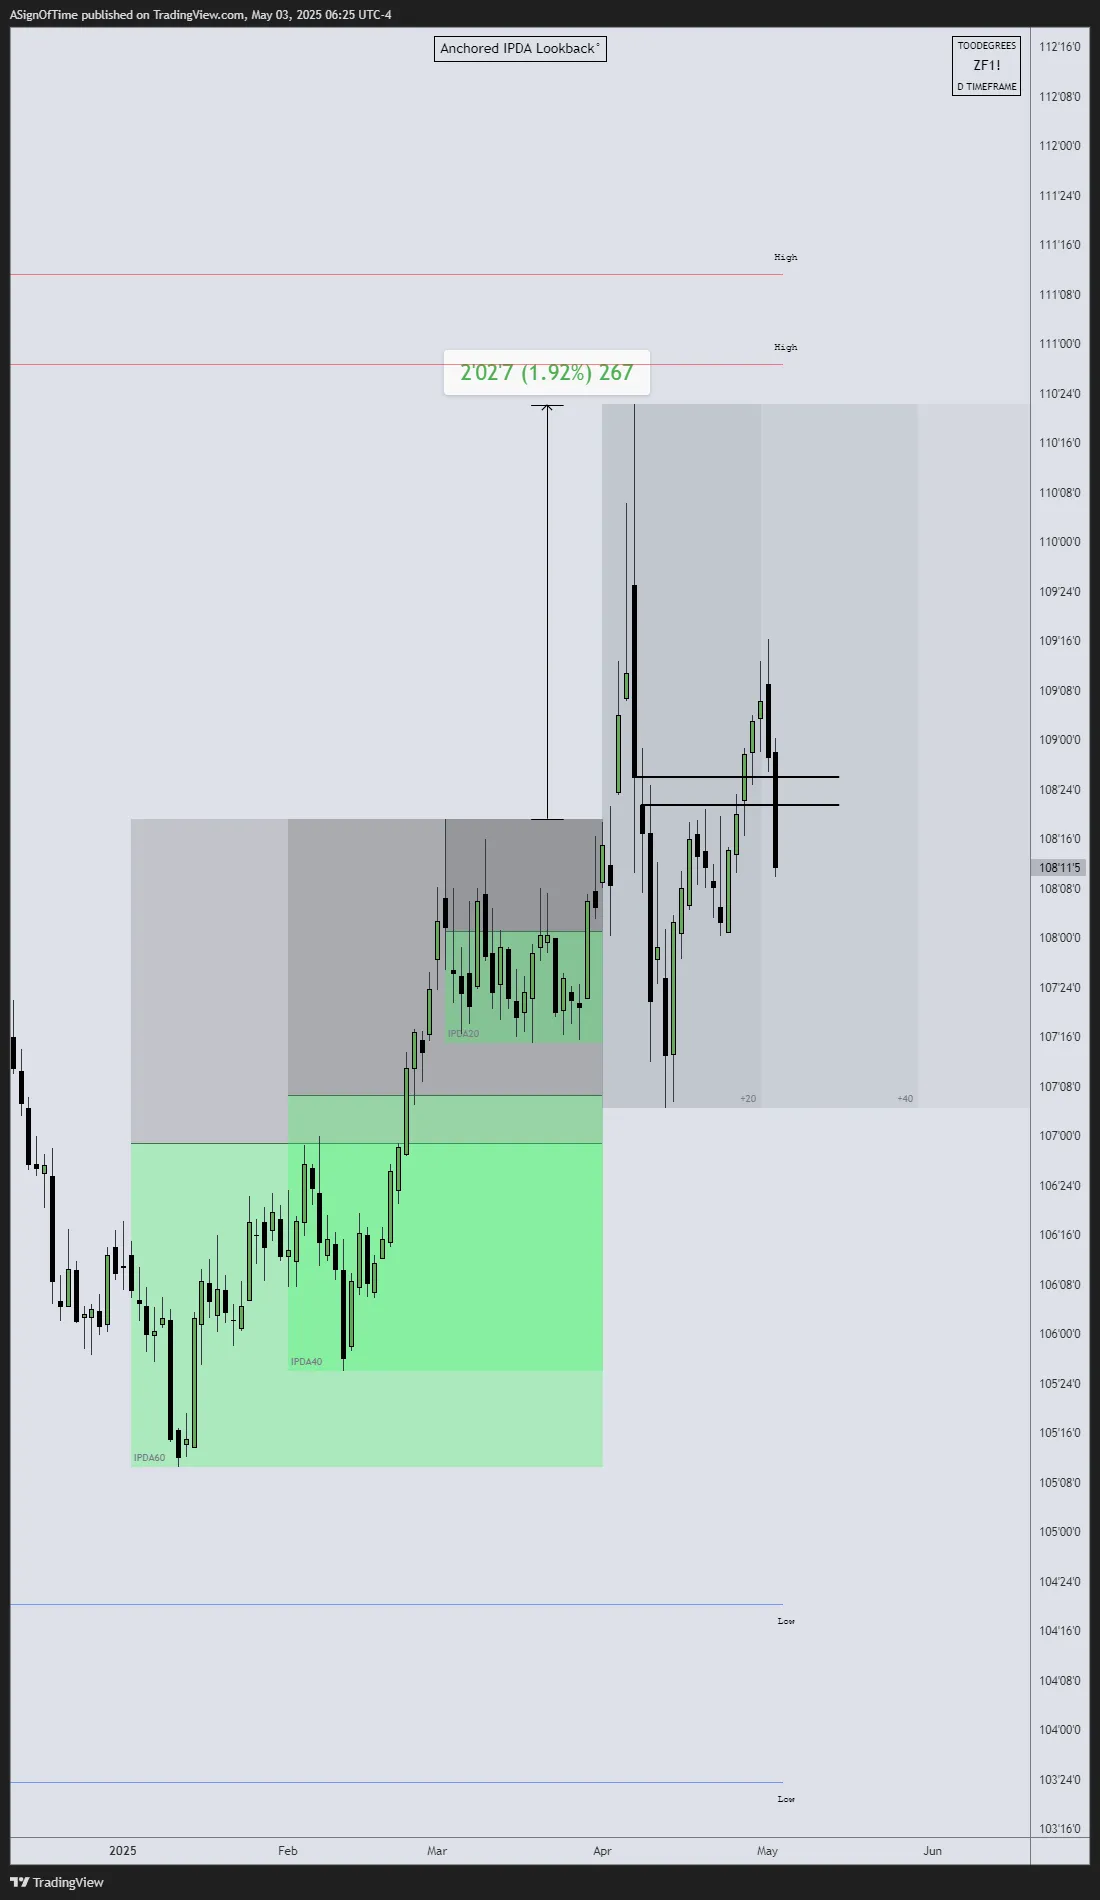
Analyst Insight
All three Bond Futures traded above the IPDA20 Liquidity Pool and have since returned into the lookback price range. Currently the bonds find themselves at a crossroad — they could either regain their strength to move higher, or continue their way down towards the midpoint of the range and eventually sellside targets.
Yield Curve — US Treasuries
The Yield Curve of U.S. government bonds provides insight into how returns vary based on the length of time investors hold Treasury securities. It illustrates the expected annual return for different maturities and helps investors understand interest rate trends and economic outlook.
As of May 2, 2025, the U.S. Treasury yield curve has steepened compared to one month ago, reflecting shifts in investor expectations regarding inflation, economic growth, and Federal Reserve policy. This configuration indicates a normal (upward-sloping) yield curve, where longer-term bonds yield more than shorter-term ones — suggesting investor confidence in future economic growth.
Source: ustreasuryyieldcurve.com
Section 4
Additional Resources
Free TradingView Tools
All indicators referenced throughout this report are available on TradingView. The following tools are free and open to all traders:
Interest Rate & GDP Dashboard
by toodegrees — Free on TradingView
April Top Performers Watchlist
TradingView Watchlist — Free
ICT Anchored IPDA Ranges
by toodegrees — Free on TradingView
ICT Commitment of Traders
by toodegrees — Free on TradingView
Seasonal Open Interest
by toodegrees — Free on TradingView
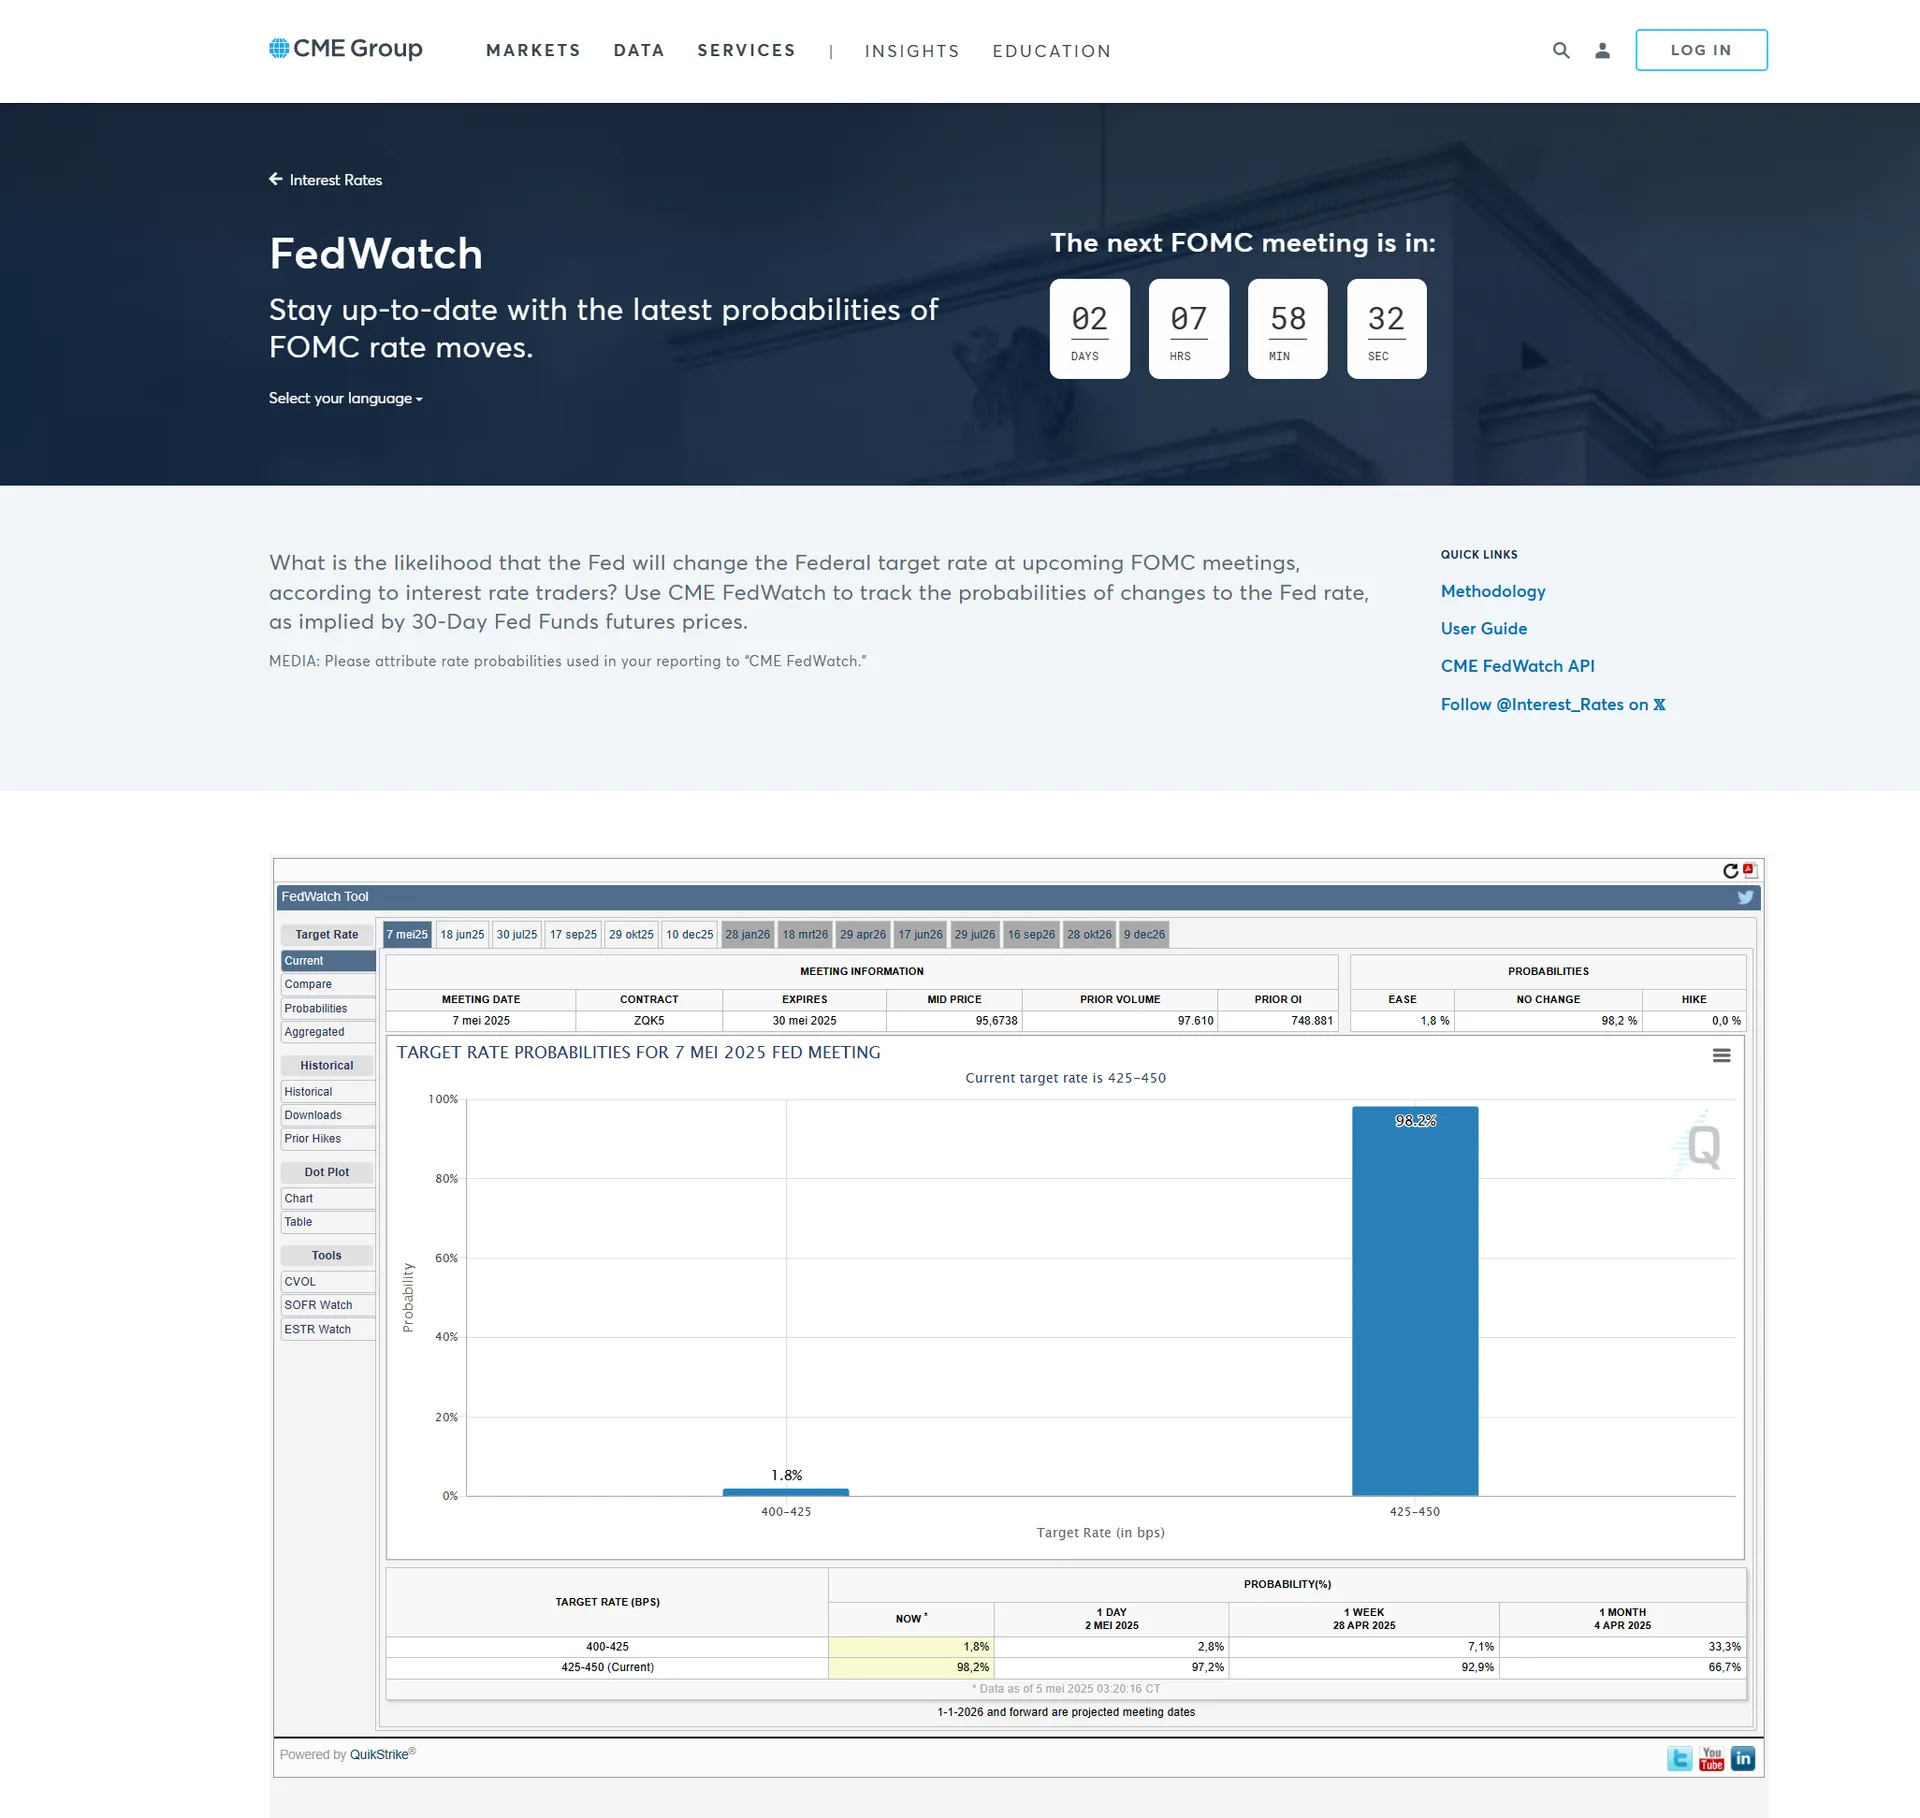
CME FedWatch Tool
CME Group — Track Fed Rate Expectations
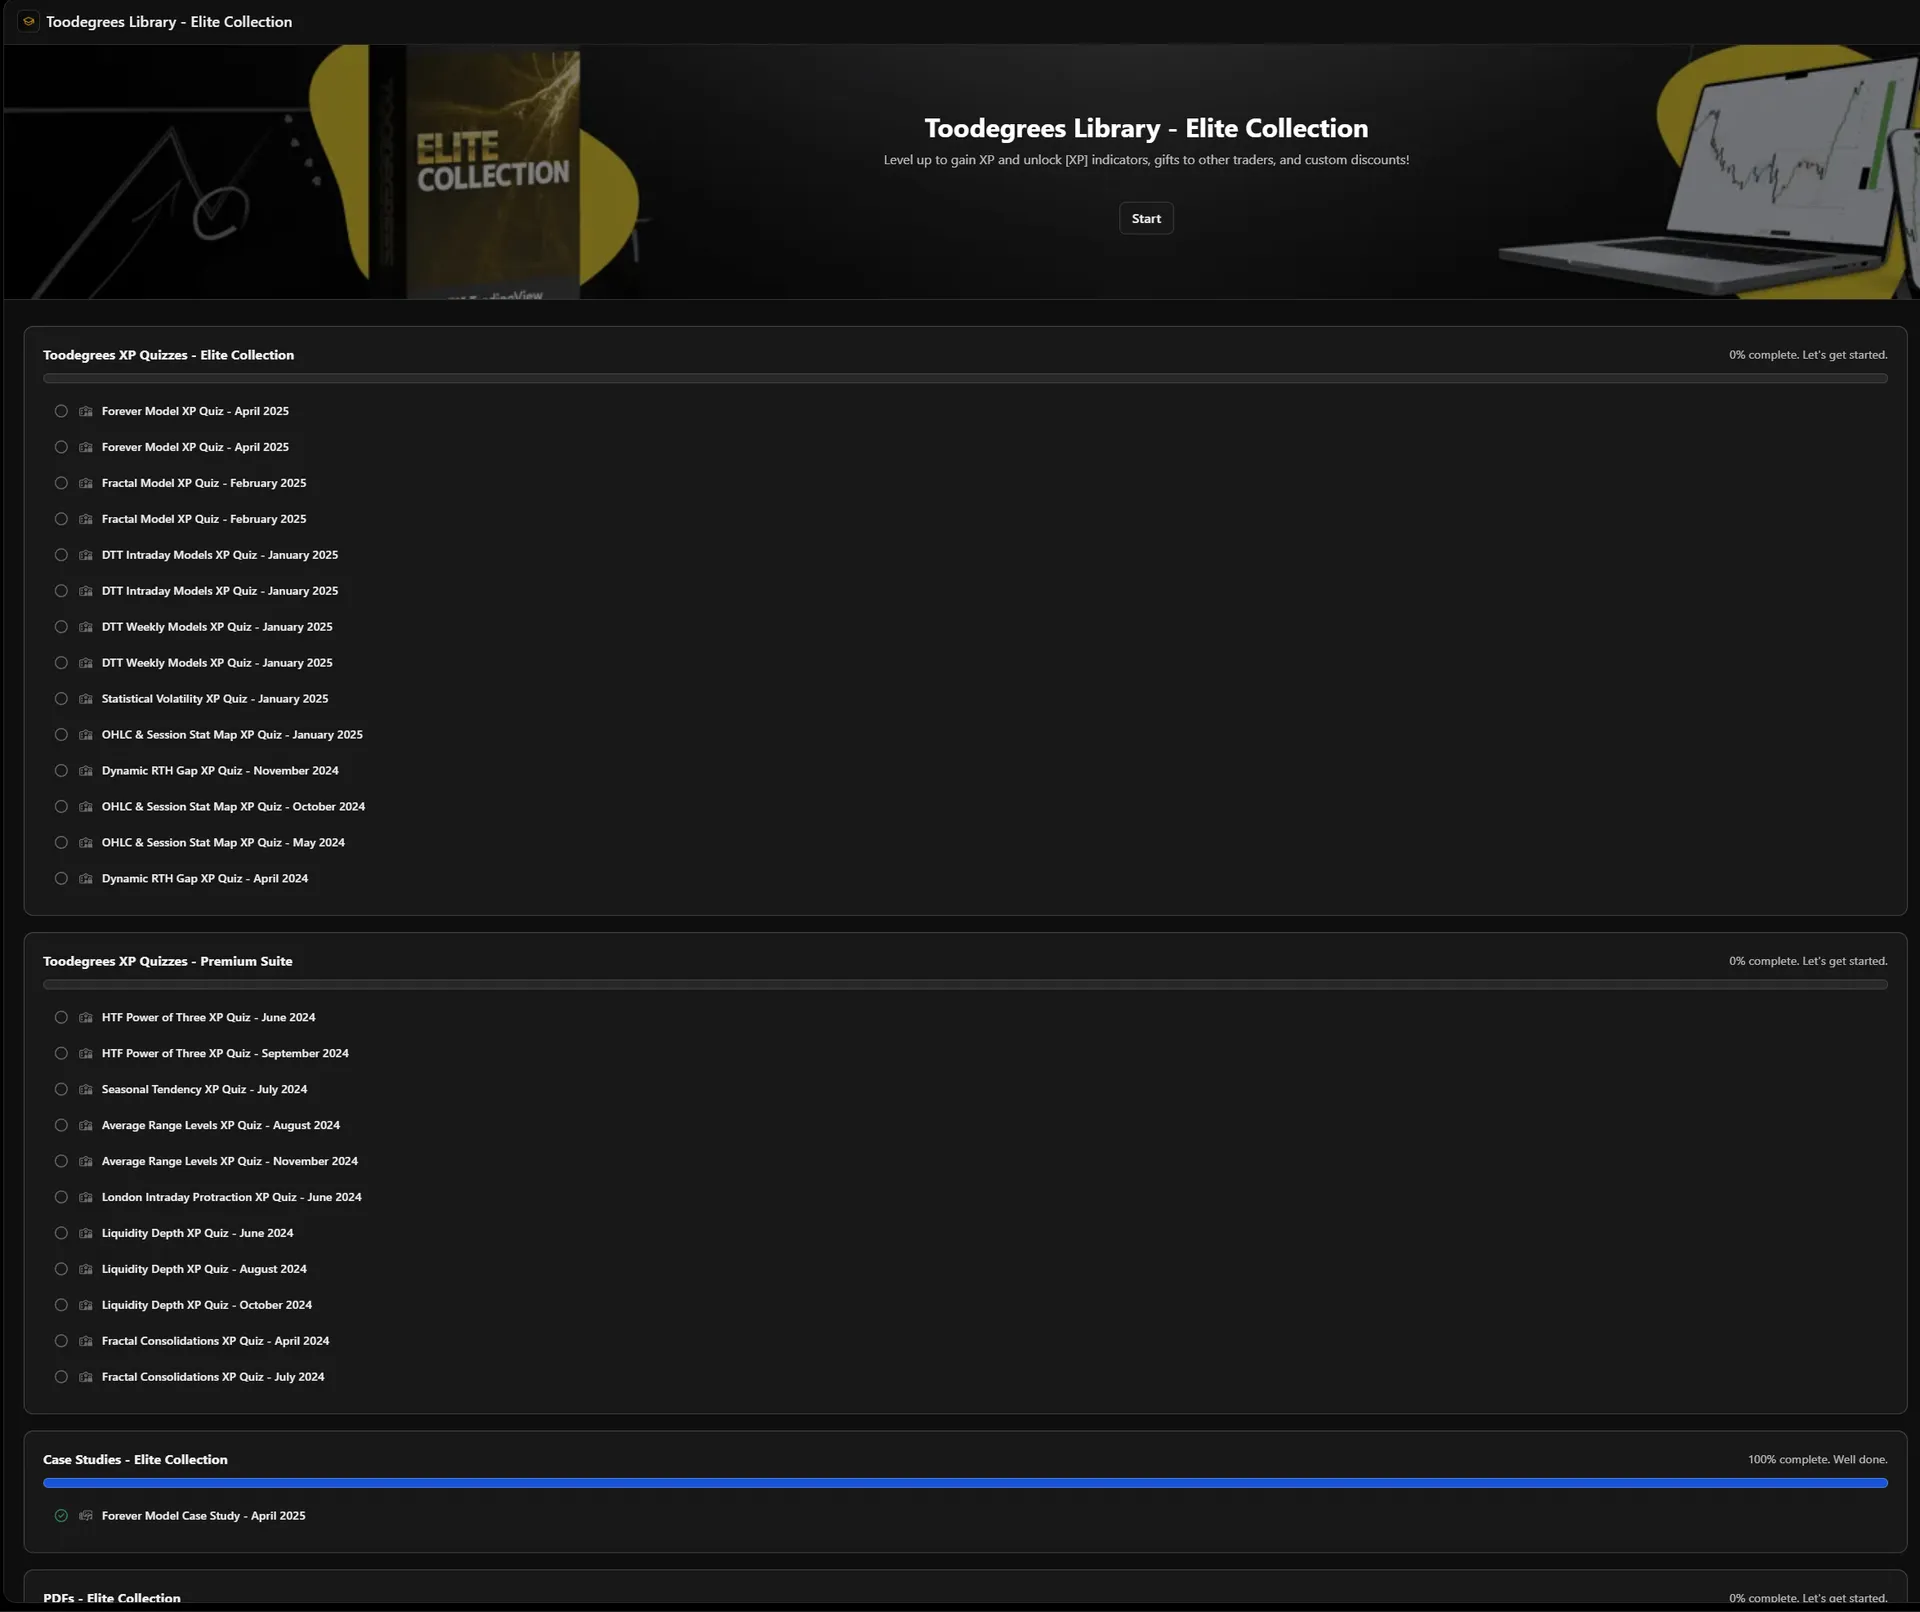
Community Resources
Access the full EOM Report, past reports, and live analysis from the Toodegrees Library. The Escape Livestream by A Sign Of Time covers the full April analysis in video format.

Section 5
Conclusion — Analysis Recap
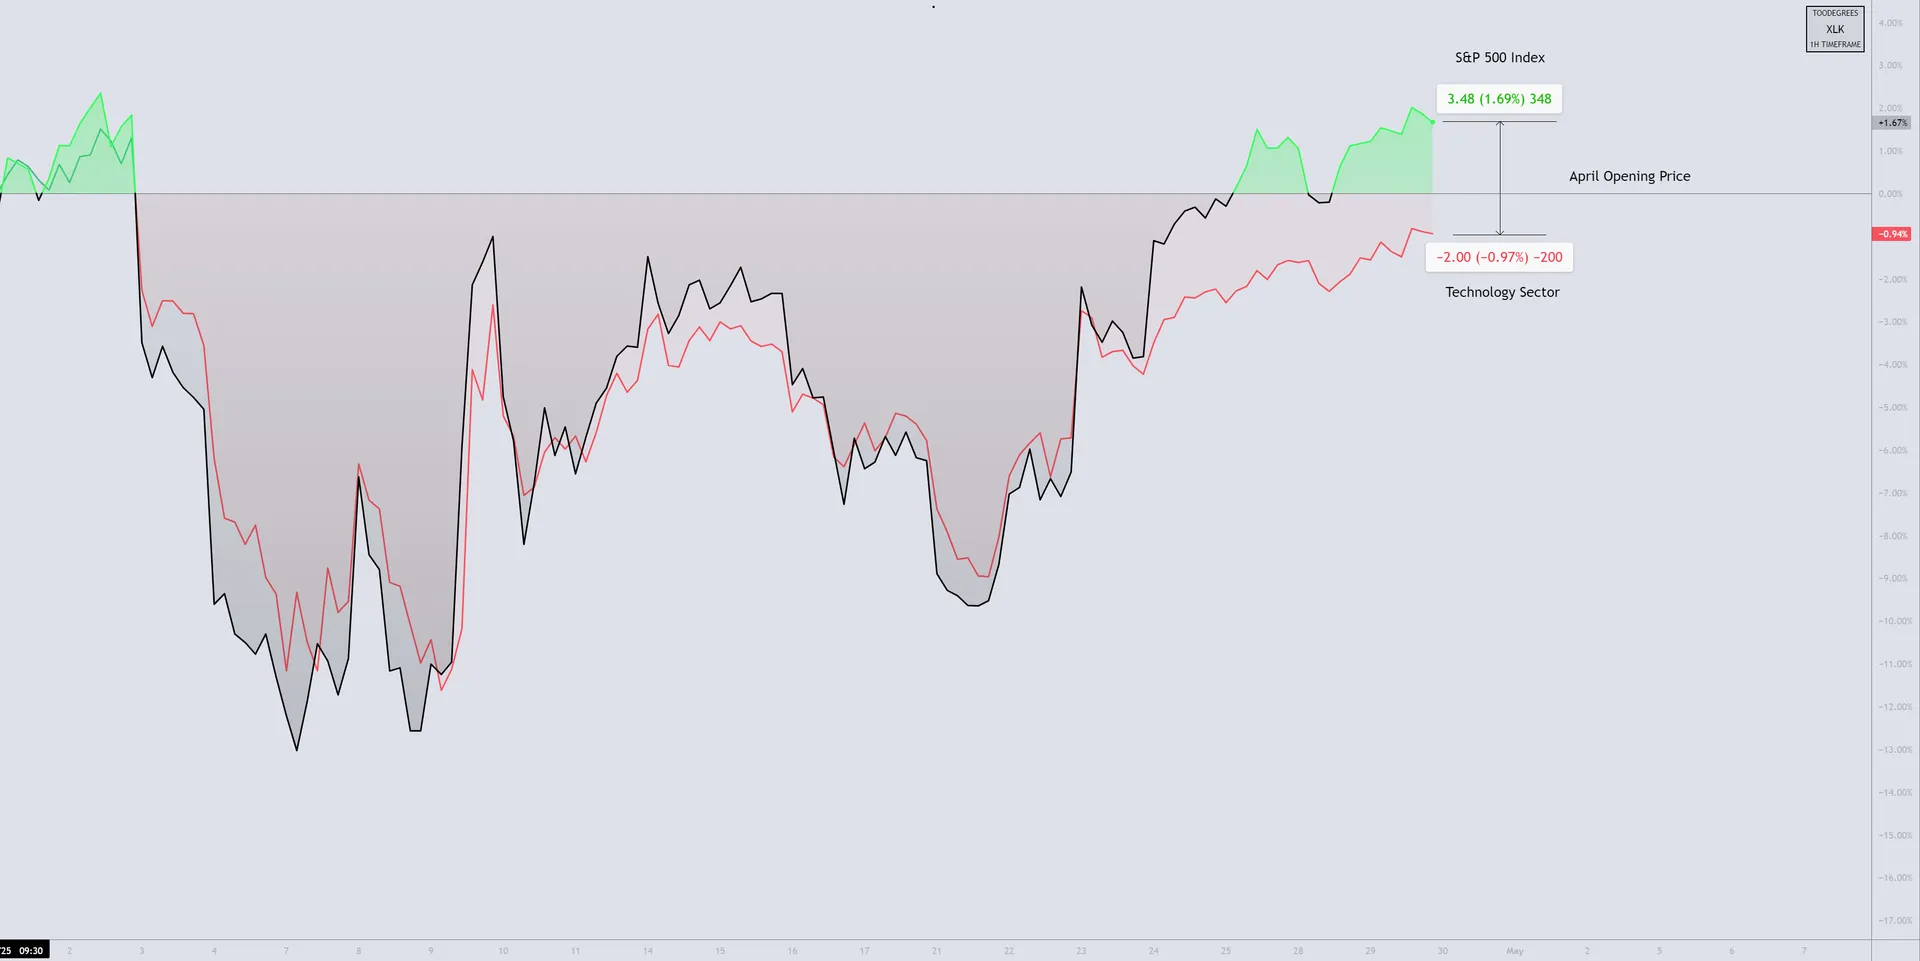
April was defined by renewed tariff uncertainty, soft economic growth, and defensive sector rotation. Technology underperformed despite long-term AI optimism, while utilities and healthcare attracted inflows.
US indices showed relative divergence, with the Nasdaq recovering early losses to close higher — outperforming the Dow and S&P 500. Price structure pointed to ongoing accumulation and potential bullish continuation heading into May.
In currency markets, the US Dollar extended its decline, while the Euro emerged as the strength leader — driven by seasonal alignment and strong commercial accumulation. GBP underperformed relative to the Euro, failing to break the 2022 highs.
Bond futures retraced from recent highs, and the yield curve steepened over the month, suggesting a modest return of growth expectations — but leaving room for continued caution around Fed policy and inflation dynamics.
Across asset classes, seasonality, technical structures, and commercial trader behavior indicated a cautious but potentially shifting tone heading into May. The convergence of seasonal data, IPDA Lookback targets, and COT signals across multiple markets provides a compelling macro backdrop to monitor closely.
Toodegrees Library