August 2025 EOM Report — Inter Market Dynamics

Written by
A Sign Of Time
Head of Education & Toodegrees Analyst

Section 1
Monthly Recap — US Indices
Welcome to the August End-of-Month Market Recap, covering August's price action across U.S. equity futures, FX pairs, and Treasury bonds. Equity indices pulled back sharply mid-month before stabilizing, while the Dollar Index extended its July rebound amid shifting rate expectations and seasonal positioning adjustments.
Recent Events — Market Volatility Returns
August saw an abrupt return of volatility, driven by weaker-than-expected U.S. payrolls (early August) and renewed concerns over growth momentum. The VIX spiked above 40 intraday during the first week, marking the highest reading since the COVID-era panic. Equities briefly sold off sharply before stabilizing mid-month as Fed officials signaled readiness to adjust policy if needed. By month-end, indices recovered roughly half of the initial decline, but uncertainty remained elevated heading into September.
Key Elements
Volatility Spike: VIX breached 40 — a reminder that complacency can unwind quickly, especially in historically choppy late-summer sessions.
Fed Pivot Signals: Dovish commentary from Fed officials helped arrest the decline, suggesting rate cuts may come sooner than previously expected.
Seasonal Weakness: August historically sees lighter volumes and elevated tail risks — this year was no exception.
August Results — US Index Futures
In August, U.S. equity futures experienced heightened volatility. The Nasdaq-100 ($NQ) declined -0.89%, pressured by profit-taking in mega-cap tech and AI-related names. The S&P 500 ($ES) fell -2.33%, reflecting broader risk-off sentiment and macro uncertainty. The Dow Jones ($YM) dropped -2.05%, with value and industrial sectors also feeling the pressure.
$NQ = E-Mini Nasdaq 100 Futures · $ES = E-Mini S&P 500 Futures · $YM = E-Mini Dow Jones Futures
Sentiment Analysis
AAII Investor Sentiment (August 31): Bullish sentiment fell to 31.8% — well below the long-term average of 37.5%. Bearish jumped to 41.2%, reflecting the sharp intra-month selloff. Fear & Greed Index (August 31): 48 — Neutral. The spike in volatility and elevated bearish positioning suggests caution, but contrarian signals may emerge if sentiment becomes overly pessimistic.
Section 2
Technical Analysis — Nasdaq 100
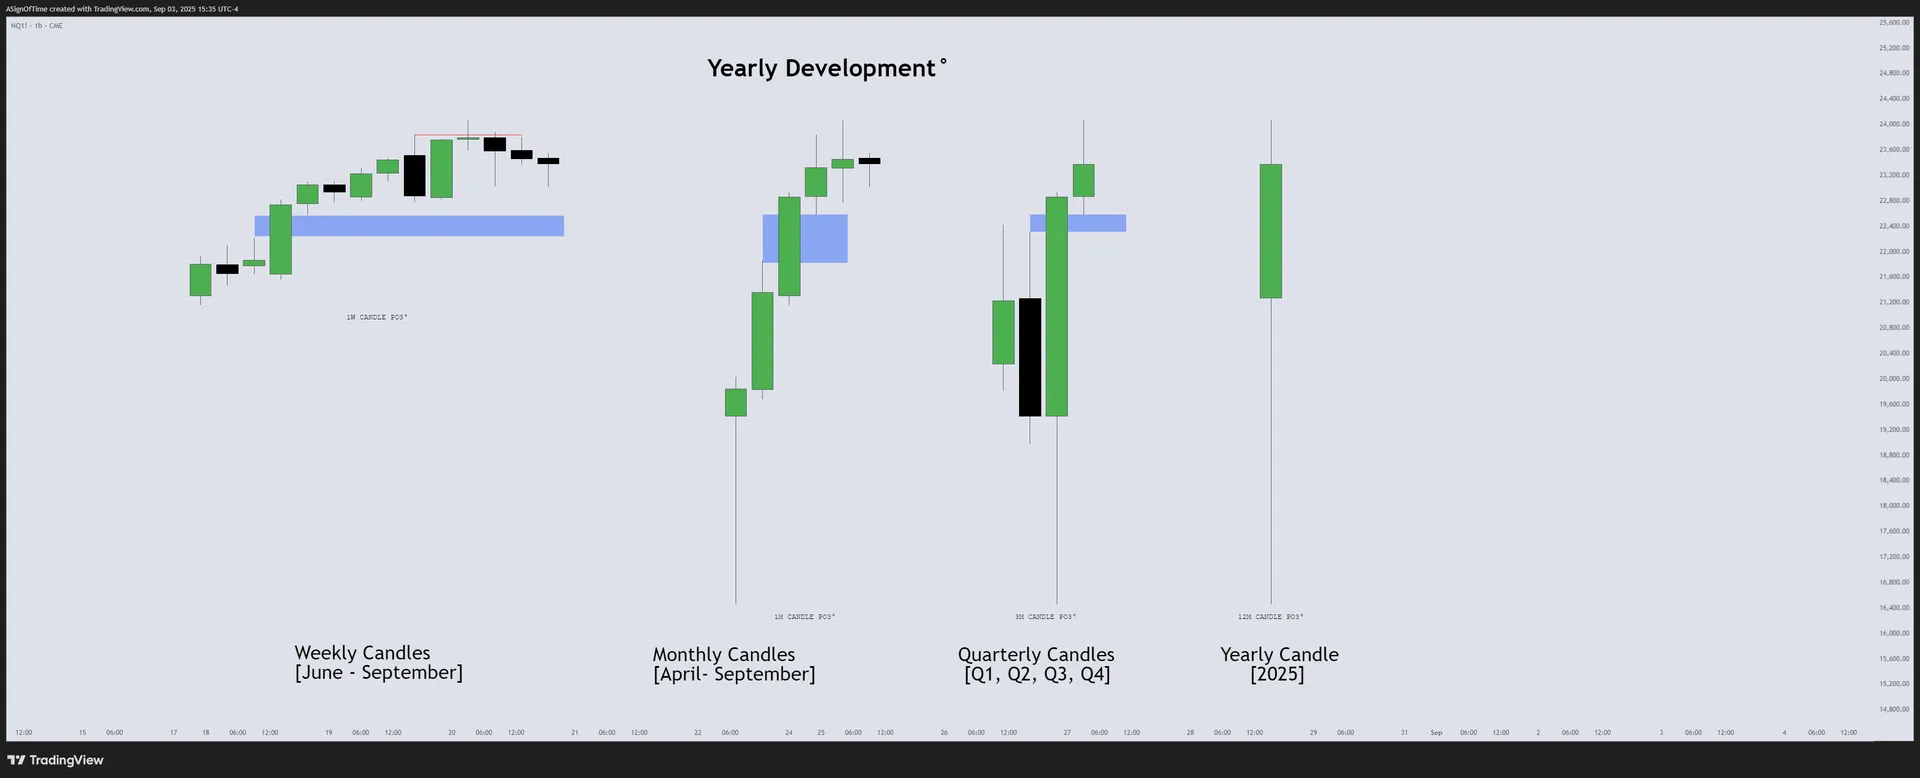
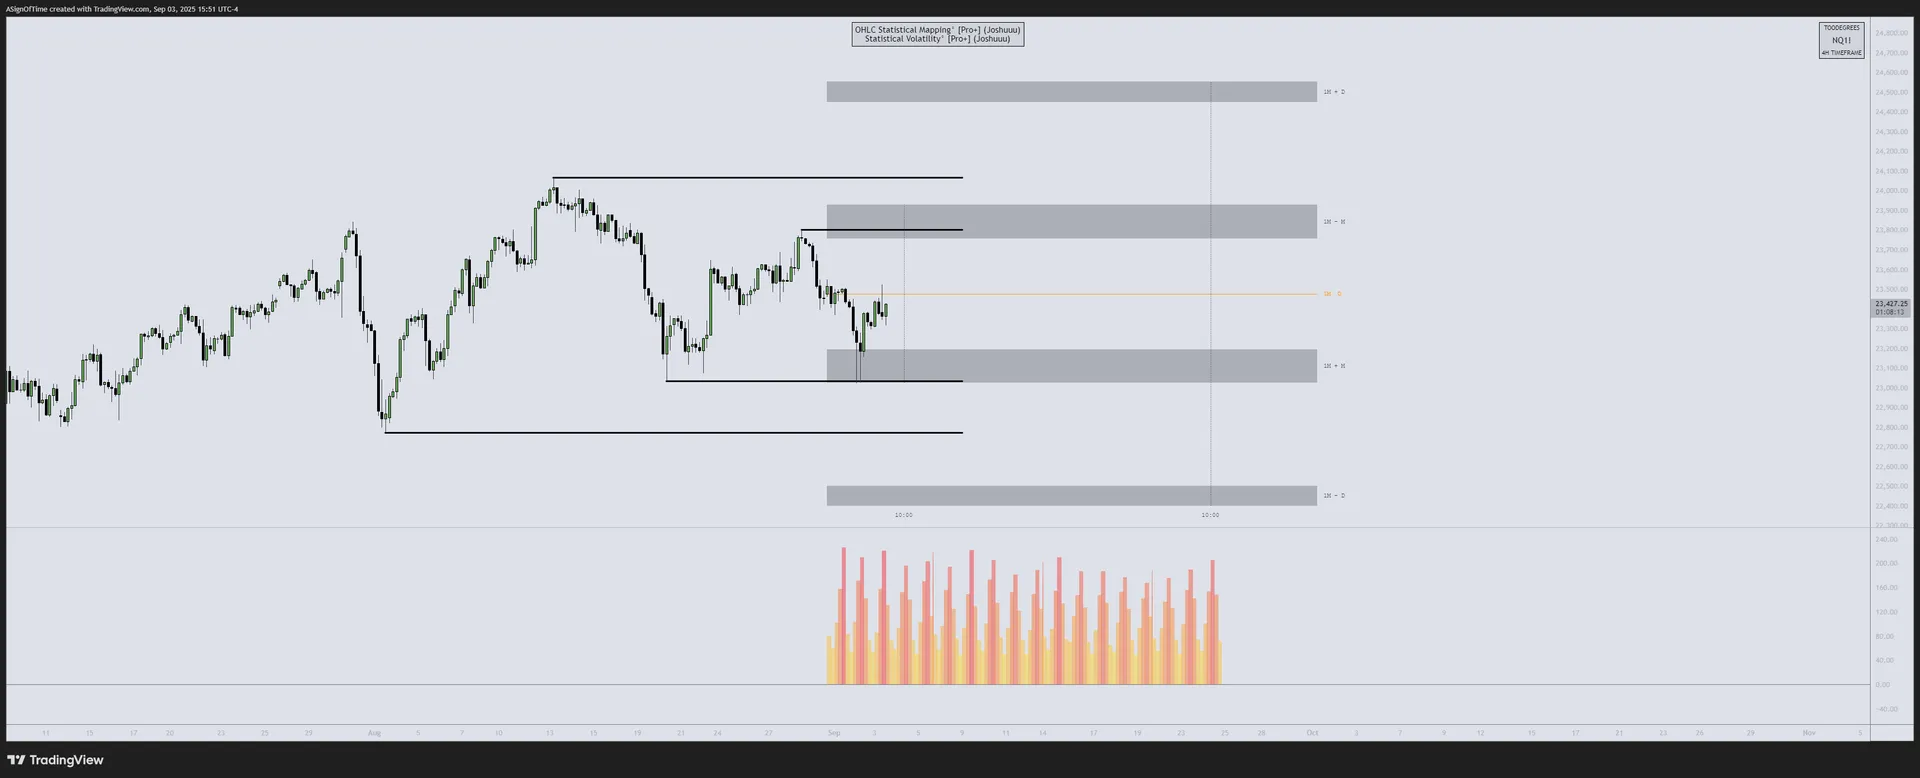
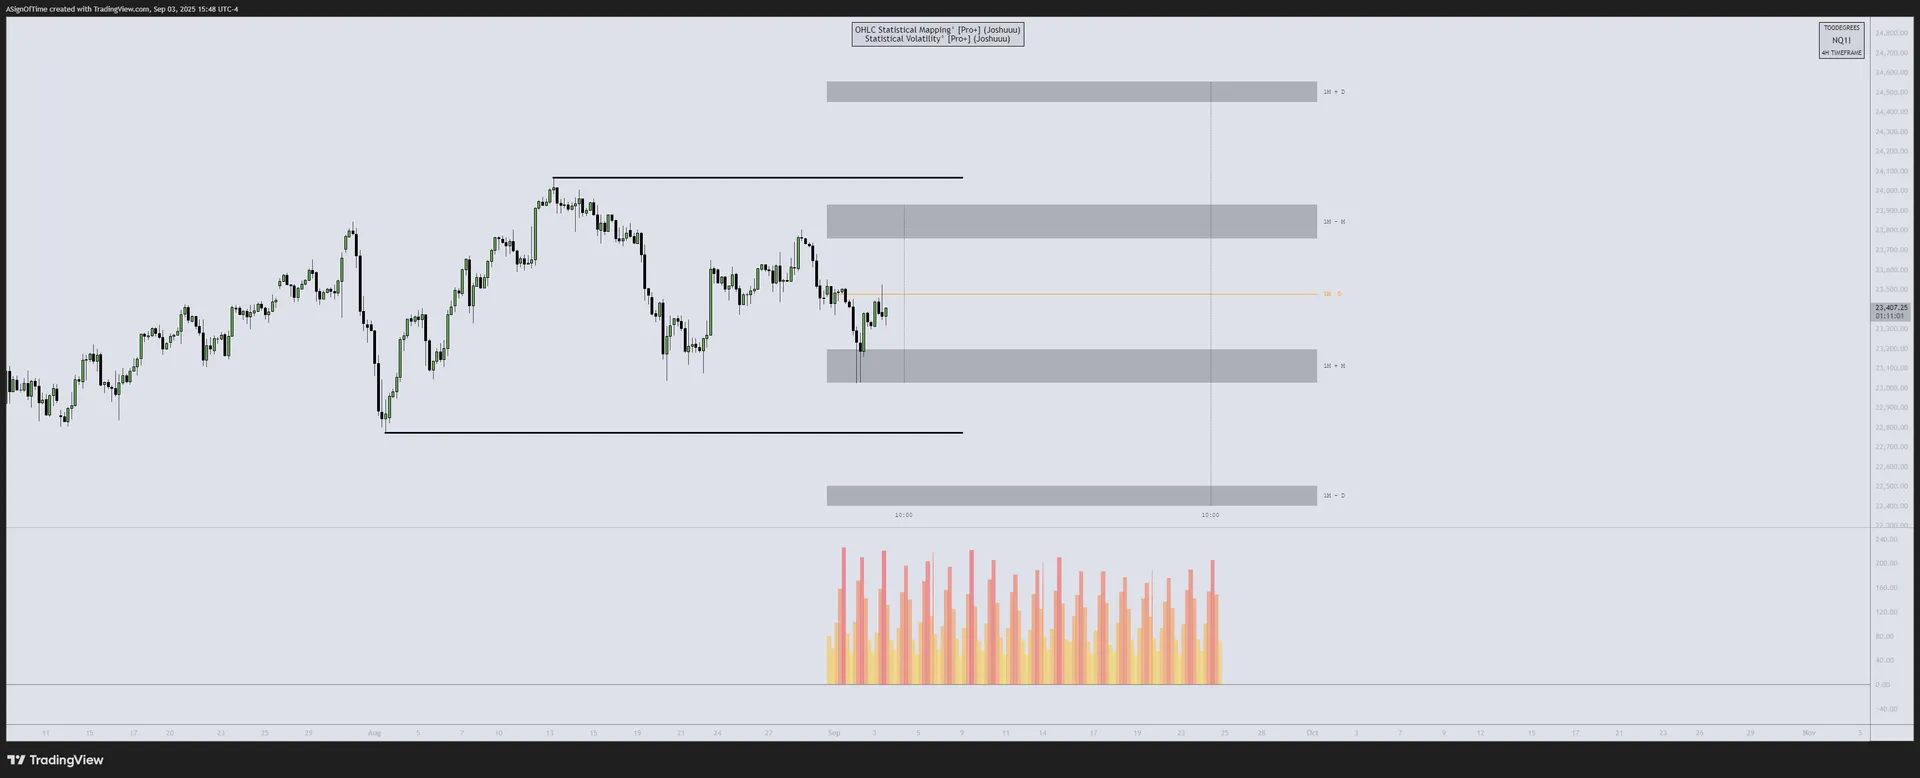
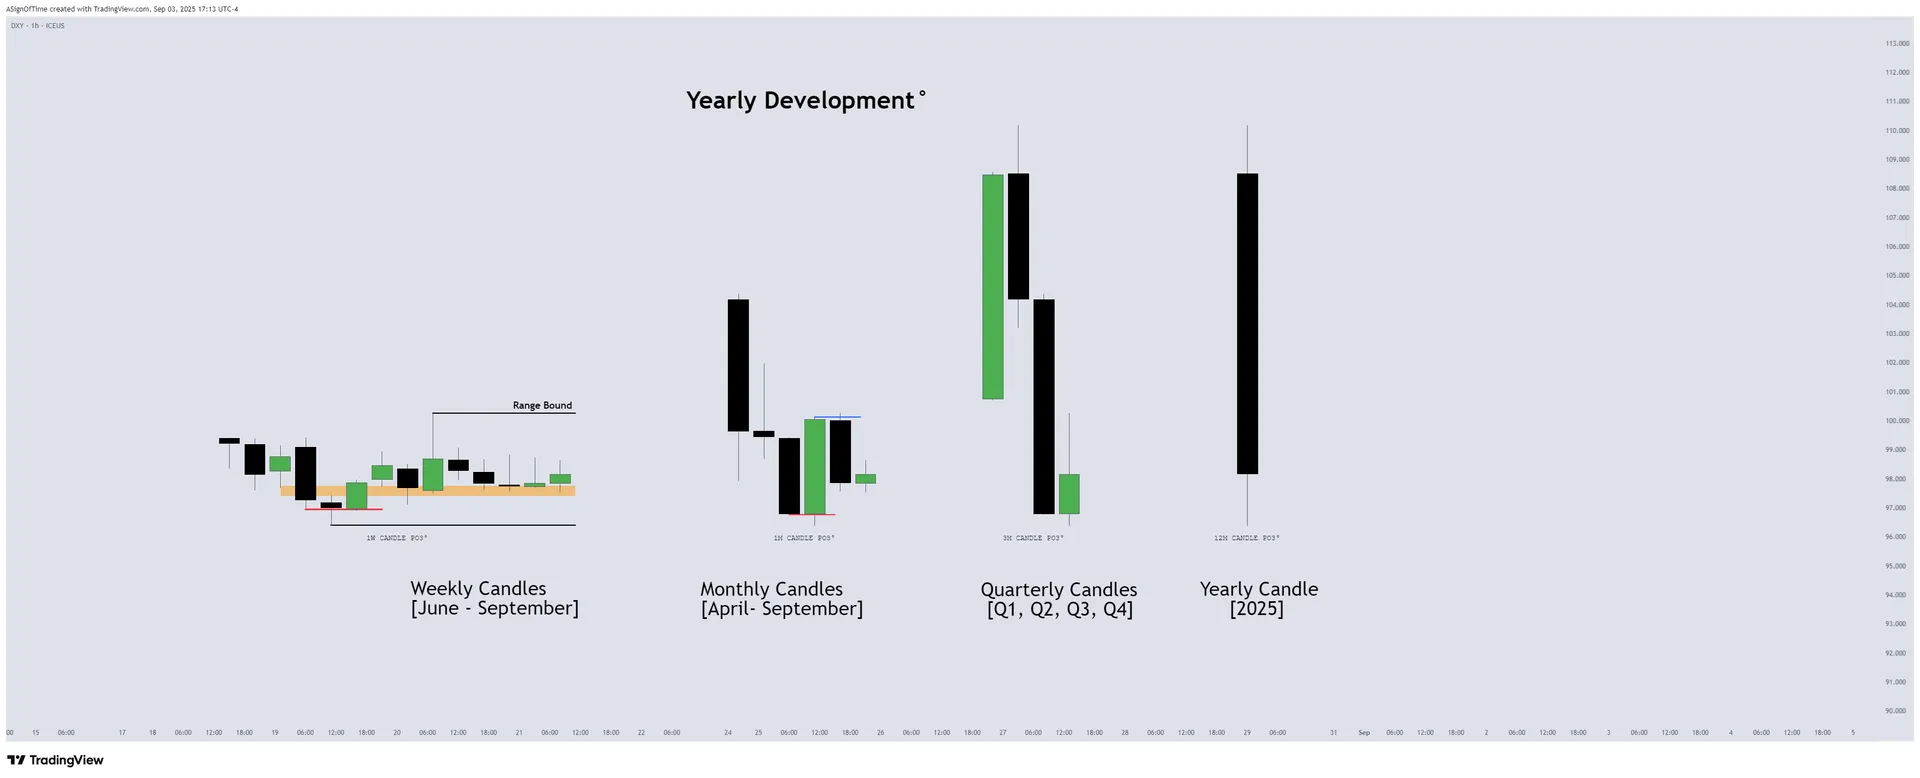
NQ Monthly Recap — HTF Power of Three Dashboard
After pushing to new all-time highs in July, NQ experienced a sharp reversal in early August, testing the monthly buy-side liquidity pool formed during the July advance. The index stabilized mid-month, reclaiming a portion of the selloff, but remains below prior highs. Historically, August volatility can set the tone for Q4 — whether this was a healthy pullback or the start of a deeper correction will depend on September's follow-through.
Multi-Asset IPDA — August 1st Anchored
IPDA Lookback anchored at the start of August, measuring Relative Strength across NQ, ES, and YM relative to the 60-day lookback period.
[E-MINI NASDAQ 100]
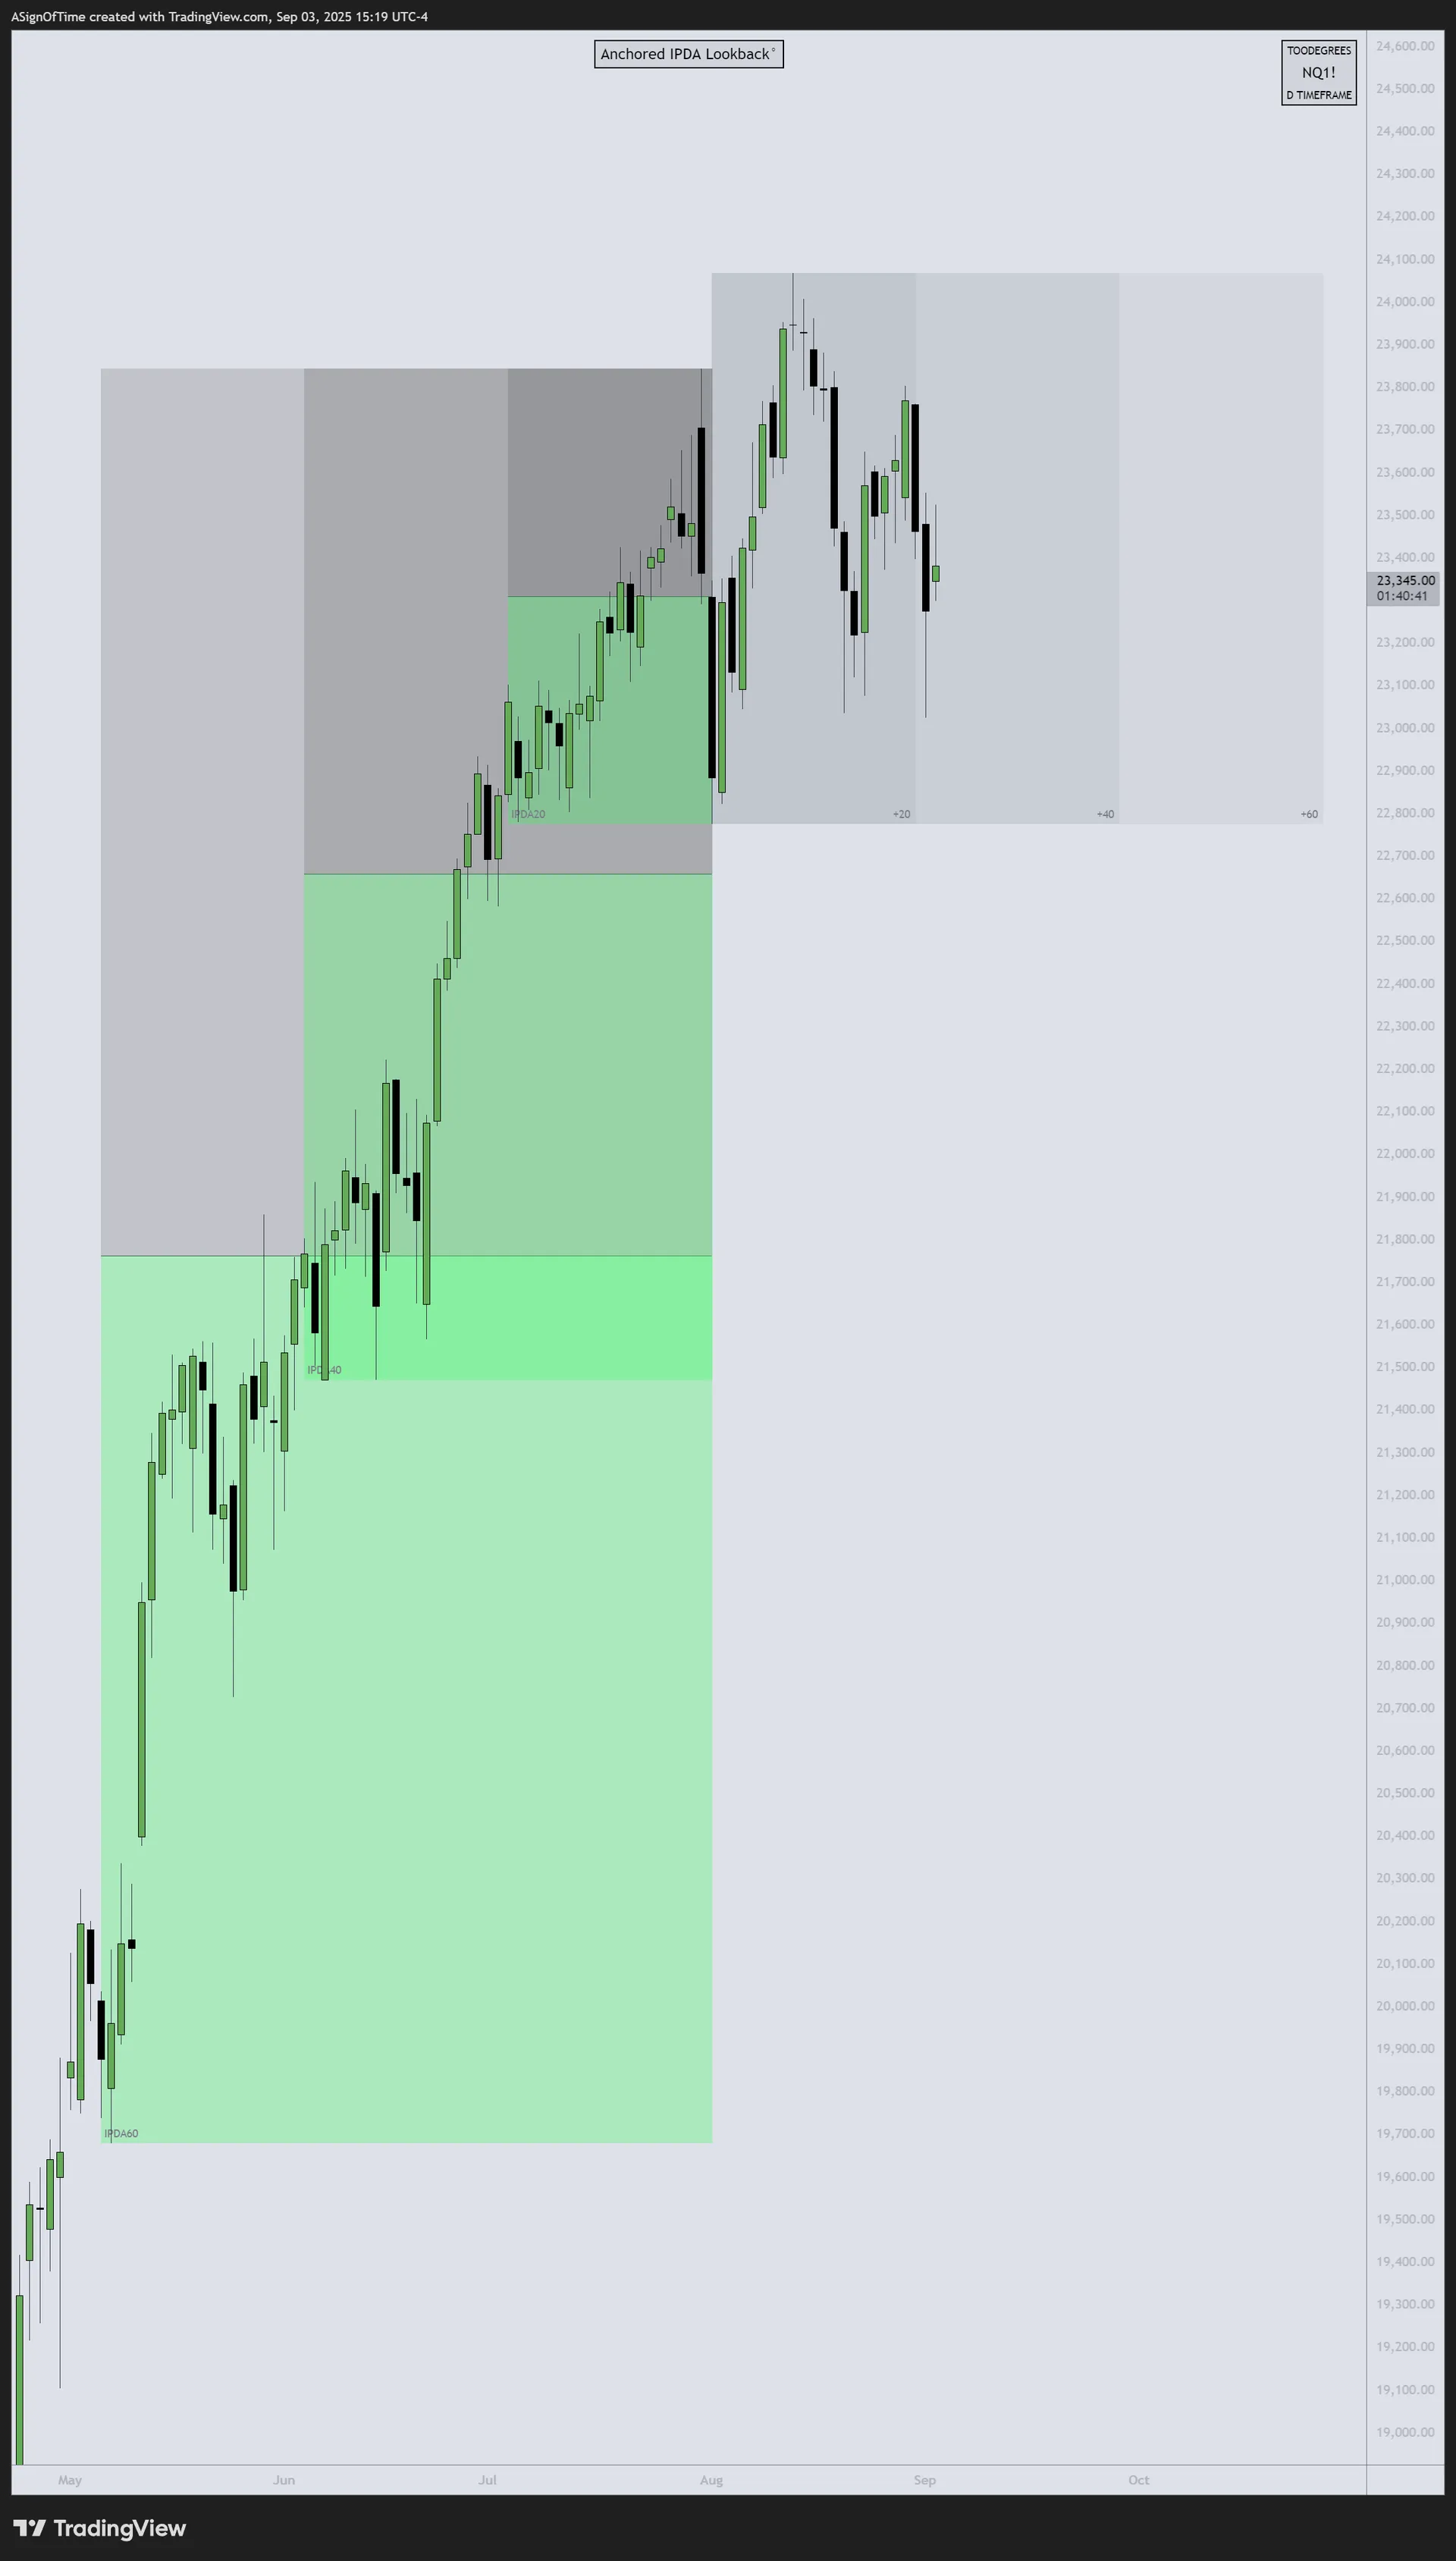
Volatility Returns
[E-MINI S&P 500]
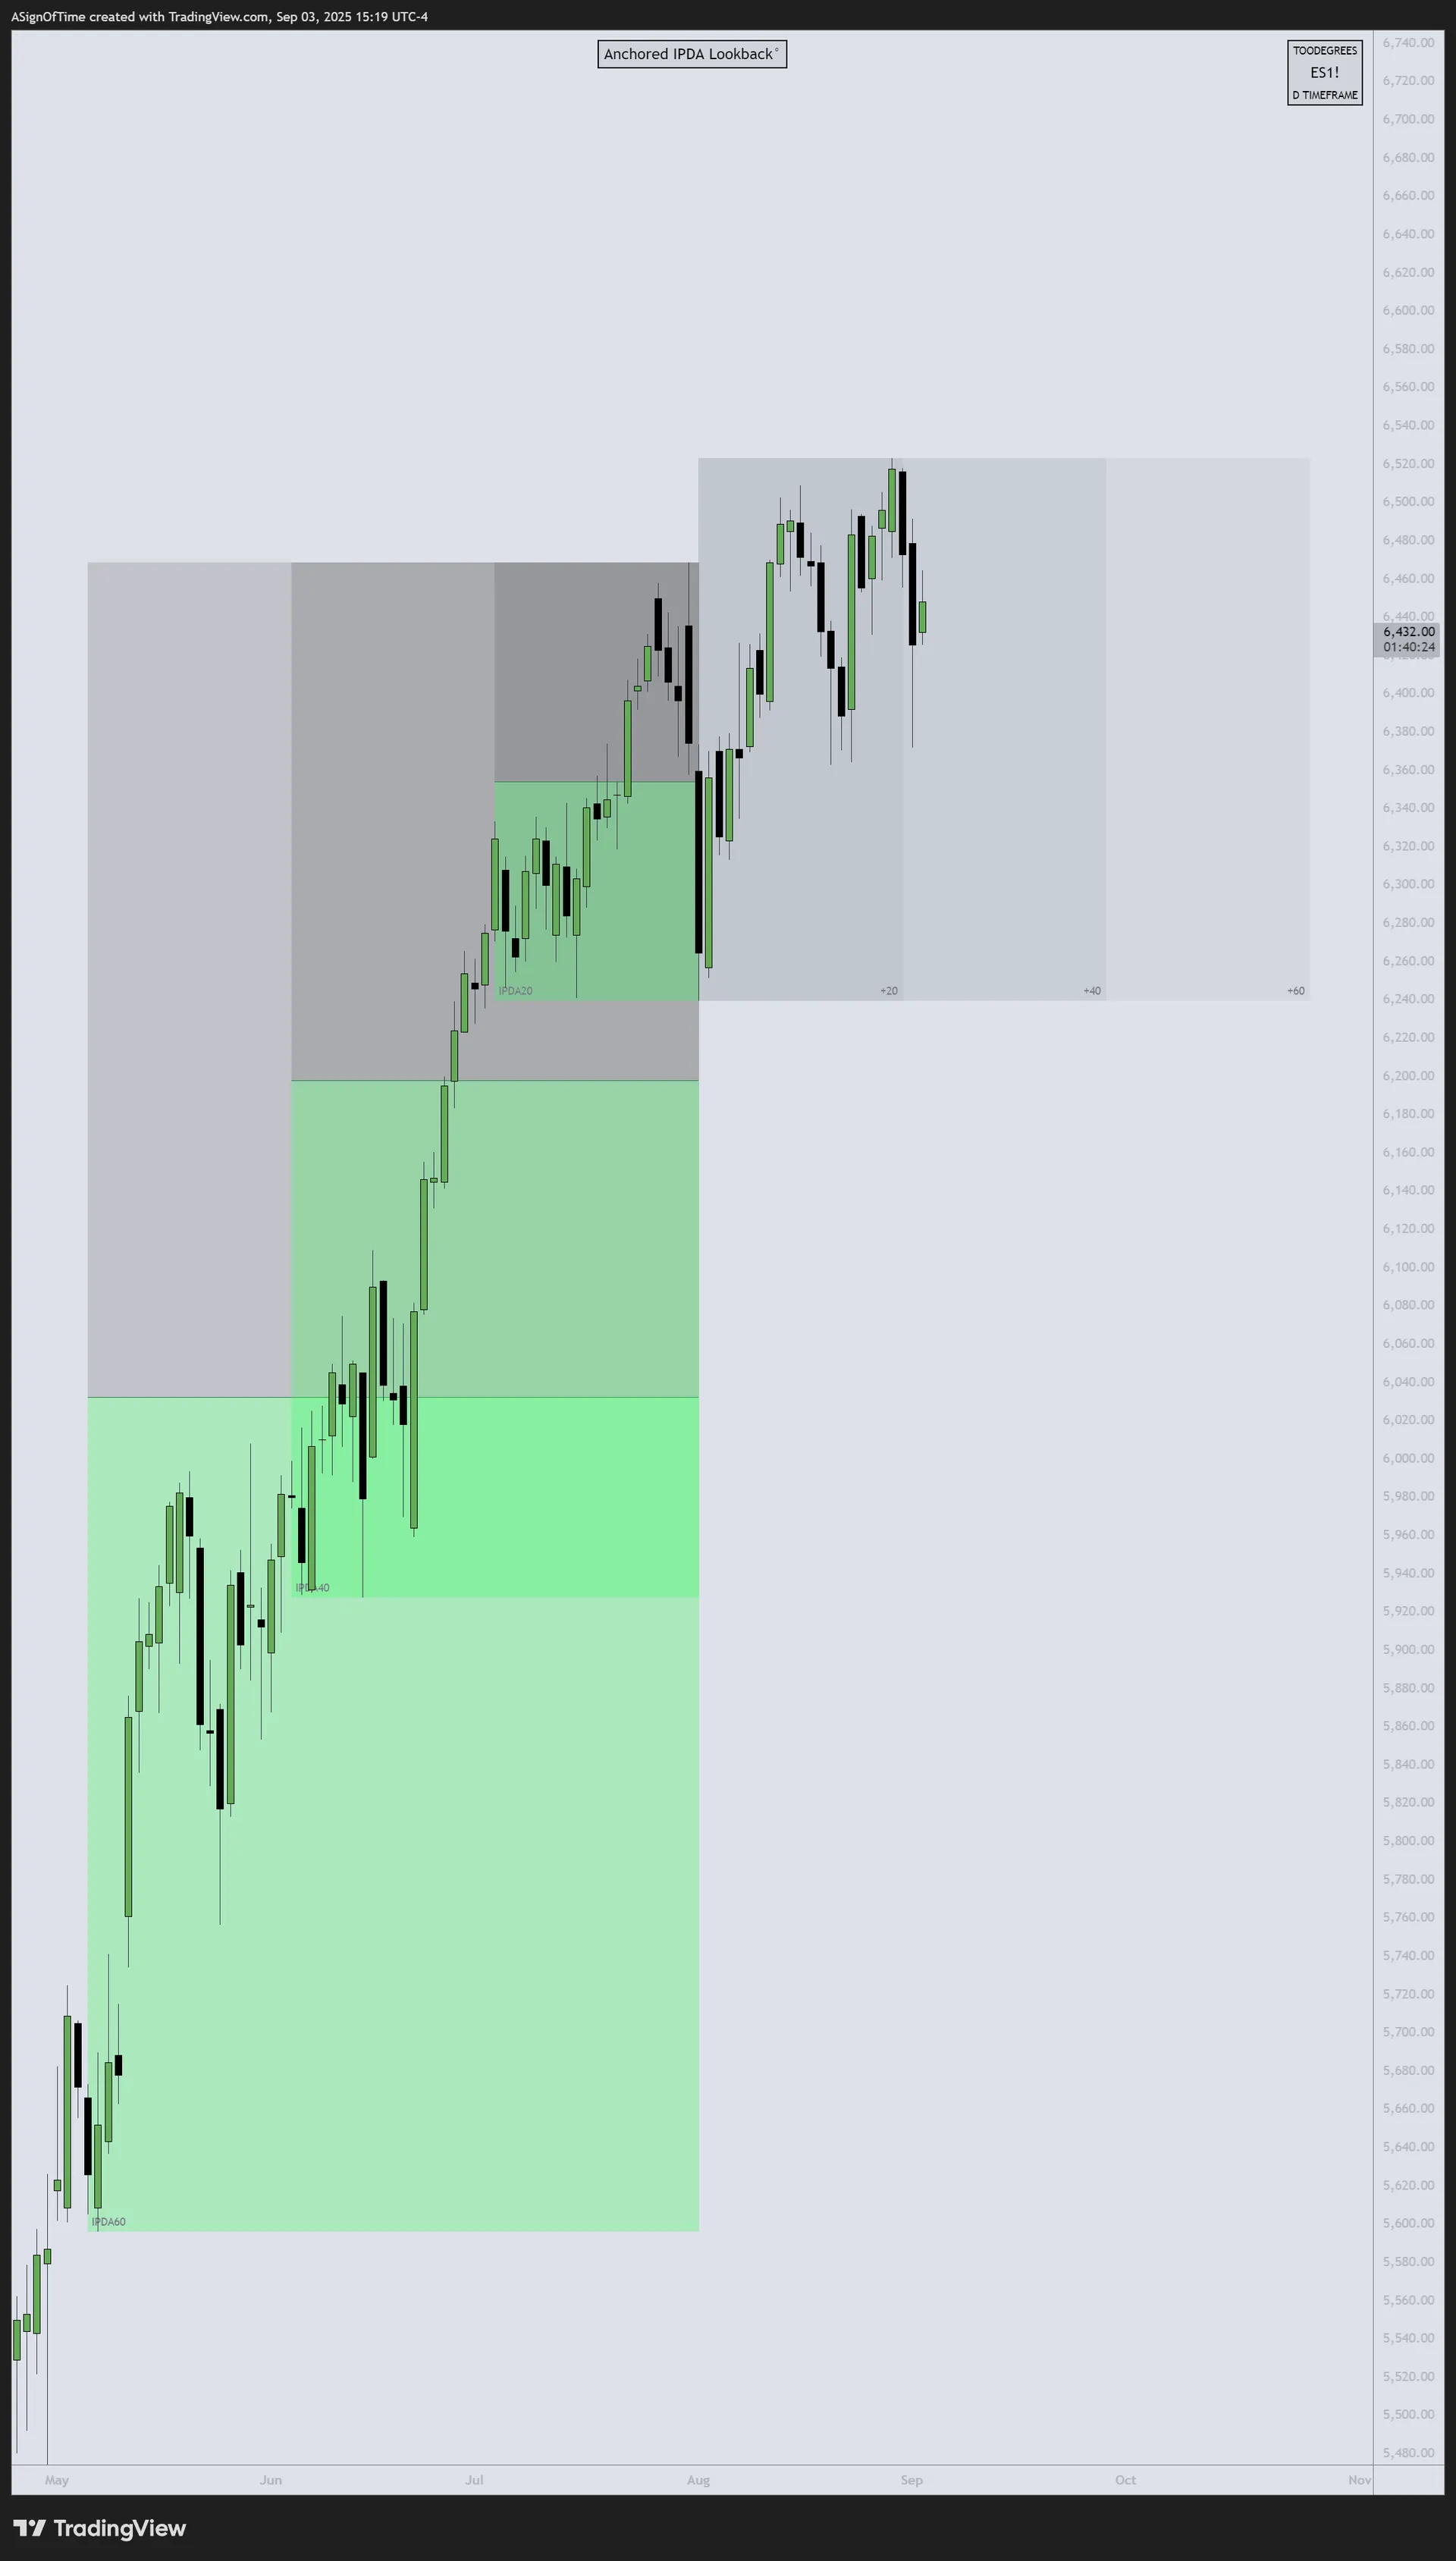
Broader Weakness
[E-MINI DOW JONES]
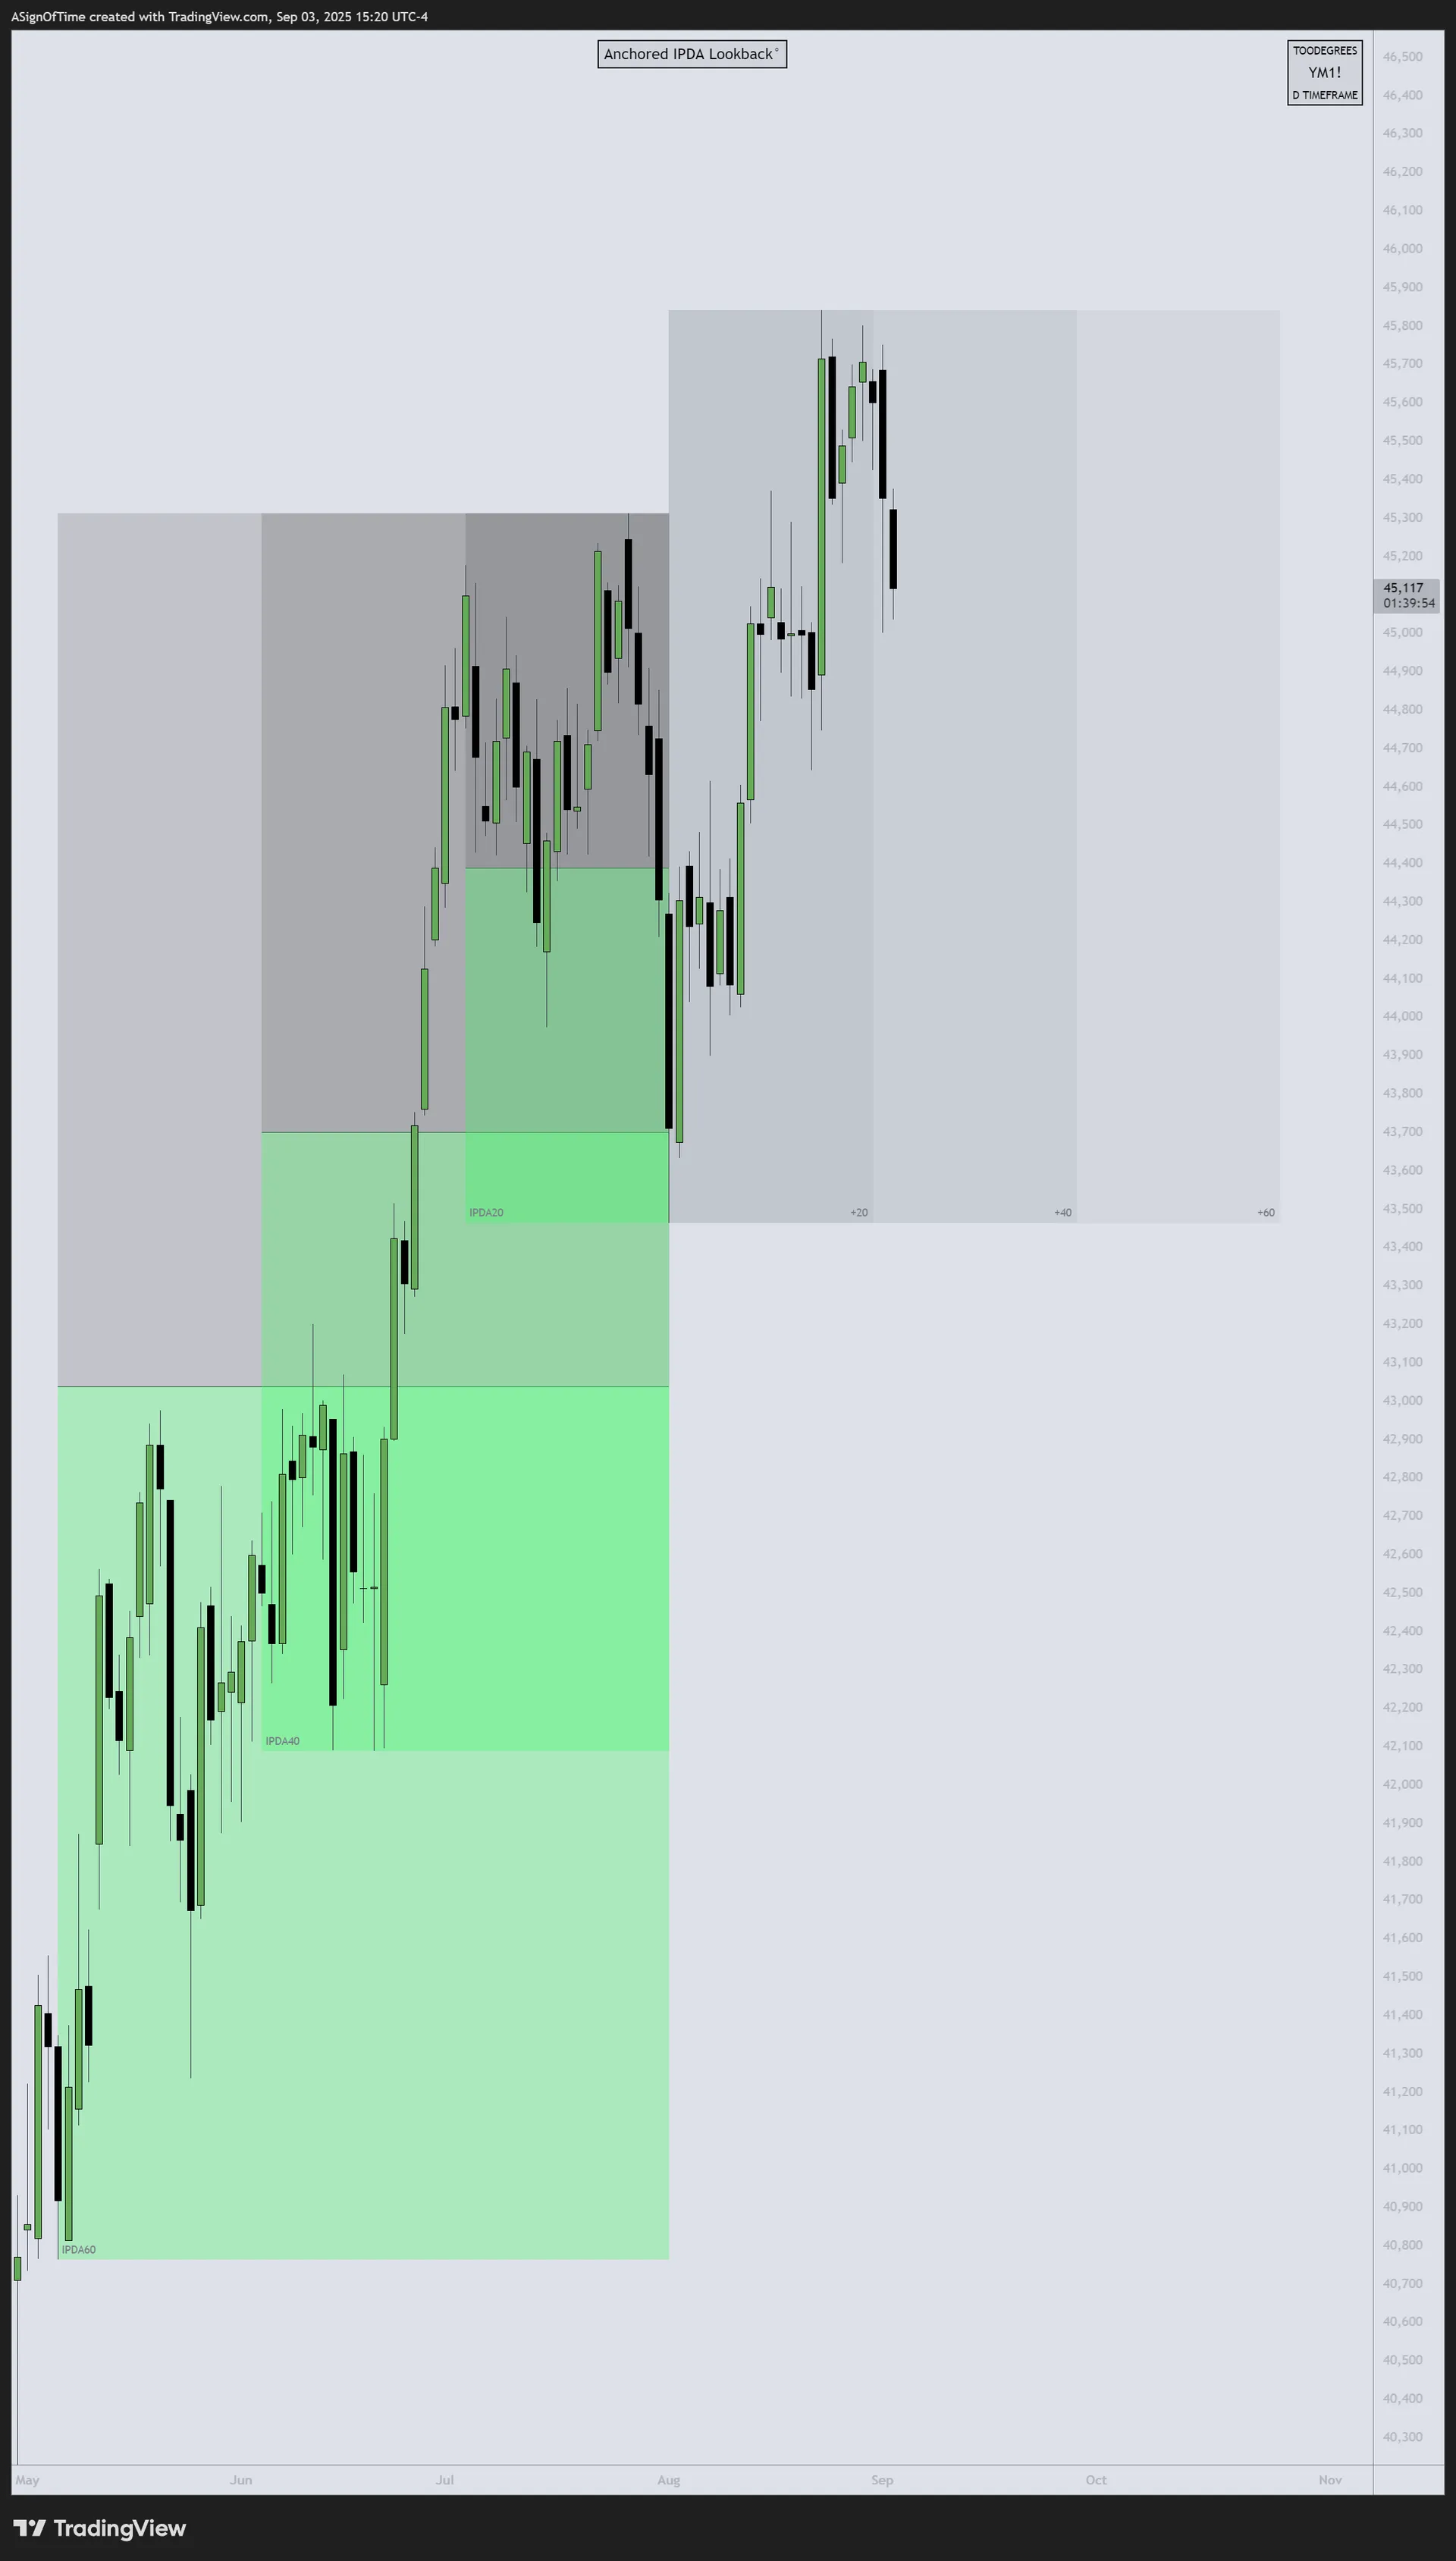
Underperformance Continues
Analyst Insight
All three indices showed weakness in August, with ES and YM underperforming NQ. The sharp intra-month decline broke below key IPDA 60-day ranges, triggering stop-loss cascades and algorithmic selling. NQ outperformed on a relative basis, but all three remain under pressure heading into September — a seasonally volatile month that could determine whether this was a healthy correction or the start of a deeper retracement.
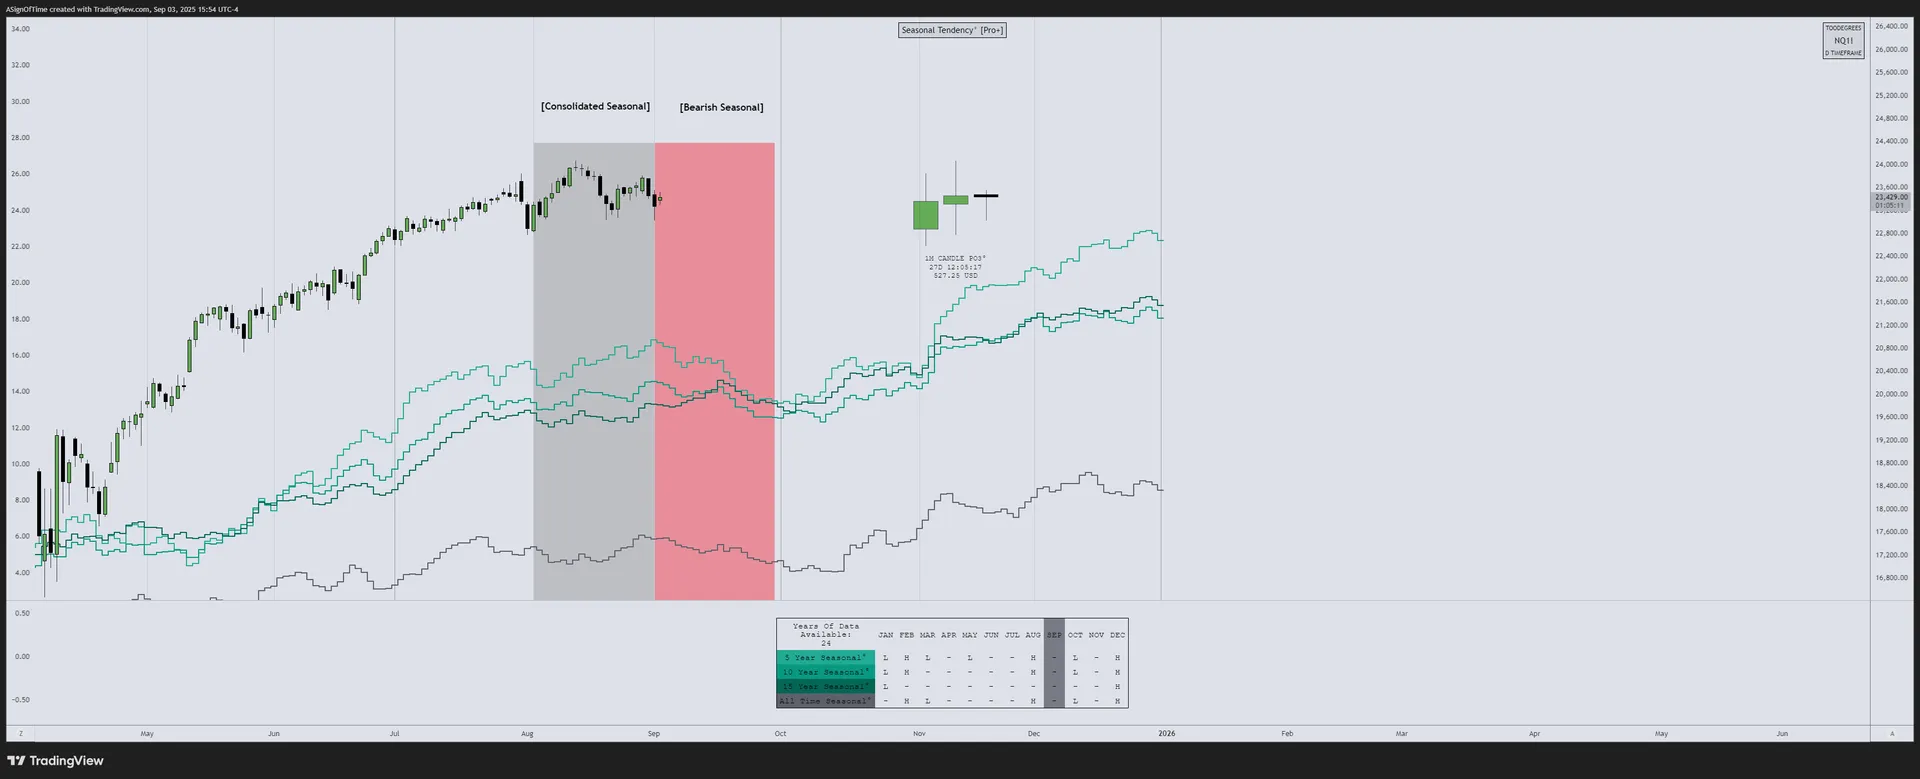
NQ Seasonality Analysis
Seasonal tendencies for the Nasdaq 100 E-Mini Futures. August historically marks a transition from summer complacency to autumn positioning — heightened volatility is common.
NQ Commitment of Traders
Commercials maintained a neutral stance through August's volatility, neither aggressively adding nor reducing exposure. This suggests institutional players viewed the selloff as temporary rather than the start of a major trend shift.
NQ Open Interest
Open Interest (OI) stabilized after the July decline, suggesting roll activity rather than broad speculative exits. The August volatility did not trigger significant OI collapses — a sign that positioning remained measured.
Section 3
Inter-Market Dynamics — Currency & Bond Markets
August Results — Currency Markets
In August, the U.S. Dollar Index (DXY) climbed approximately +1.8%, extending July's rebound as safe-haven flows returned amid equity volatility. EUR/USD fell roughly –1.6%, pressured by weaker Euro-area PMI data and a widening growth differential. GBP/USD dropped –1.4%, with UK data also disappointing and broad dollar strength prevailing.
DXY Monthly Recap
DXY — IPDA Analysis
DXY extended above its August-anchored IPDA range, building on July's reversal. The move was driven by safe-haven flows and short-covering rather than broad speculative demand — COT data shows limited new long positioning despite price strength.
Inter-Market Dynamics Summary
| Metric | NQ | DXY | T-Bonds |
|---|---|---|---|
| Orderflow | Bullish → Bearish | Bullish → Bullish | Sideways → Bullish |
| Seasonality | Neutral → Bearish | Sideways → Bullish | Sideways → Bullish |
| Open Interest | Declining → Stable | Declining → Building | Mixed → Bullish |
| COT Report | Commercial Reducing → Neutral | Net Long Building → Strong Long | Mixed → Bullish |
| Interest Rate | — | 4.25%–4.5% | — |
Format: Previous Report → Current Report
Section 4
Additional Resources
Free TradingView Tools
Interest Rate & GDP Dashboard
by toodegrees — Free on TradingView
ICT Anchored IPDA Ranges
by toodegrees — Free on TradingView
ICT Commitment of Traders
by toodegrees — Free on TradingView
Seasonal Open Interest
by toodegrees — Free on TradingView
Community Resources
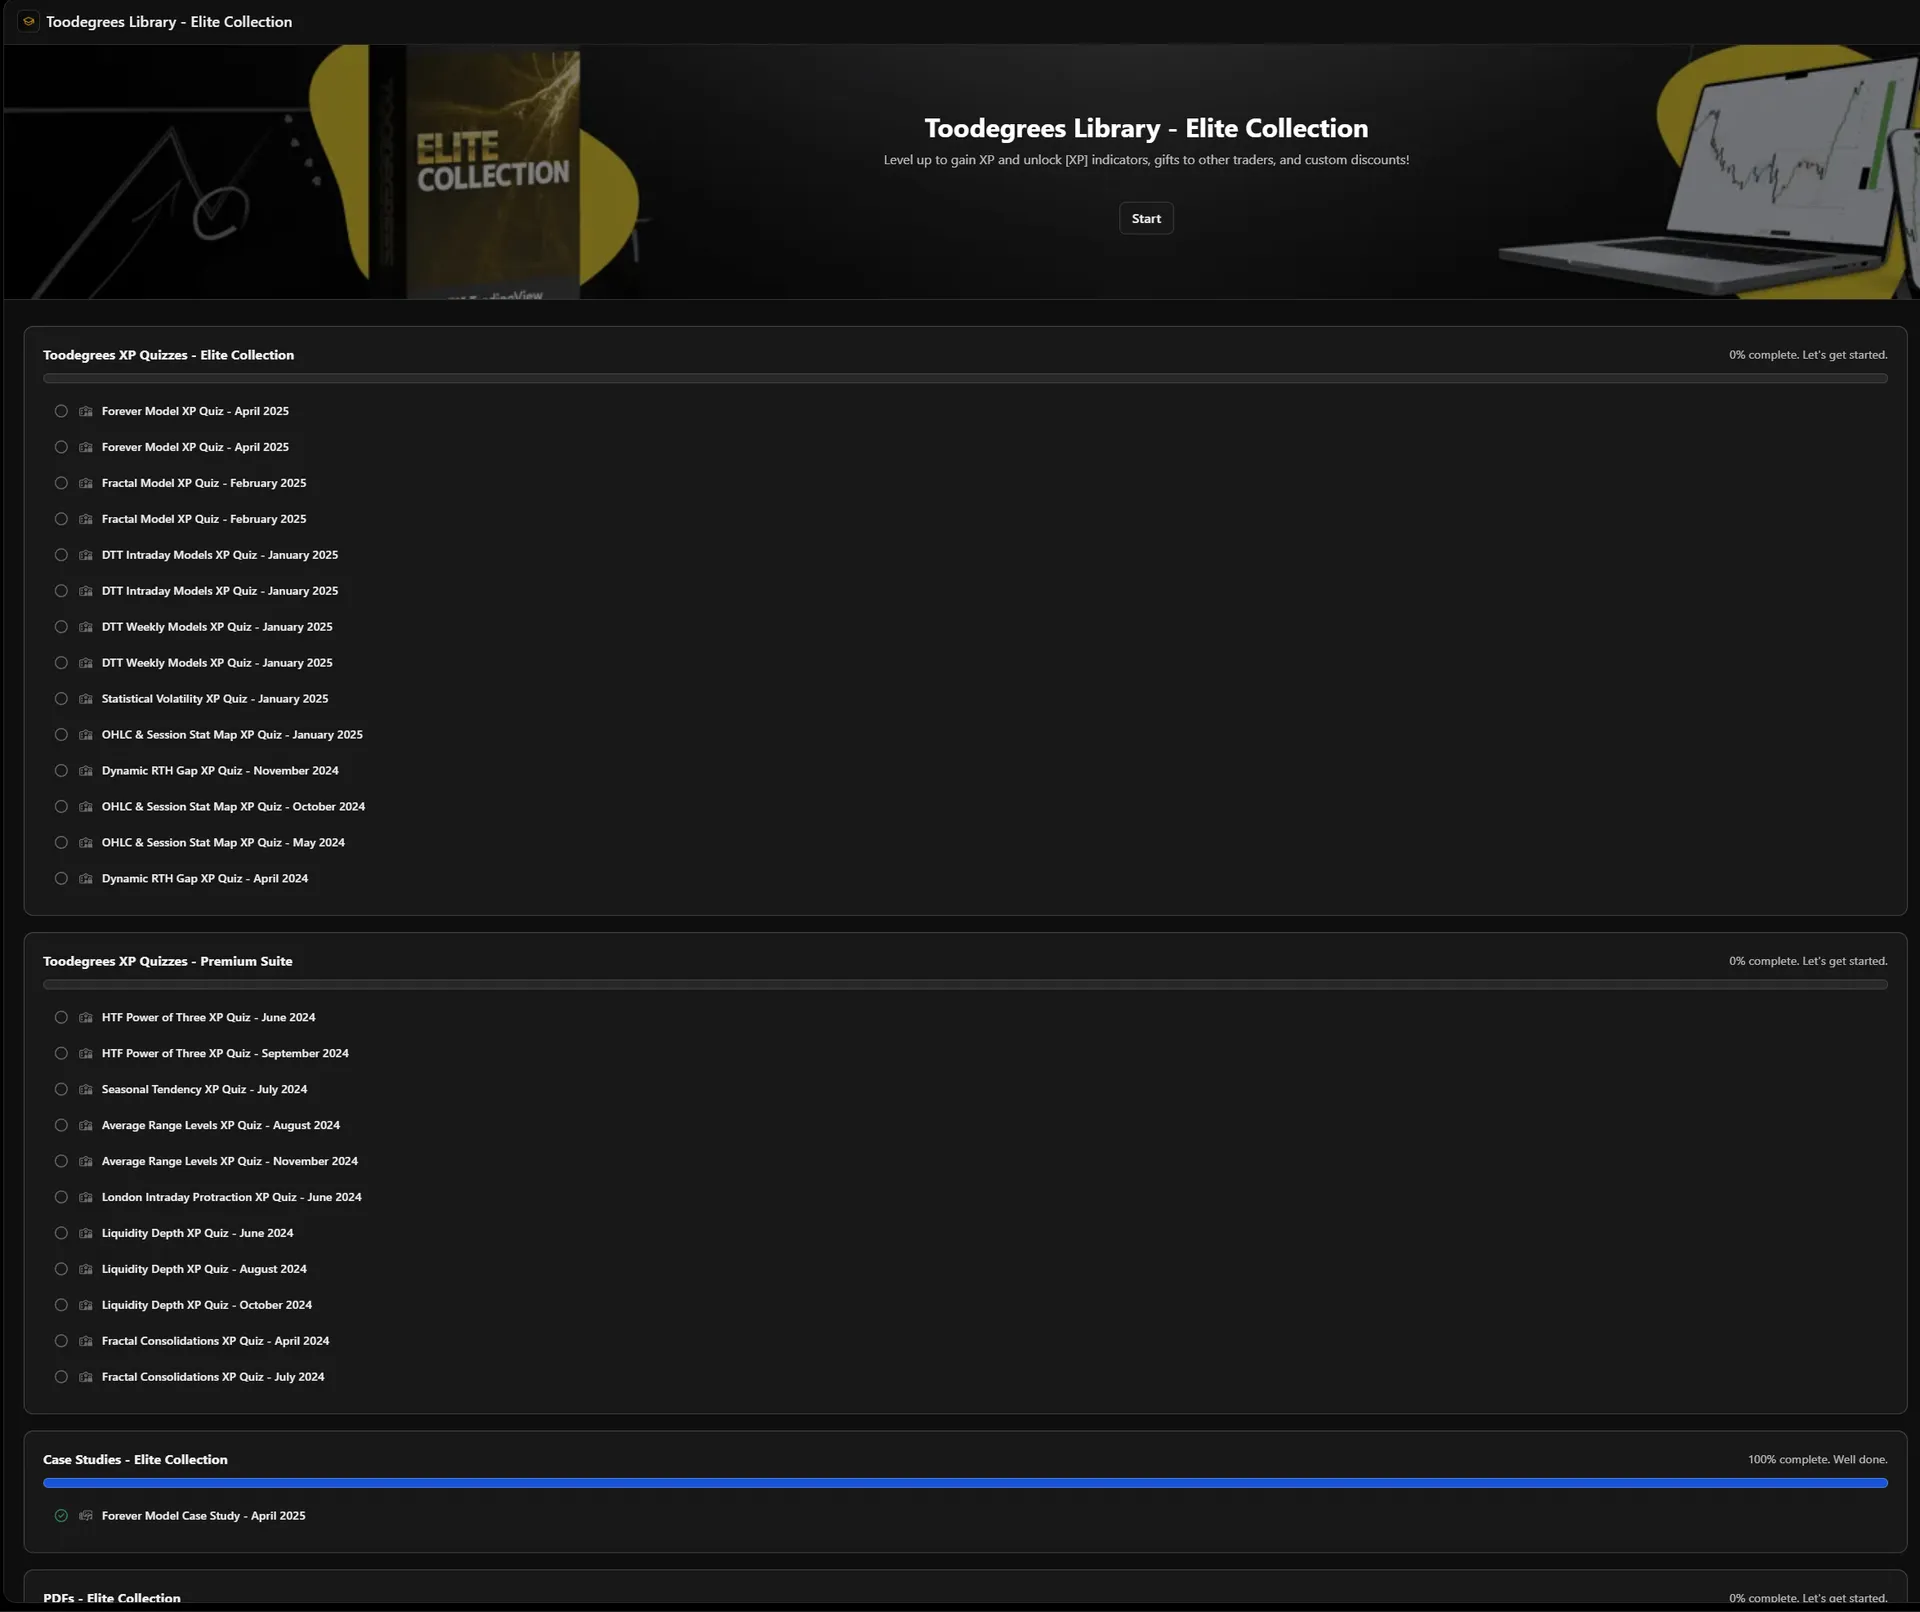
Toodegrees Library
Access all EOM Reports & premium content
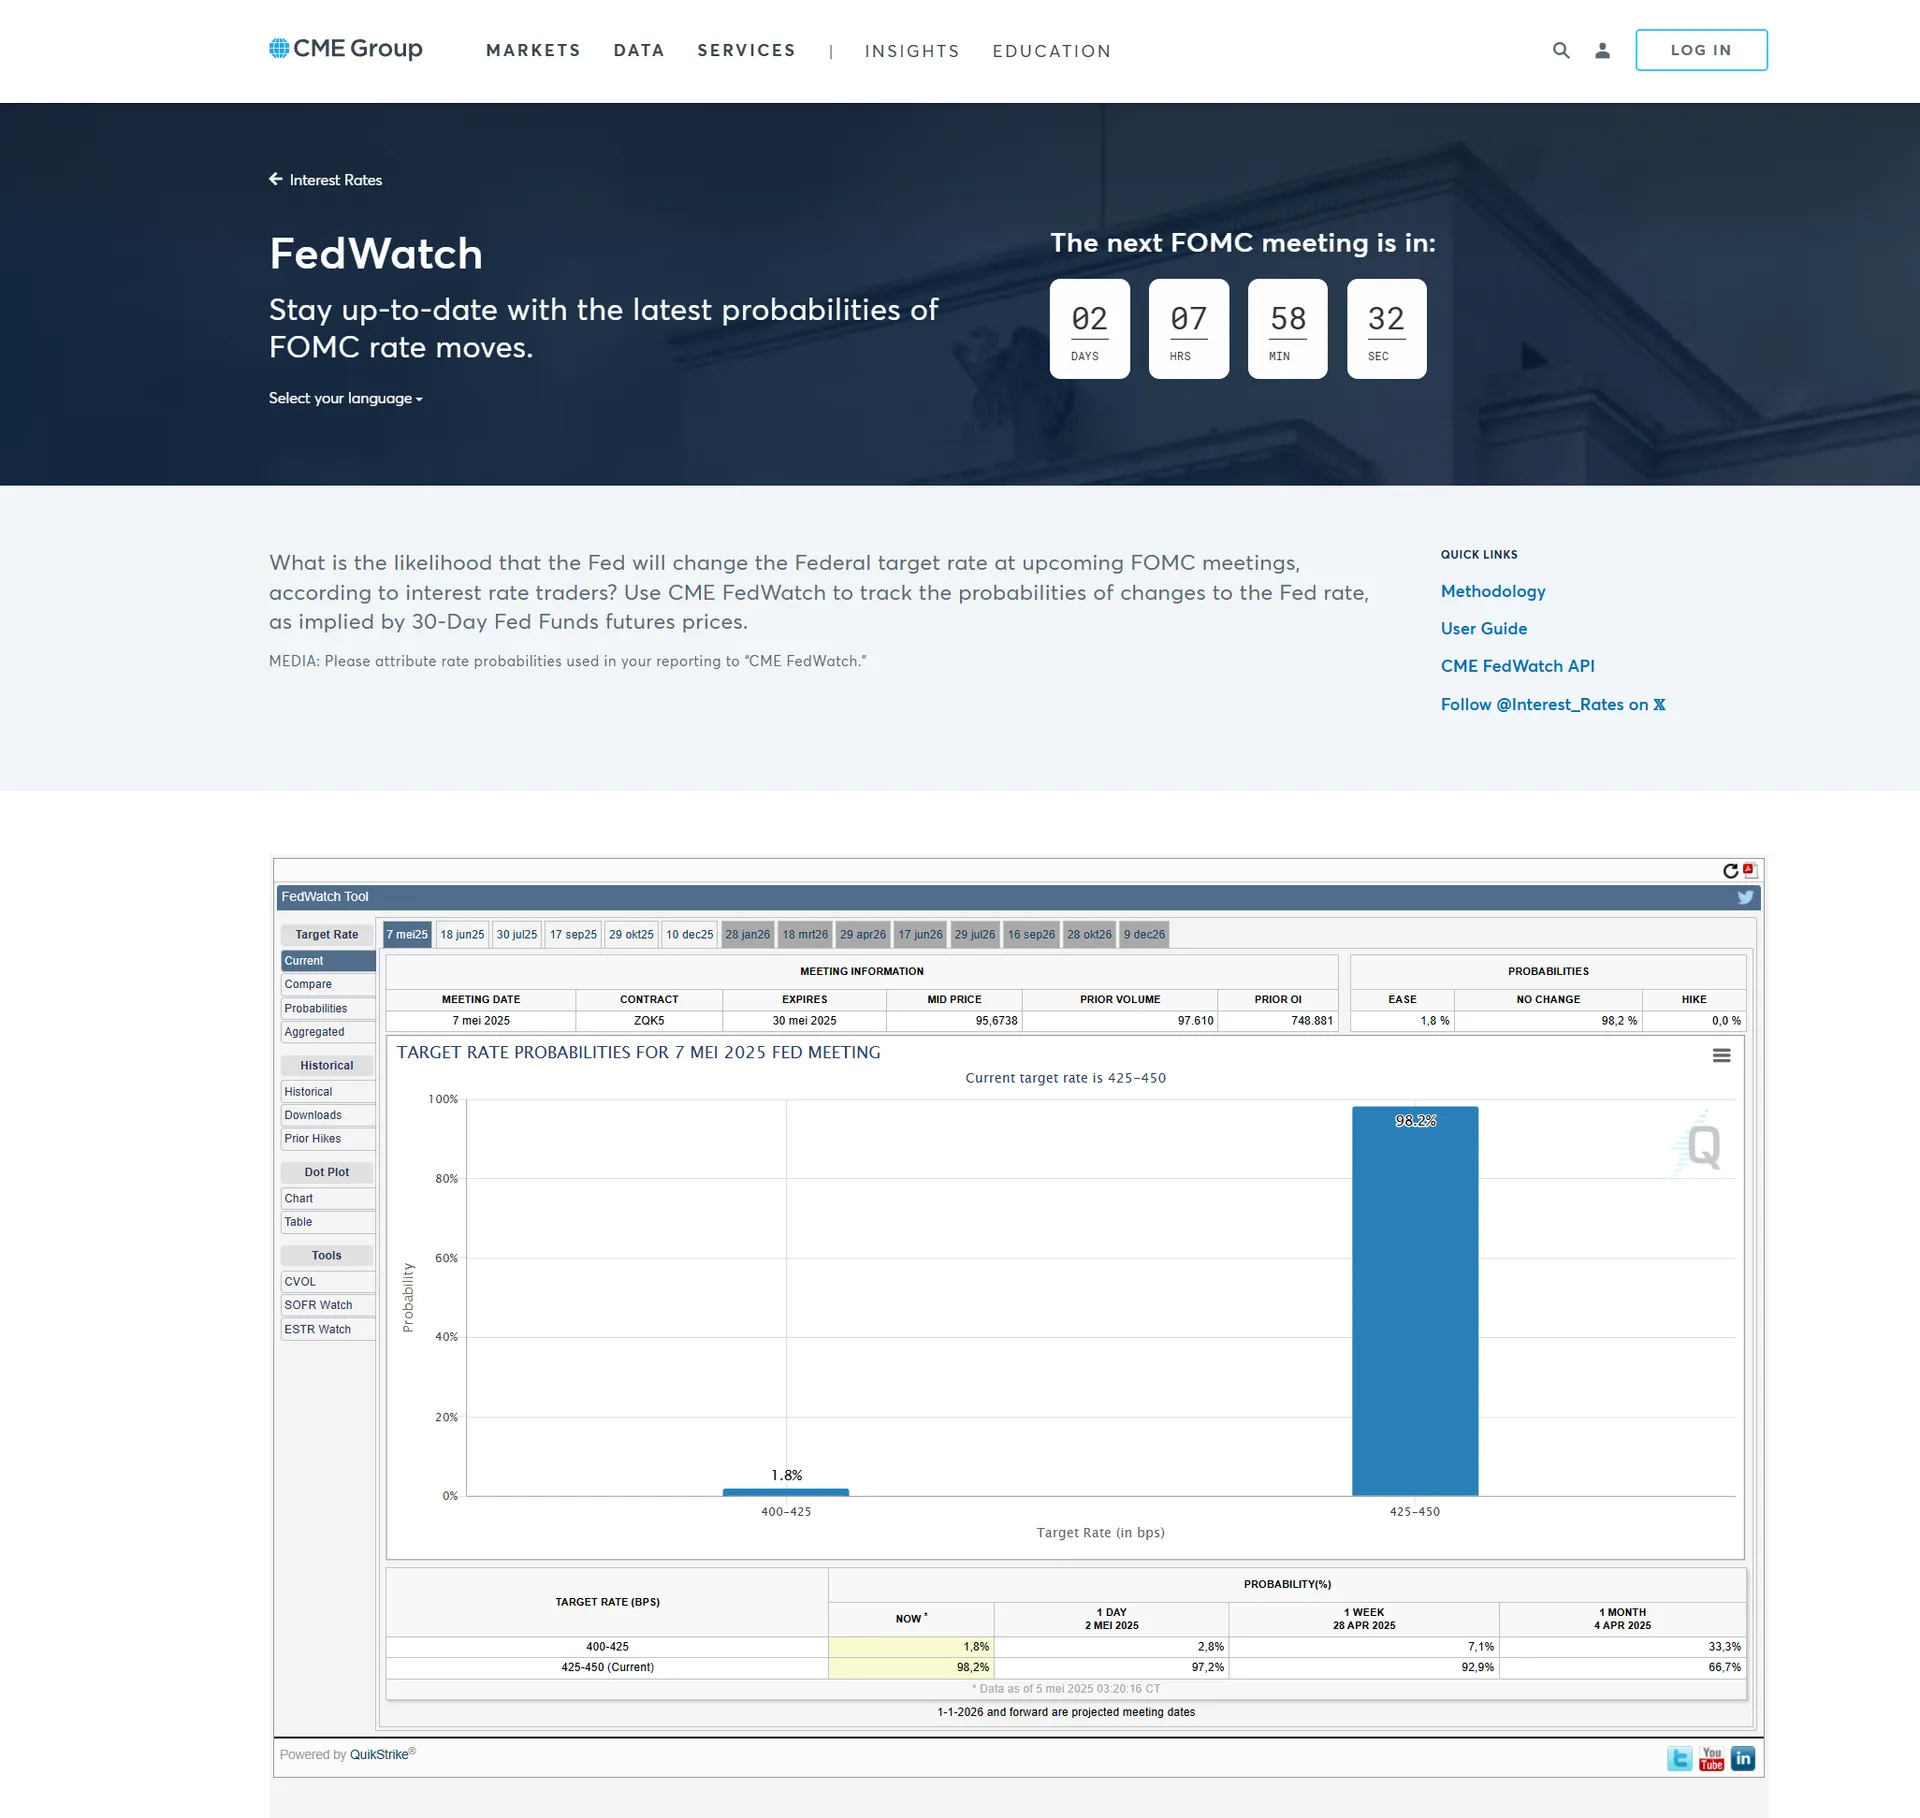
CME FedWatch Tool
Track Federal Reserve rate probability

August EOM Livestream
Full August analysis walkthrough on YouTube
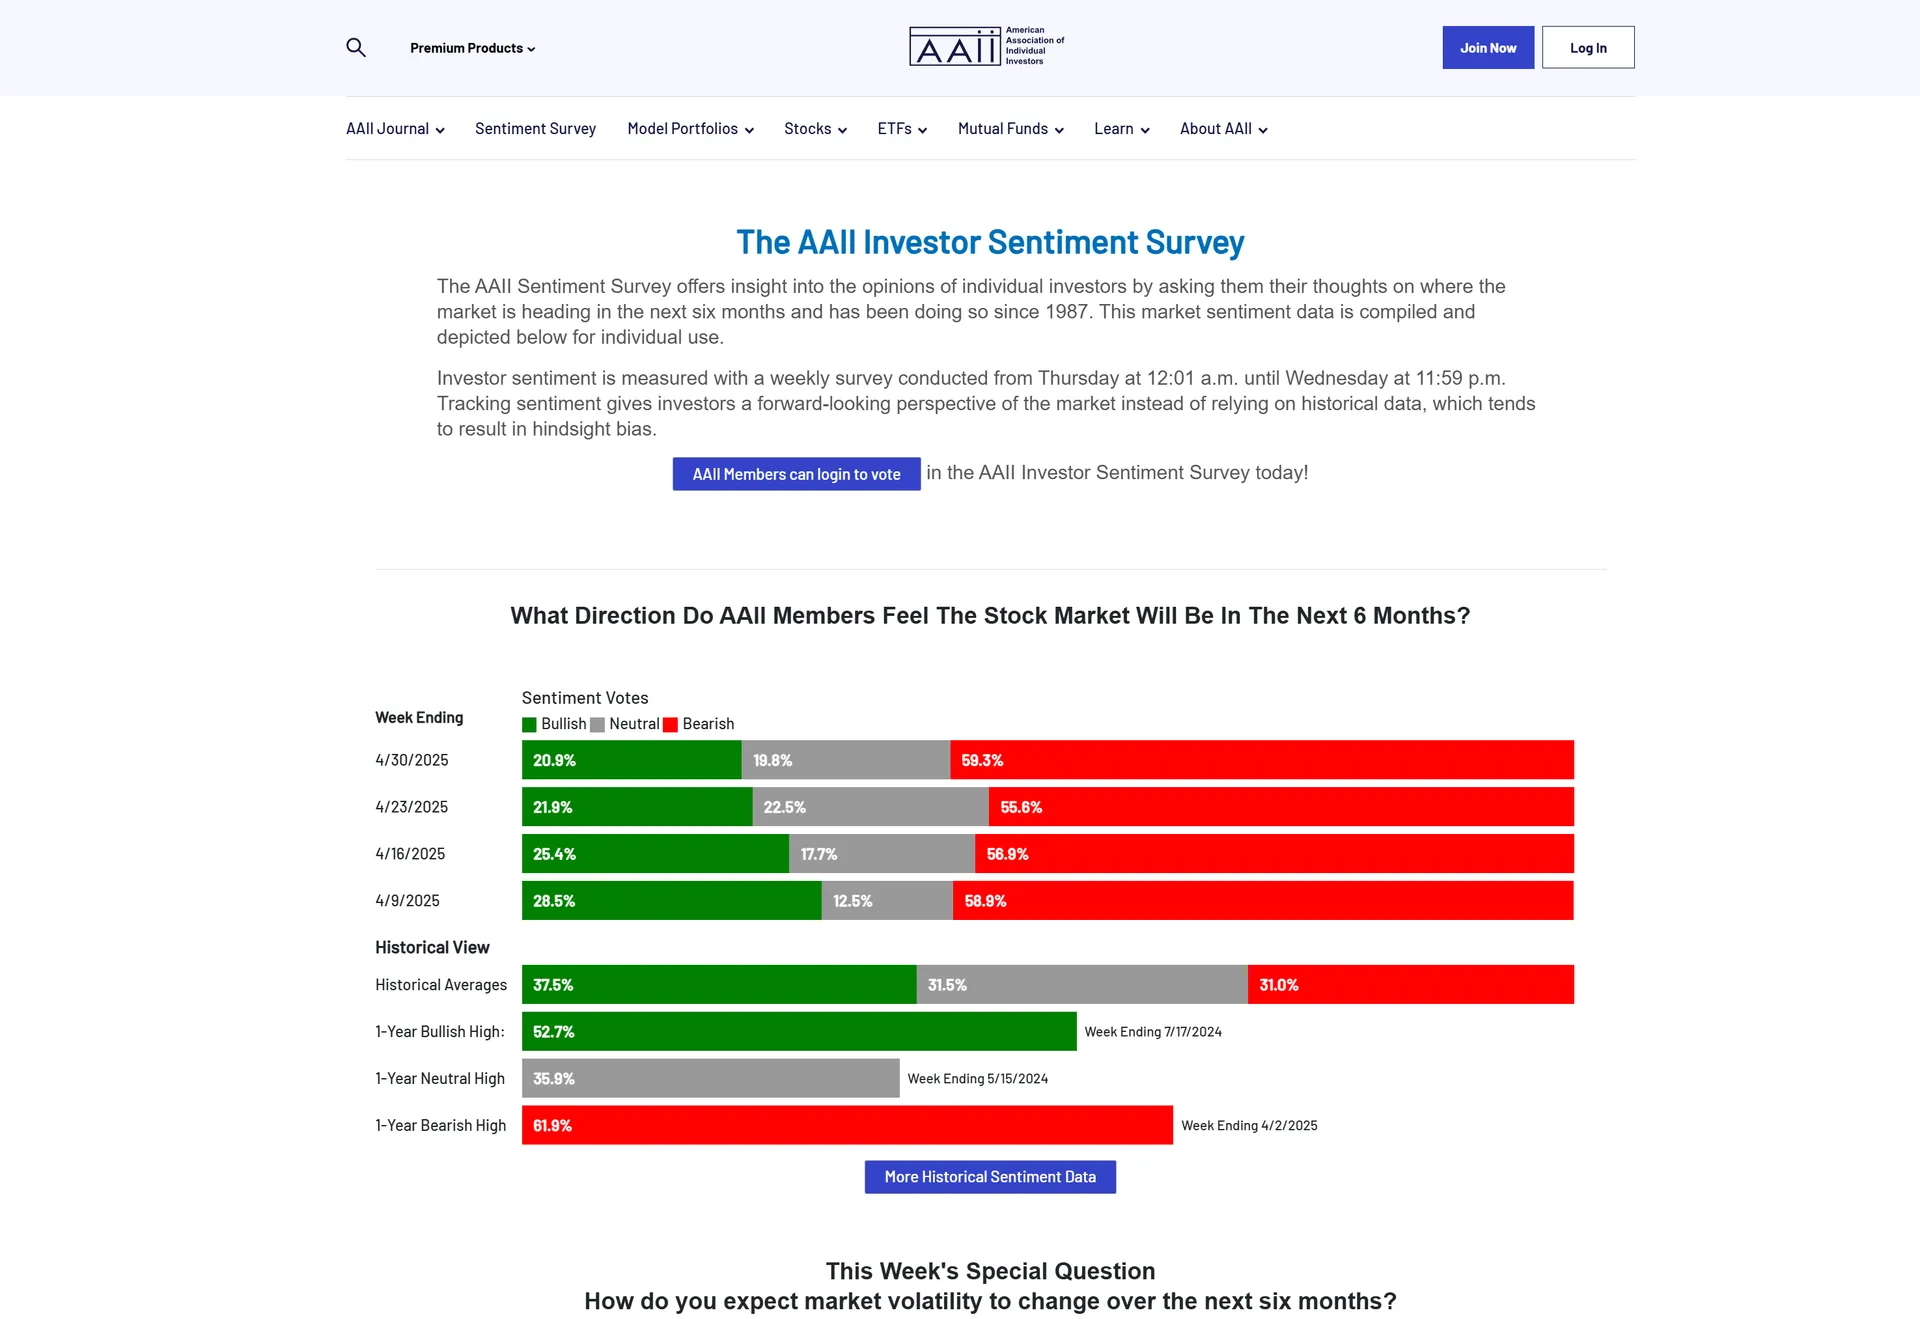
AAII Investor Sentiment Survey
Historical sentiment data & video breakdown
Follow Toodegrees
Section 5
Conclusion — Analysis Recap
August brought a stark reminder that complacency can unwind quickly. NQ, ES, and YM all declined, with the early-month VIX spike above 40 signaling a return of volatility after months of relatively calm price action. While indices recovered roughly half of the initial decline by month-end, uncertainty remains elevated heading into September — historically one of the most volatile months for equities.
In FX, DXY extended its rebound as safe-haven flows returned, while EUR/USD and GBP/USD weakened on deteriorating economic data. Treasury futures rallied as growth concerns resurfaced. COT data shows commercials building DXY longs and bond exposure — suggesting institutional positioning for a more cautious macro environment. Overall, August marked a transition from complacency to caution, setting the stage for a potentially volatile September and Q4.
Toodegrees Library