Framing The Week With The Dynamic RTH Gap

Written by
A Sign Of Time
Head of Education & Toodegrees Analyst
This week's newsletter highlights how intraday price development can be framed through the Projection Levels of the Dynamic RTH Gap [Pro+] (TheEngineer). We review a recent Nasdaq session where the High and Low of the Day aligned precisely with projection-based extensions, providing a structured read on orderflow. Alongside this, we share the upcoming Toodegrees livestreams, giving you a front-row seat to live market breakdowns from our analysts.
Nasdaq Futures (NQ) 15-Minute Timeframe
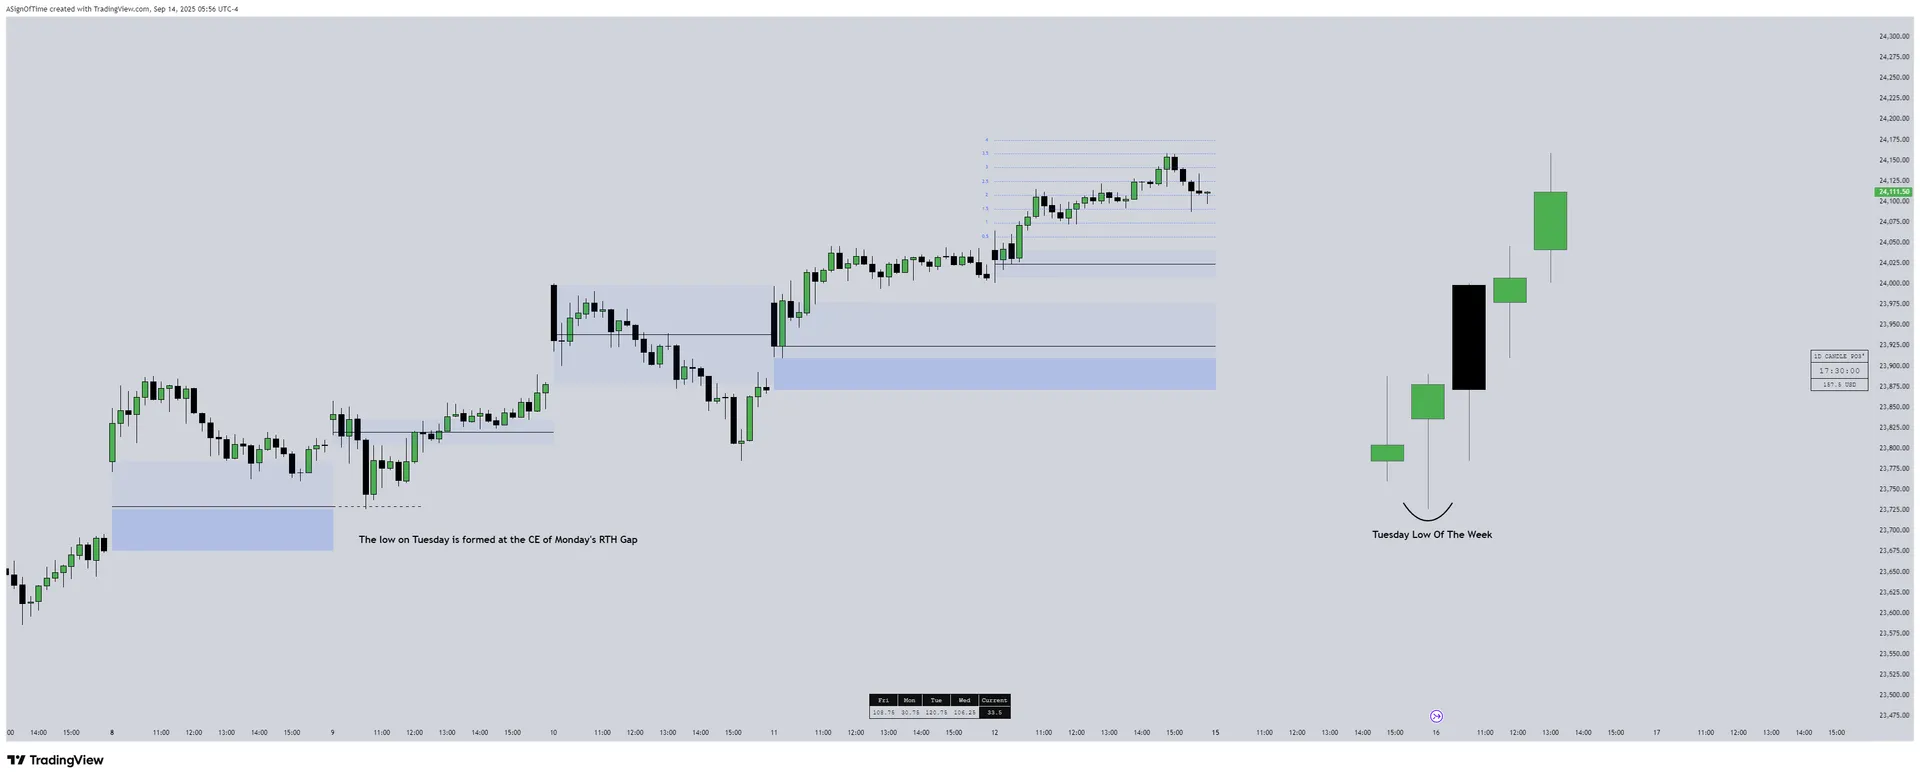
On this chart, the Dynamic RTH Gap [Pro+] is plotted and used as a framework to observe how the week develops. RTH (Regular Trading Hours) gaps form between the prior day's closing price and the next day's opening price during regular market hours. These gaps often act as reference points for intraday orderflow and pivots. With price tending to react around the gap boundaries, traders can use them as magnets for continuation.
During this week, Monday barely fills the gap and reacts off the 25%. Tuesday looks to drive into the unfilled portion, and rebalances to the CE (50%) of Monday's RTH gap, printing the Low of the Week. That response set the directional bias for the weekly expansion.
Ethereum Futures (ETH) Orderblock Alignment
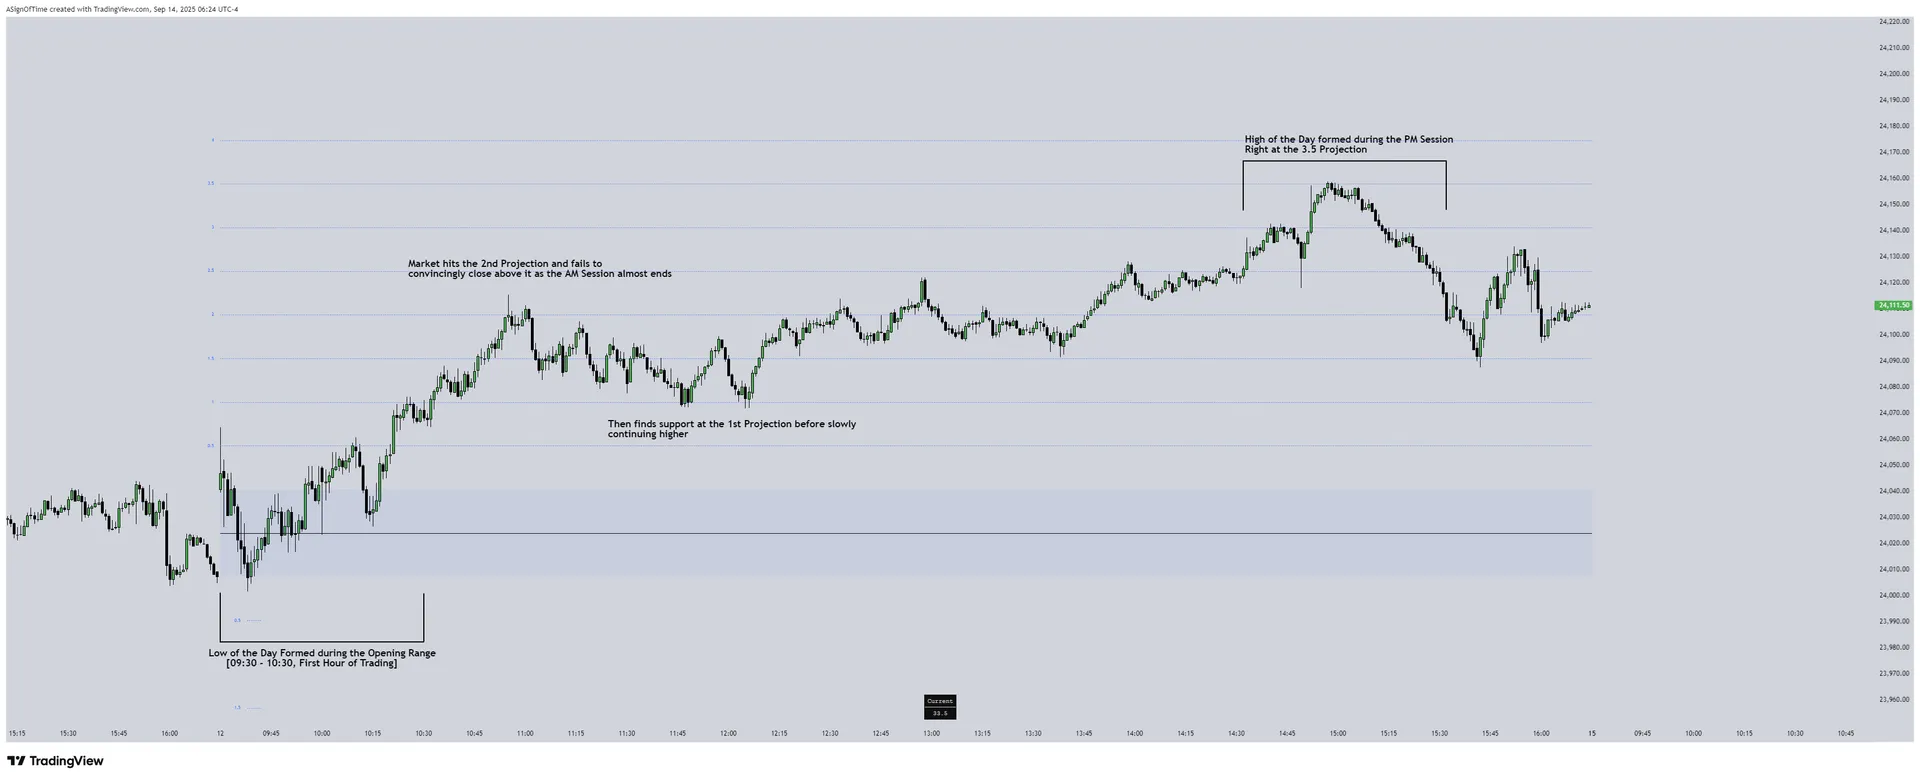
Intraday price development often unfolds in relation to predefined ranges, and the Projection Levels feature inside Dynamic RTH Gap [Pro+] is designed to make that structure clearer. During Friday's price action, the Low of the Day formed during the Opening Range between 09:30 and 10:30, filling the RTH gap low. From there, price expanded upward but stalled at the 2nd Projection, failing to close above it as the AM session came to an end.
Support was later confirmed at the 1st Projection, which allowed price to continue its slow climb higher. The final turning point came in the afternoon, when the High of the Day was set during the PM session, finding resistance at the 3.5 Projection.
These projection levels provided a clean framework for reading intraday orderflow, offering clarity on where turning points were to occur. Rather than tracking random levels, traders can use Gap Projections as structured extensions for mechanical analysis.
![Dynamic RTH Gap [Pro+] — The Engineer](/images/eb849938bcf7c1a635b202835ca39fbde3b3df42.webp)
Featured Indicator
Dynamic RTH Gap [Pro+] (The Engineer)
This Week's Stream Schedule
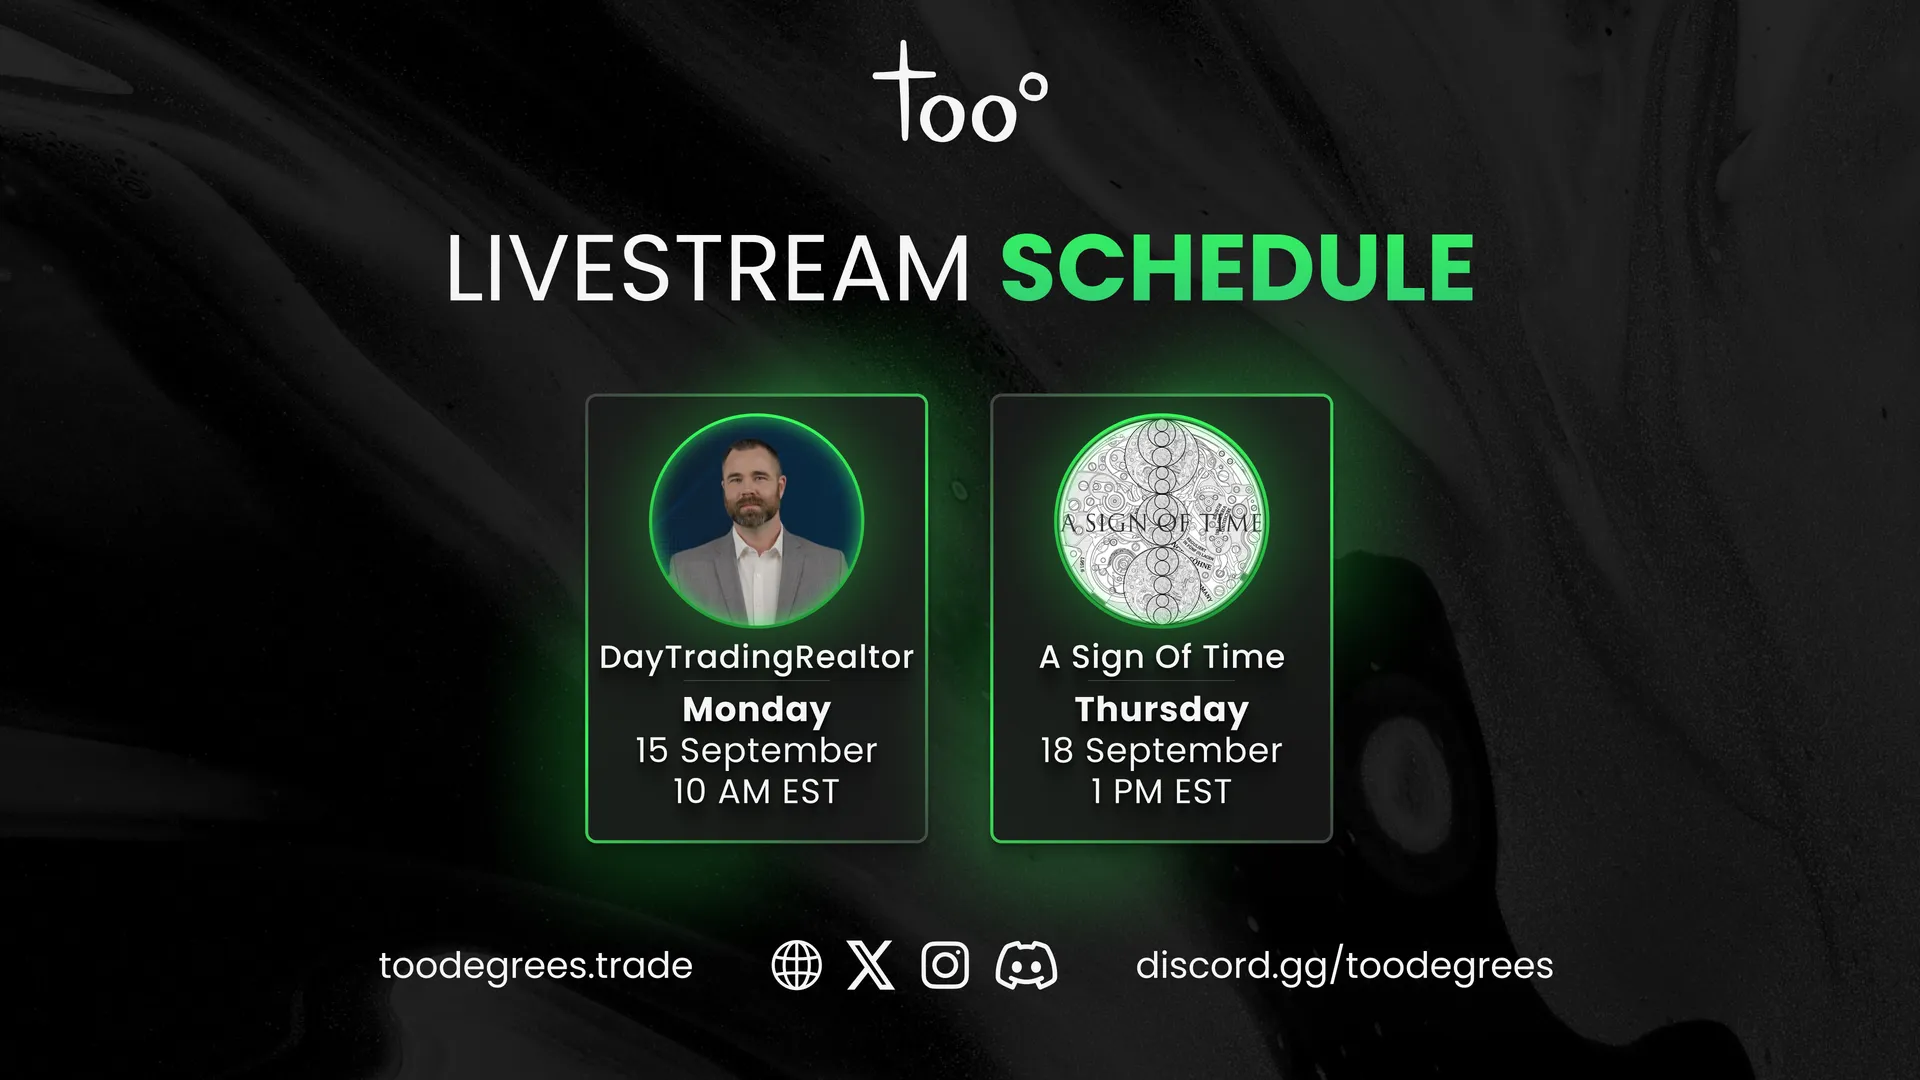
Get ready for this week's livestreams in Toodegrees Escape Discord!
On Monday, DayTradingRealtor will walk through the Fractal Model [Pro+] (TTrades), showcase how he combines it with Average Range Levels [Pro+], and break down the latest updates. He'll also share his OSOK (One Shot One Kill) Strategy and explain how to view prop firms through a business lens.
On Thursday, A Sign Of Time will take a macro-technical look at the markets, exploring unfolding narratives and in-depth analysis of current conditions.