How Liquidity Tells The Story

Written by
A Sign Of Time
Head of Education & Toodegrees Analyst
This week's newsletter highlights how liquidity pools and SMT divergences shaped turning points on index futures. Using Liquidity Depth [Pro+], we track how the market cleared buyside levels before reversing through sellside to rebalance.
We'll also present the new MAG7° layout, highlighting how each of the Magnificent Seven measures up.
Nasdaq 100 Futures — PoiSzn AM Session
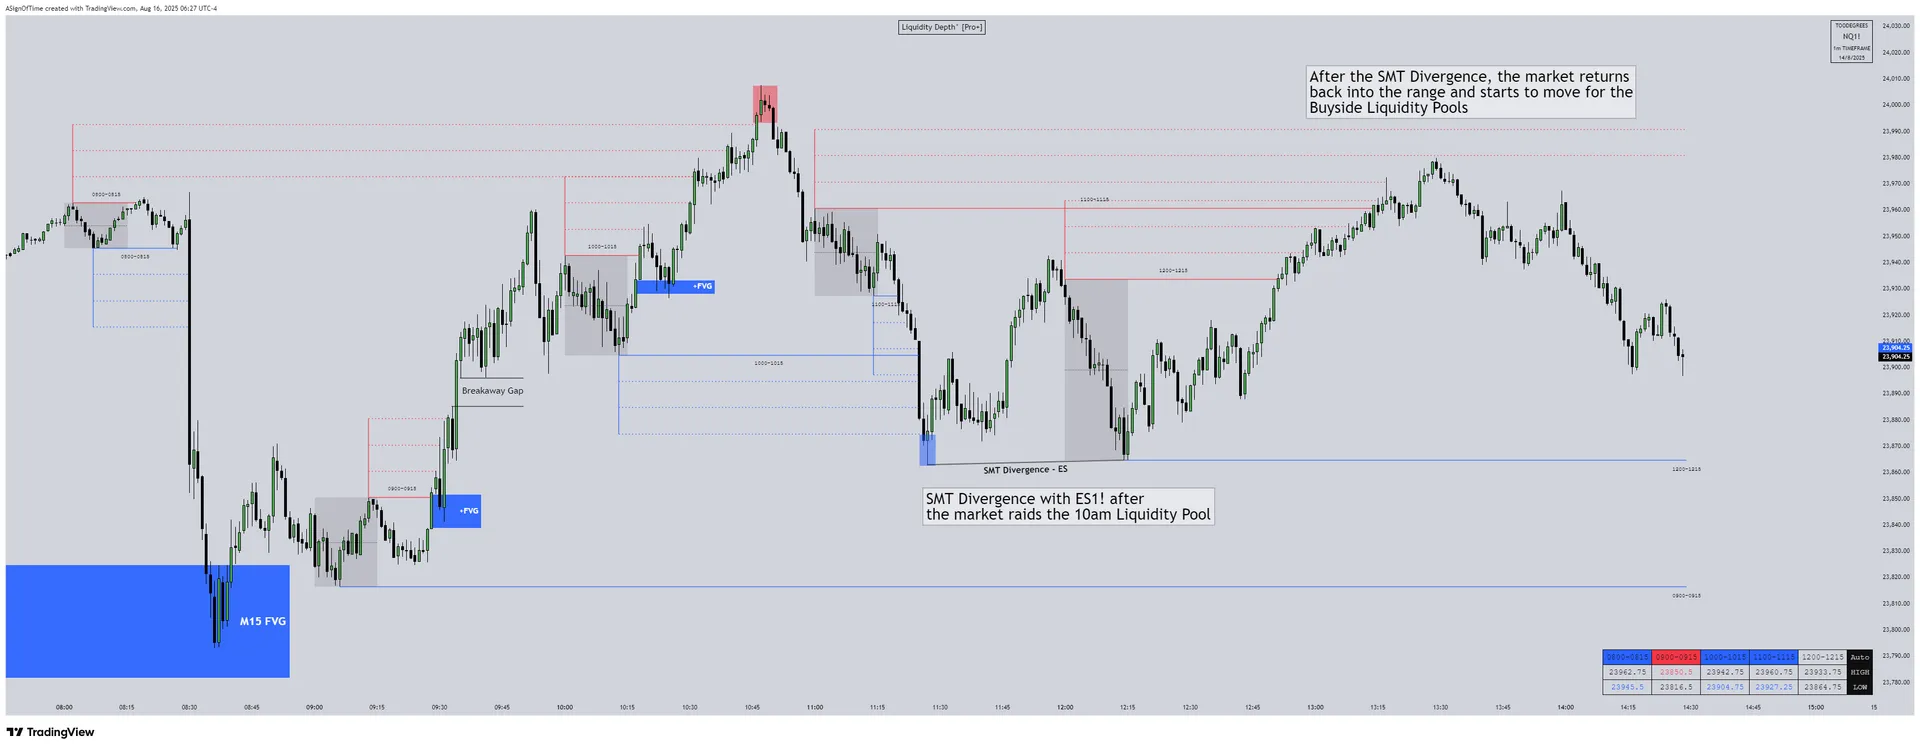
The chart above shows the Liquidity Depth° [Pro+] indicator on Nasdaq futures (NQ), configured with PoiSzn AM Ranges to spotlight the first 15 minutes of each trading hour from 8:00 AM to 12:00 PM EST.
NQ had a clear liquidity rotation on August 14th, 2025 for Core PPI. After the initial move lower, the market retraced to run three consecutive buyside liquidity pools before rotating back into the range and targeting sellside levels. Just after 11:00 AM, NQ raids the 10:00 AM sellside liquidity pool, marking a pivotal point in the session, and forming a SMT divergence against ES. While ES prints a lower low, NQ held to a higher low.
This divergence is an algorithmic signature, often highlighting the precursor for a shift in orderflow. From there, the market turned back toward buyside to clear trailed stops.
Analyst Insight
Liquidity raids often mark key turning points when markets are in consolidation. During intraday expansions, traders want to monitor the midpoints of Fair Value Gaps for signs of rebalancing and continuation, while also watching for SMT divergence in correlated markets such as ES1! with NQ1! to identify potential manipulation during shifts.
Nasdaq 100 Futures — Time Distortion Rebalancing
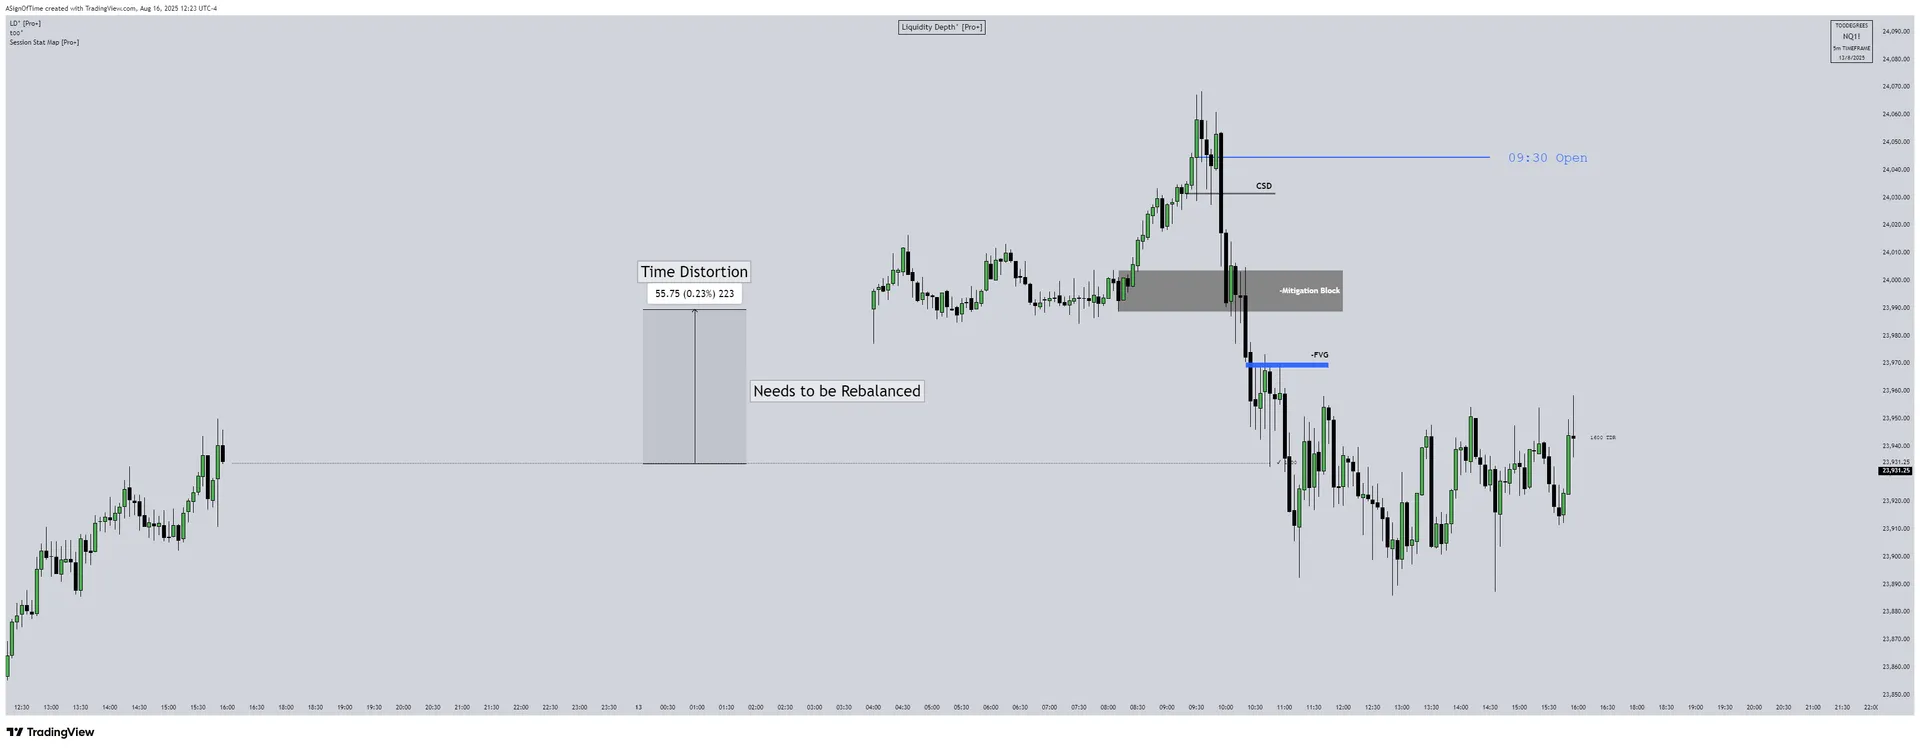
This example highlights the Time Distortion Rebalancing (TDR) feature, setting the distortion session to the regular trading hours close to the beginning of pre-market trading in equities. Here, traders can observe a clean price gap that formed between 4:00 PM EST and 4:00 AM EST. This time period is characterized by low trading volume, which often sets the stage for a future rebalance as higher volume activity in the AM session creates a natural draw for price to return.
At the 09:30 open, the market quickly sets a high before reversing lower. This move establishes a Change in State of Delivery (CISD) along with a clear orderblock. However, the aggressive push downward leaves no retracement into the orderblock. Instead, focus shifts to the mitigation block on the left side of the chart, where price briefly stalls before expanding lower. This expansion leaves behind a Fair Value Gap (FVG), which then served as a reference point for order flow to continue driving price down toward the prior day's PM session liquidity. After raiding liquidity and rebalancing the overnight session, price settles into consolidation for the remainder of the day.
New Analyst Layout — MAG7°
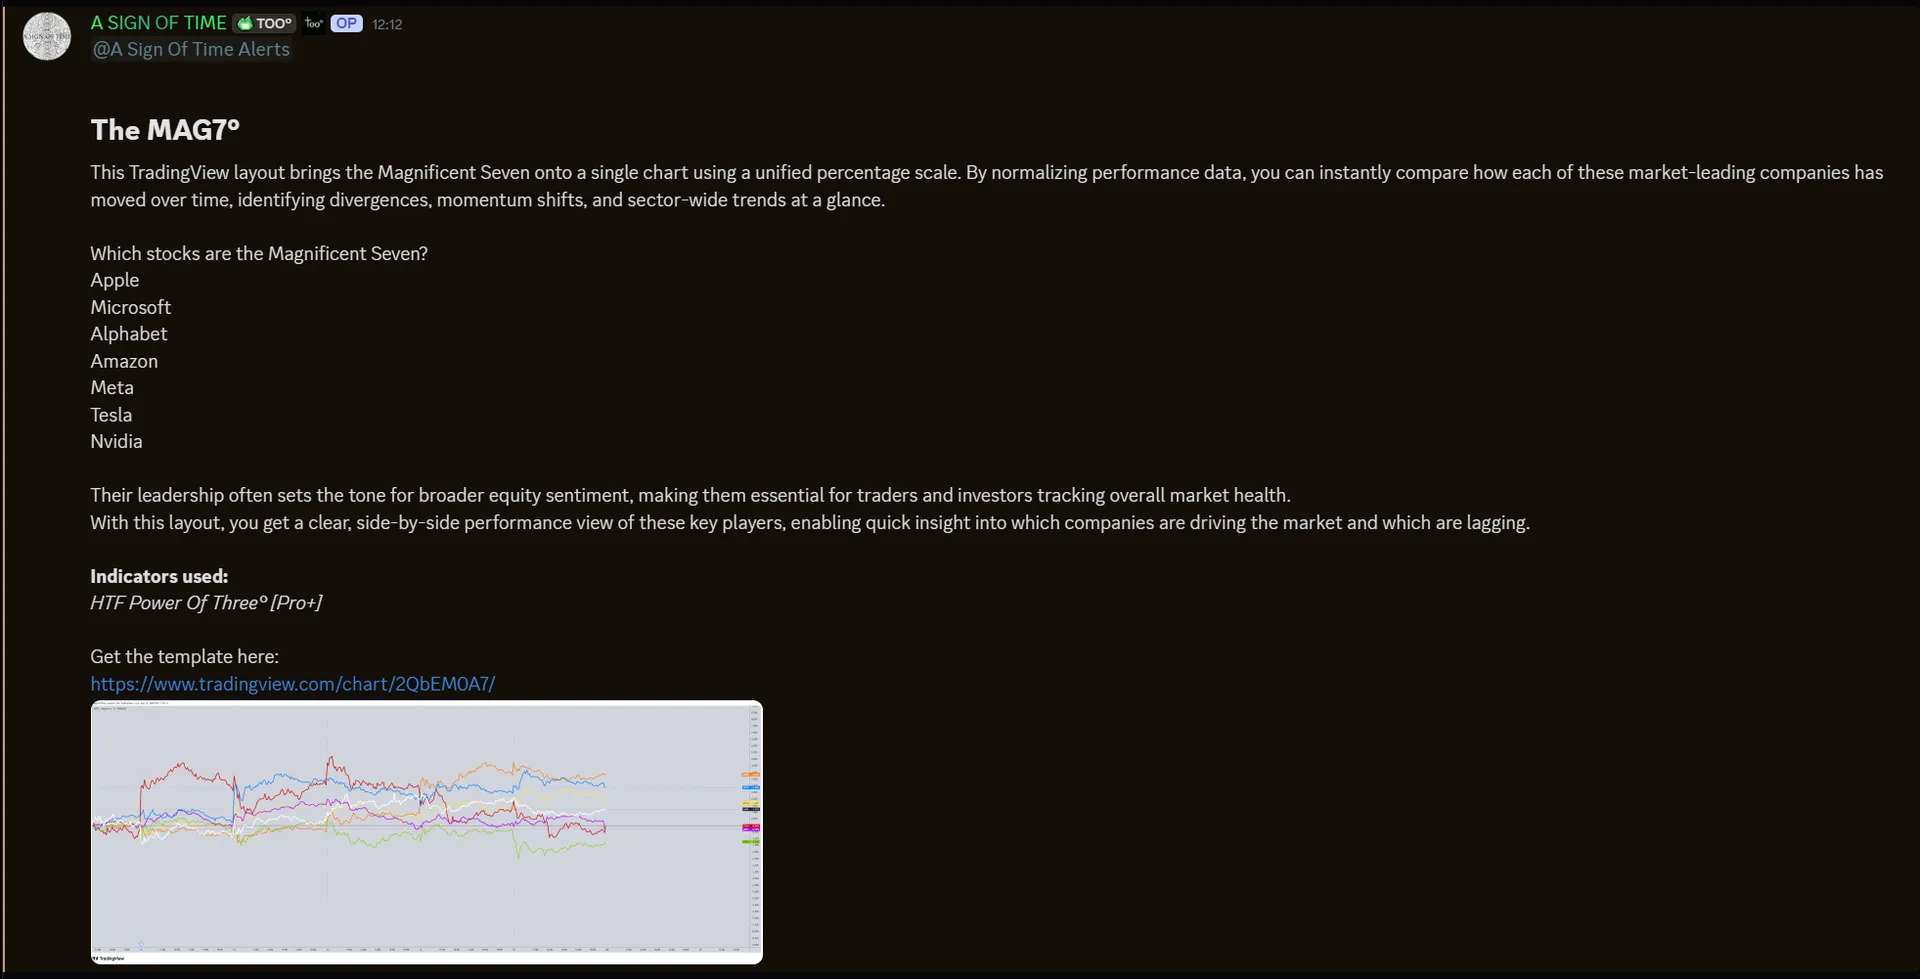
A Sign of Time just released a new TradingView layout inside Toodegrees Escape Discord. This layout displays the Magnificent Seven (MAG7) on a unified percentage scale, allowing for quick, clear comparisons of both intraday and long-term momentum among the largest index components.
Copy the layout and read the full post inside the Analyst Channel!
Featured Indicator