How Session Stat Map Frames The Intraday Play

Written by
A Sign Of Time
Head of Education & Toodegrees Analyst
This week's newsletter showcases the Session Stat Map [Pro+] in action. You'll learn how to apply premium and discount levels, spot the shift from consolidation to expansion, and use Liquidity Depth with Power of Three for added clarity. Together, these tools provide key levels, range projections, and market narrative for a repeatable framework to spot trades with confidence.
Nasdaq Futures (NQ) London Killzone
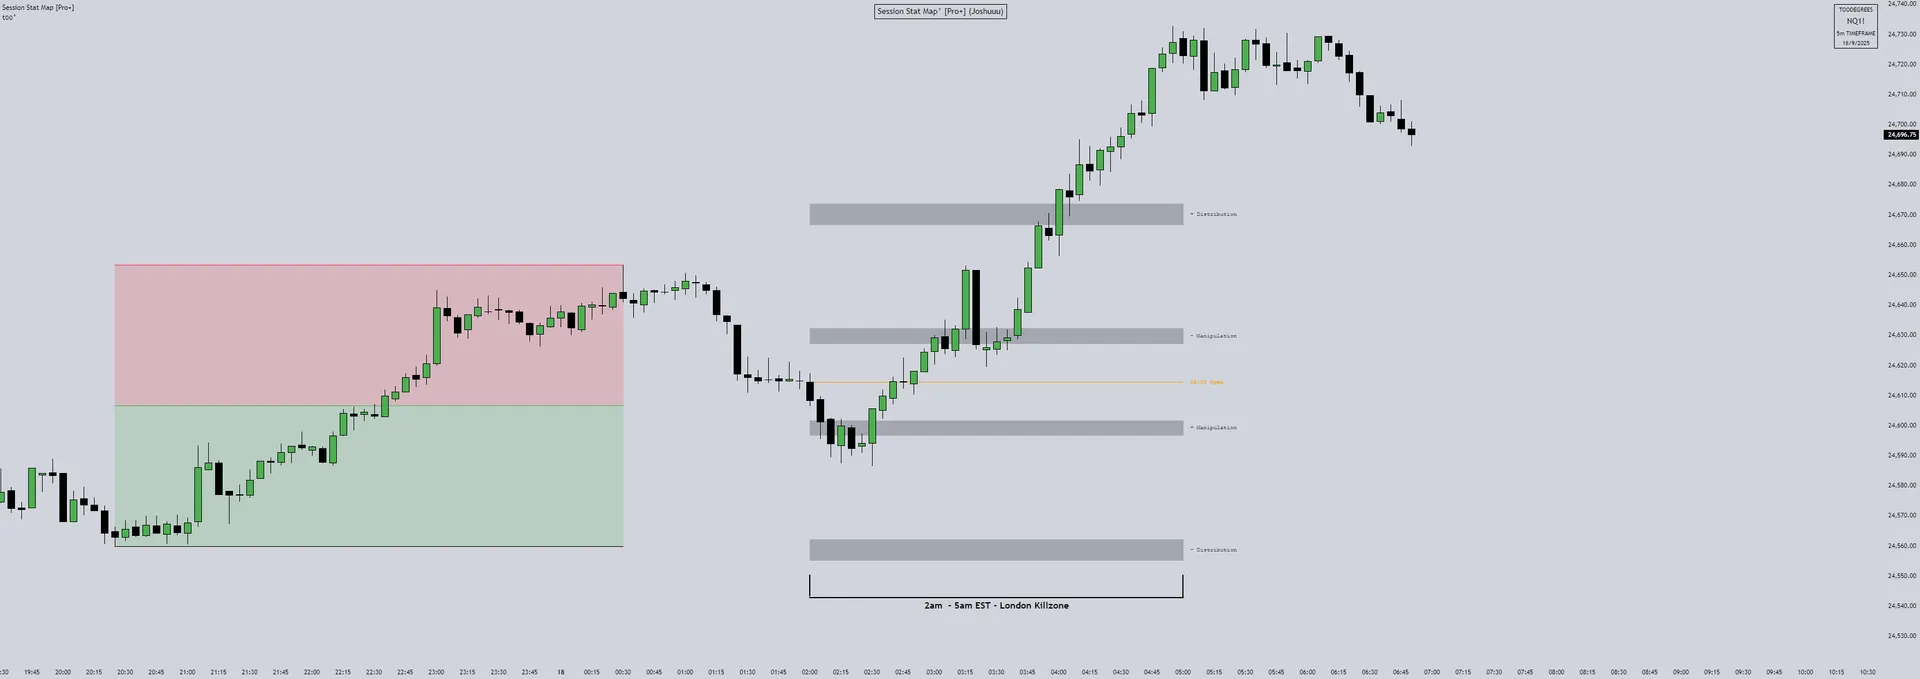
In this example, traders can see a clear Asia-session expansion. In trending markets, price often retraces to the 50% level of a price leg to maintain a healthy trend. By using a Fibonacci retracement tool, you can define premium and discount zones that qualify key levels and strengthen market narrative.
Notice how the Session Stat Map, set to the London Killzone (2:00–5:00 EST), aligns with the discount side of the range. Price retraces into the bullish manipulation level within that discount zone, then breaks structure to the upside, expanding beyond the prior high and toward the statistical bullish distribution level.
SP500 Futures (ES) PM Silver Bullet
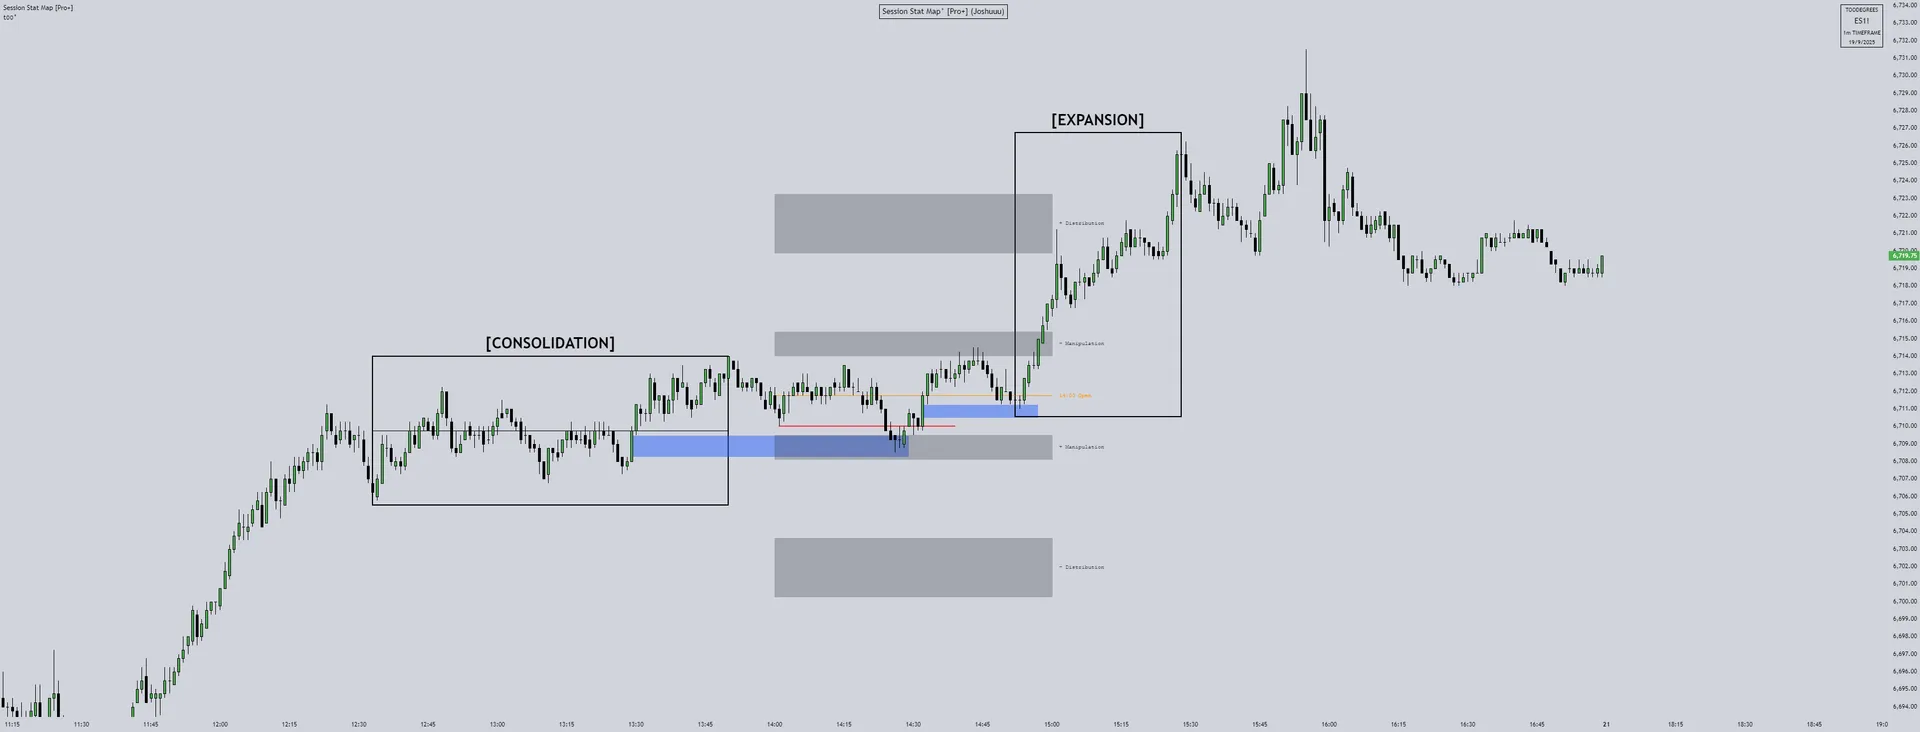
Looking at ES, price enters a consolidation during the Lunch Hour before expanding in the PM Silver Bullet window (2:00–3:00 EST). During this consolidation, an FVG and Orderblock form at the midpoint, creating a clear discount array. On the Stat Map, the statistical bullish manipulation level aligns with this same area. After reaching these discount levels, price shifts its delivery: the market exits consolidation and begins to expand toward the statistical bullish distribution level.
![Session Stat Map [Pro+] — Statistically derived session levels](/images/d9c145baa05b06991e544377c3d32b4900c6cec6.webp)
Featured Indicator
Session Stat Map
Euro / US Dollar (EURUSD) New York Killzone
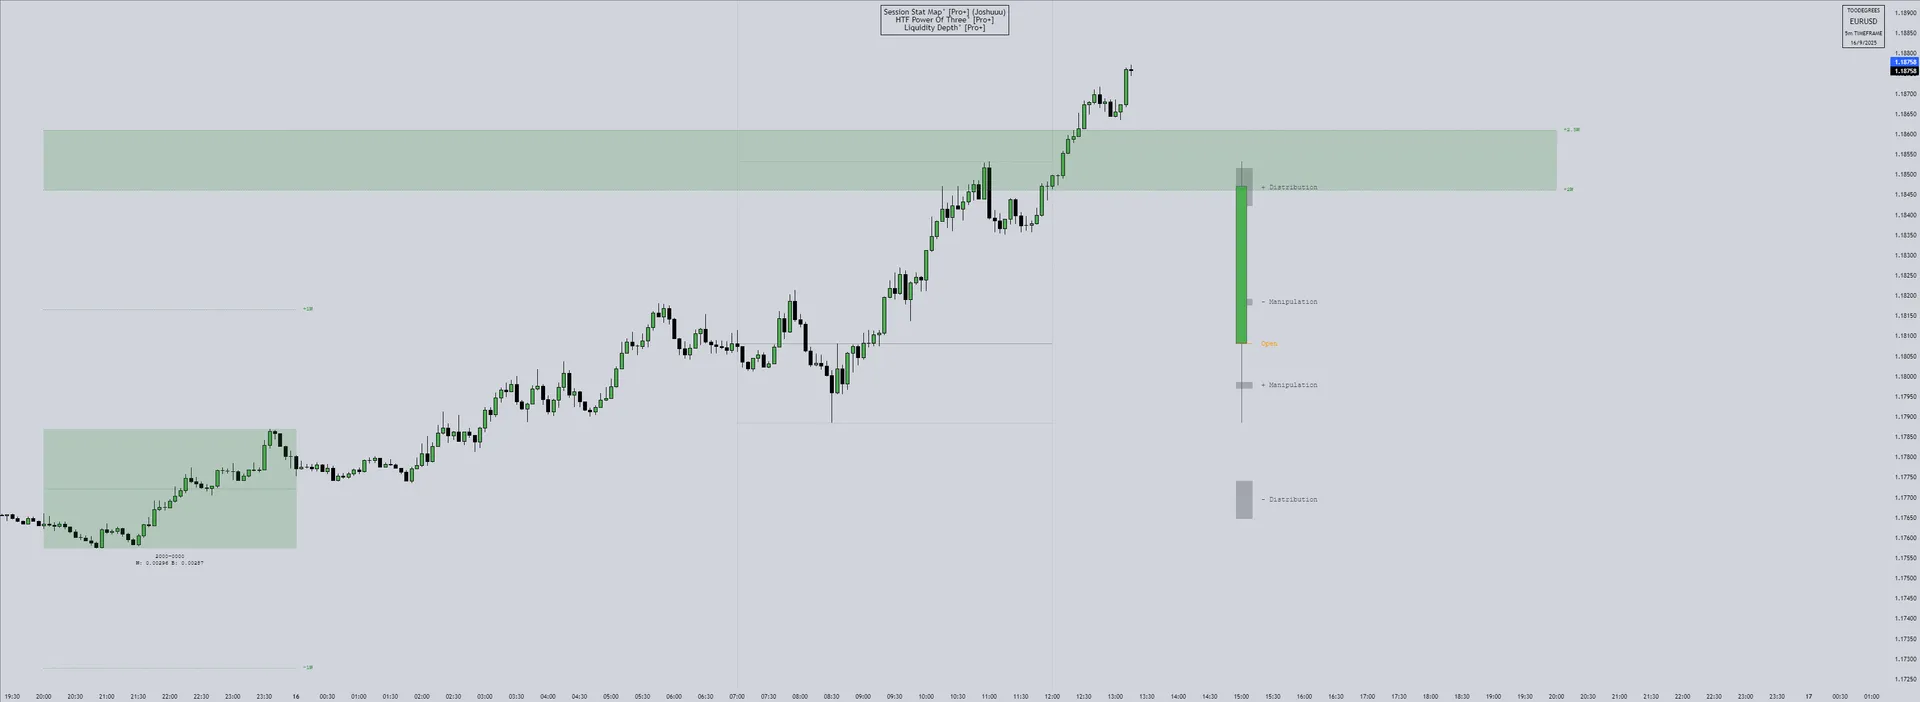
In this example, the Session Stat Map [Pro+] is set to the New York session (7:00–12:00 EST) using the Offset setting. This overlays the Stat Map levels with the custom HTF Power of Three candle, anchored to the same session window.
The Liquidity Depth [Pro+] indicator applies Range Deviation to the Asian Range (20:00–00:00 EST) and projects its standard deviation levels. Here, the 2.0–2.5 projection aligns with the statistical bullish distribution level, providing both statistical and price action confluence for upside targets.
Notably, the bullish manipulation occurs at 08:30 EST, a common news release time, before price expands through New York into the statistical bullish distribution level and range projection.

Featured Bundle