July 2025 EOM Report — Inter Market Dynamics

Written by
A Sign Of Time
Head of Education & Toodegrees Analyst

Section 1
Monthly Recap — US Indices
Welcome to the July End-of-Month Market Recap, a concise review of July's price action across U.S. equity futures, FX pairs, and Treasury bonds. Equity futures advanced more selectively, with NQ and ES maintaining leadership, while the Dollar Index staged its first monthly gain of 2025.
Recent Events — EU–U.S. Trade Agreement
The EU and U.S. announced a trade and investment framework: a baseline 15% U.S. tariff on most EU goods, an EU commitment to purchase roughly $750B of U.S. energy, and an EU plan to mobilize about $600B in U.S. investments. The deal temporarily lifted uncertainty, supporting risk assets. However, European officials criticized the deal as unbalanced, and EUR/USD weakened as concerns grew over Europe's long-term growth.
Key Elements
Trade Predictability: Greater clarity for cross-Atlantic supply chains, reducing a key tail risk that had weighed on equity markets.
Energy & Investment Flows: EU commitments represent structural demand that could support USD over the medium term.
Unresolved Details: Final legal text and timelines pending — leaving room for continued uncertainty as negotiations progress.
July Results — US Index Futures
In July, U.S. equity futures traded with a more measured pace. The Nasdaq-100 ($NQ) gained +2.2%, driven by ongoing AI momentum and favorable seasonality, pushing to fresh all-time highs. The S&P 500 ($ES) added +2.02%, supported by resilient GDP growth and strong corporate earnings. The Dow Jones ($YM) declined -0.09%, with breakout attempts near resistance struggling to hold momentum.
$NQ = E-Mini Nasdaq 100 Futures · $ES = E-Mini S&P 500 Futures · $YM = E-Mini Dow Jones Futures
Sentiment Analysis
AAII Investor Sentiment (July 31): Bullish rose to 40.3% — exceeding the long-term average of 37.5%. Bearish fell to 33.0%. Fear & Greed Index (July 31): 59 — Greed. The EU–U.S. trade deal temporarily lifted uncertainty. However, an elevated SPX put–call ratio and lingering global uncertainties suggest positioning remains hedged.
Section 2
Technical Analysis — Nasdaq 100
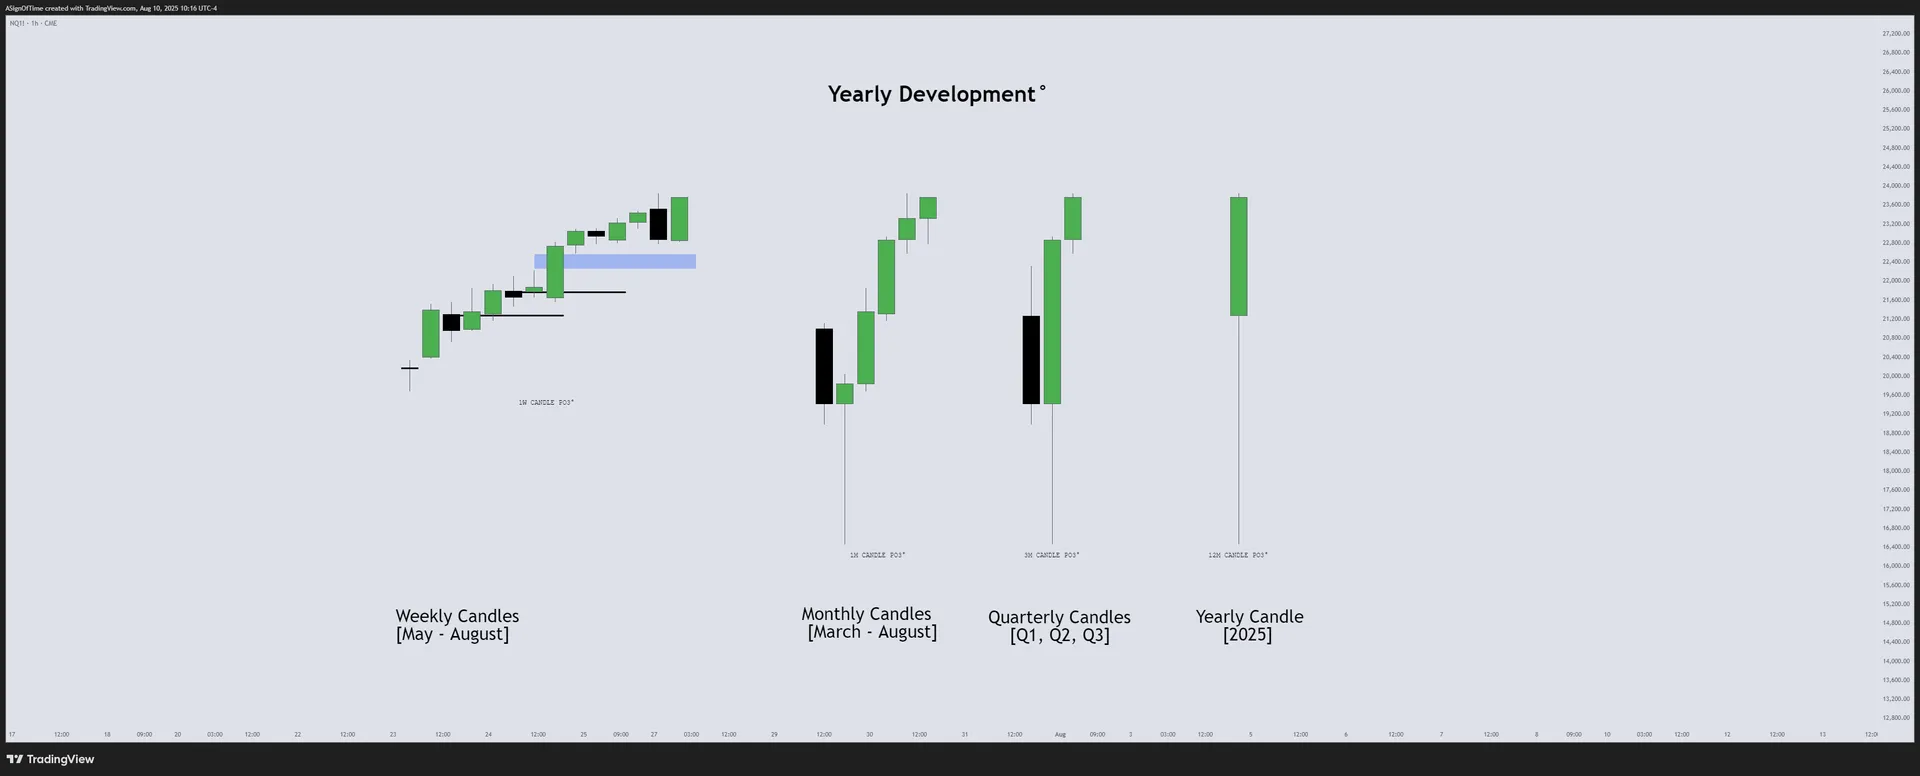
NQ Monthly Recap — HTF Power of Three Dashboard
Following the steady climb through July, NQ continued to push into uncharted territory, building on the momentum from earlier in the year. The index remains in price exploration mode above prior all-time highs, with buyers maintaining control despite consolidation. Historically, sustained breakouts can extend longer than expected — making premature top-picking risky.
Multi-Asset IPDA — July 1st Anchored
IPDA Lookback anchored at the start of July, measuring Relative Strength across NQ, ES, and YM relative to the 60-day lookback period.
[E-MINI NASDAQ 100]
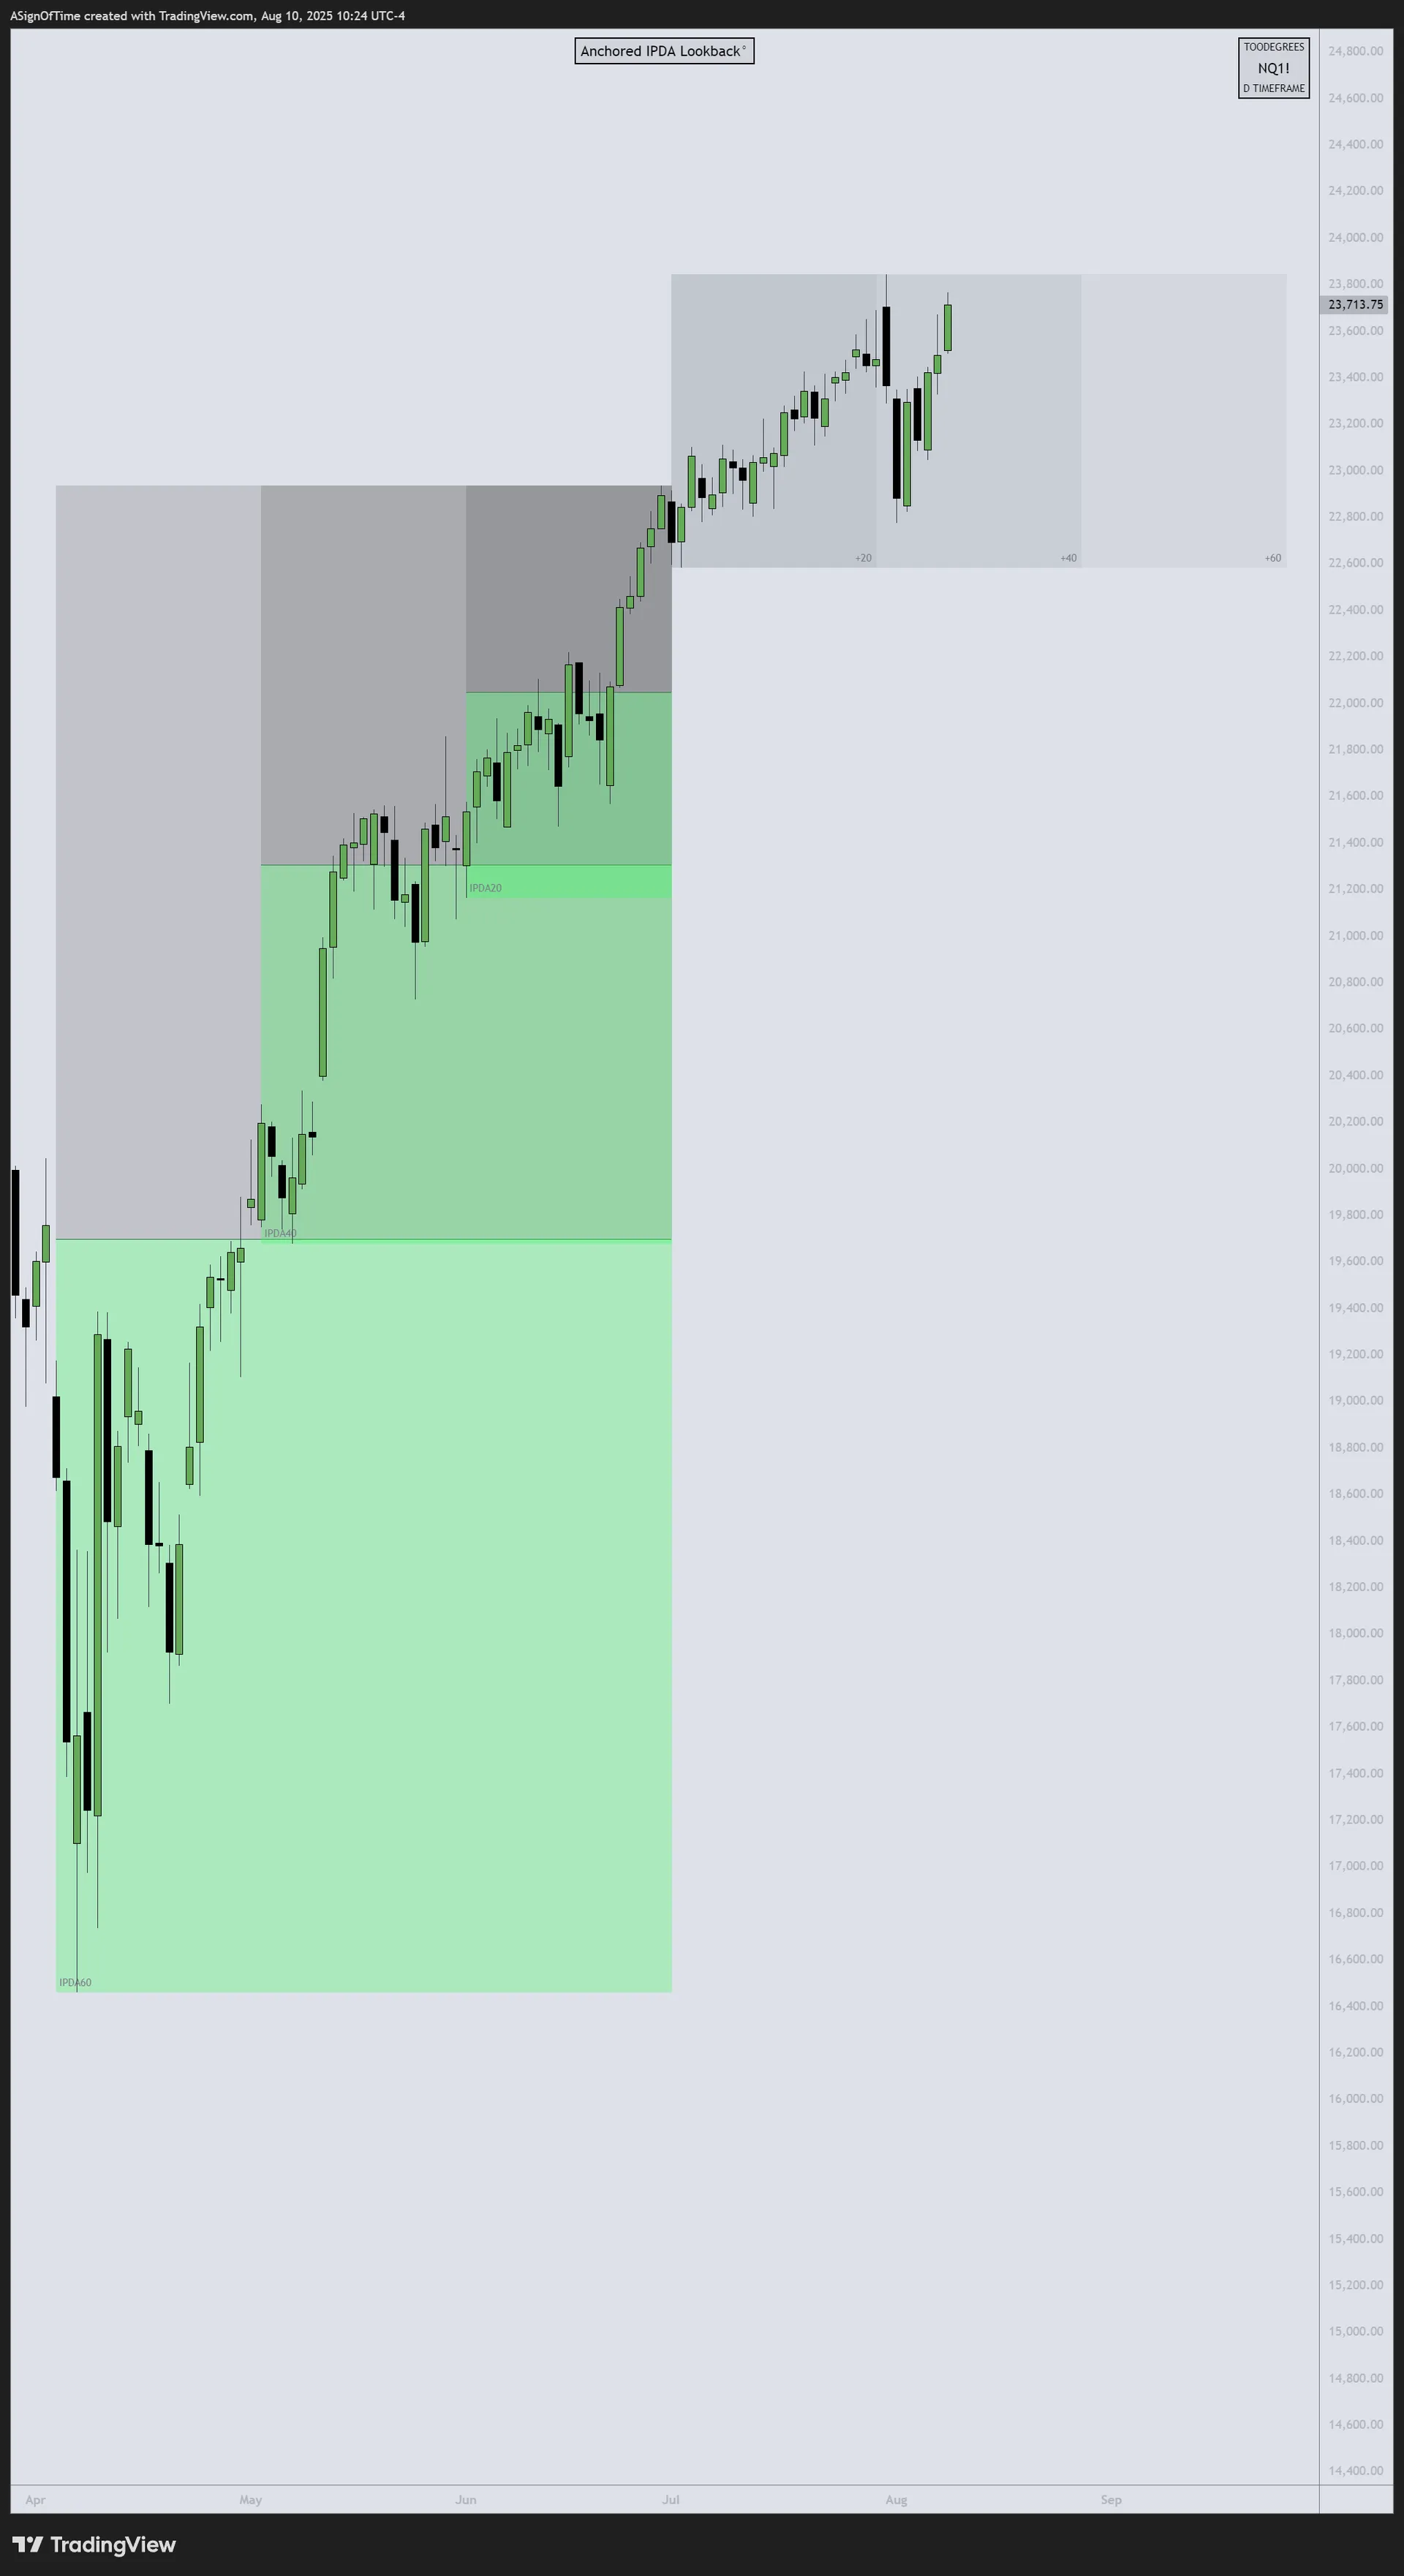
Toward Record Highs
[E-MINI S&P 500]
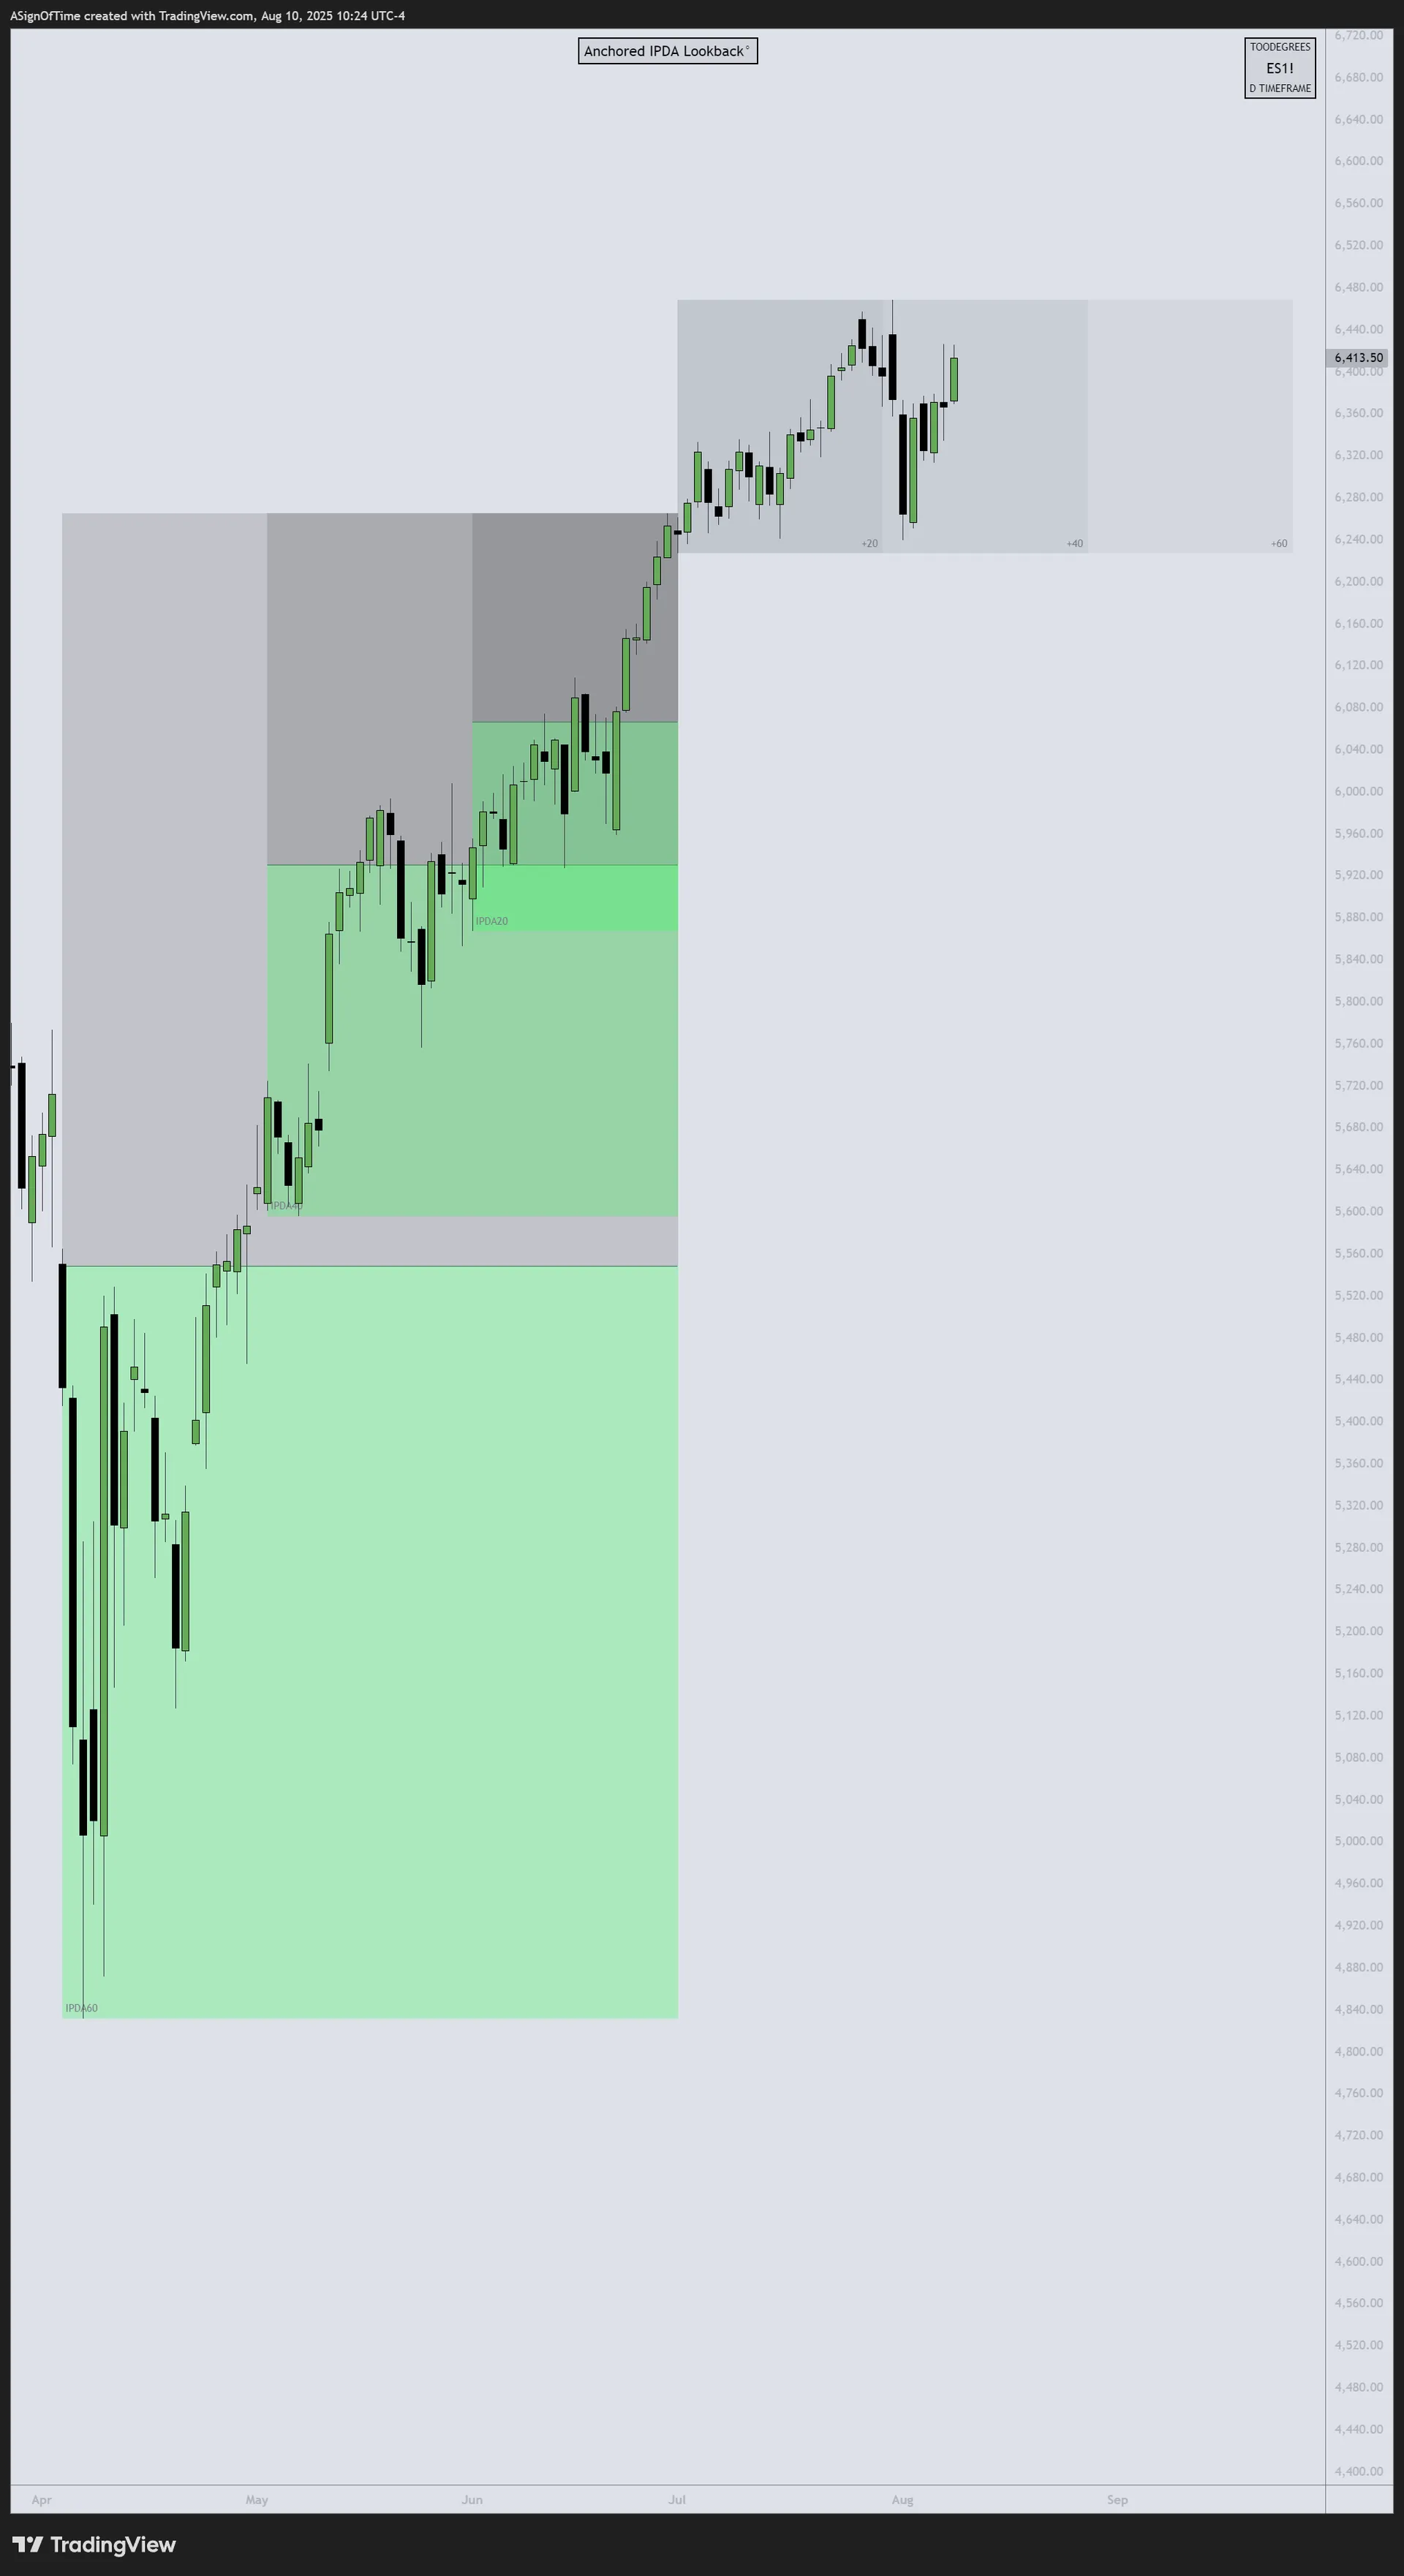
Broad Participation
[E-MINI DOW JONES]
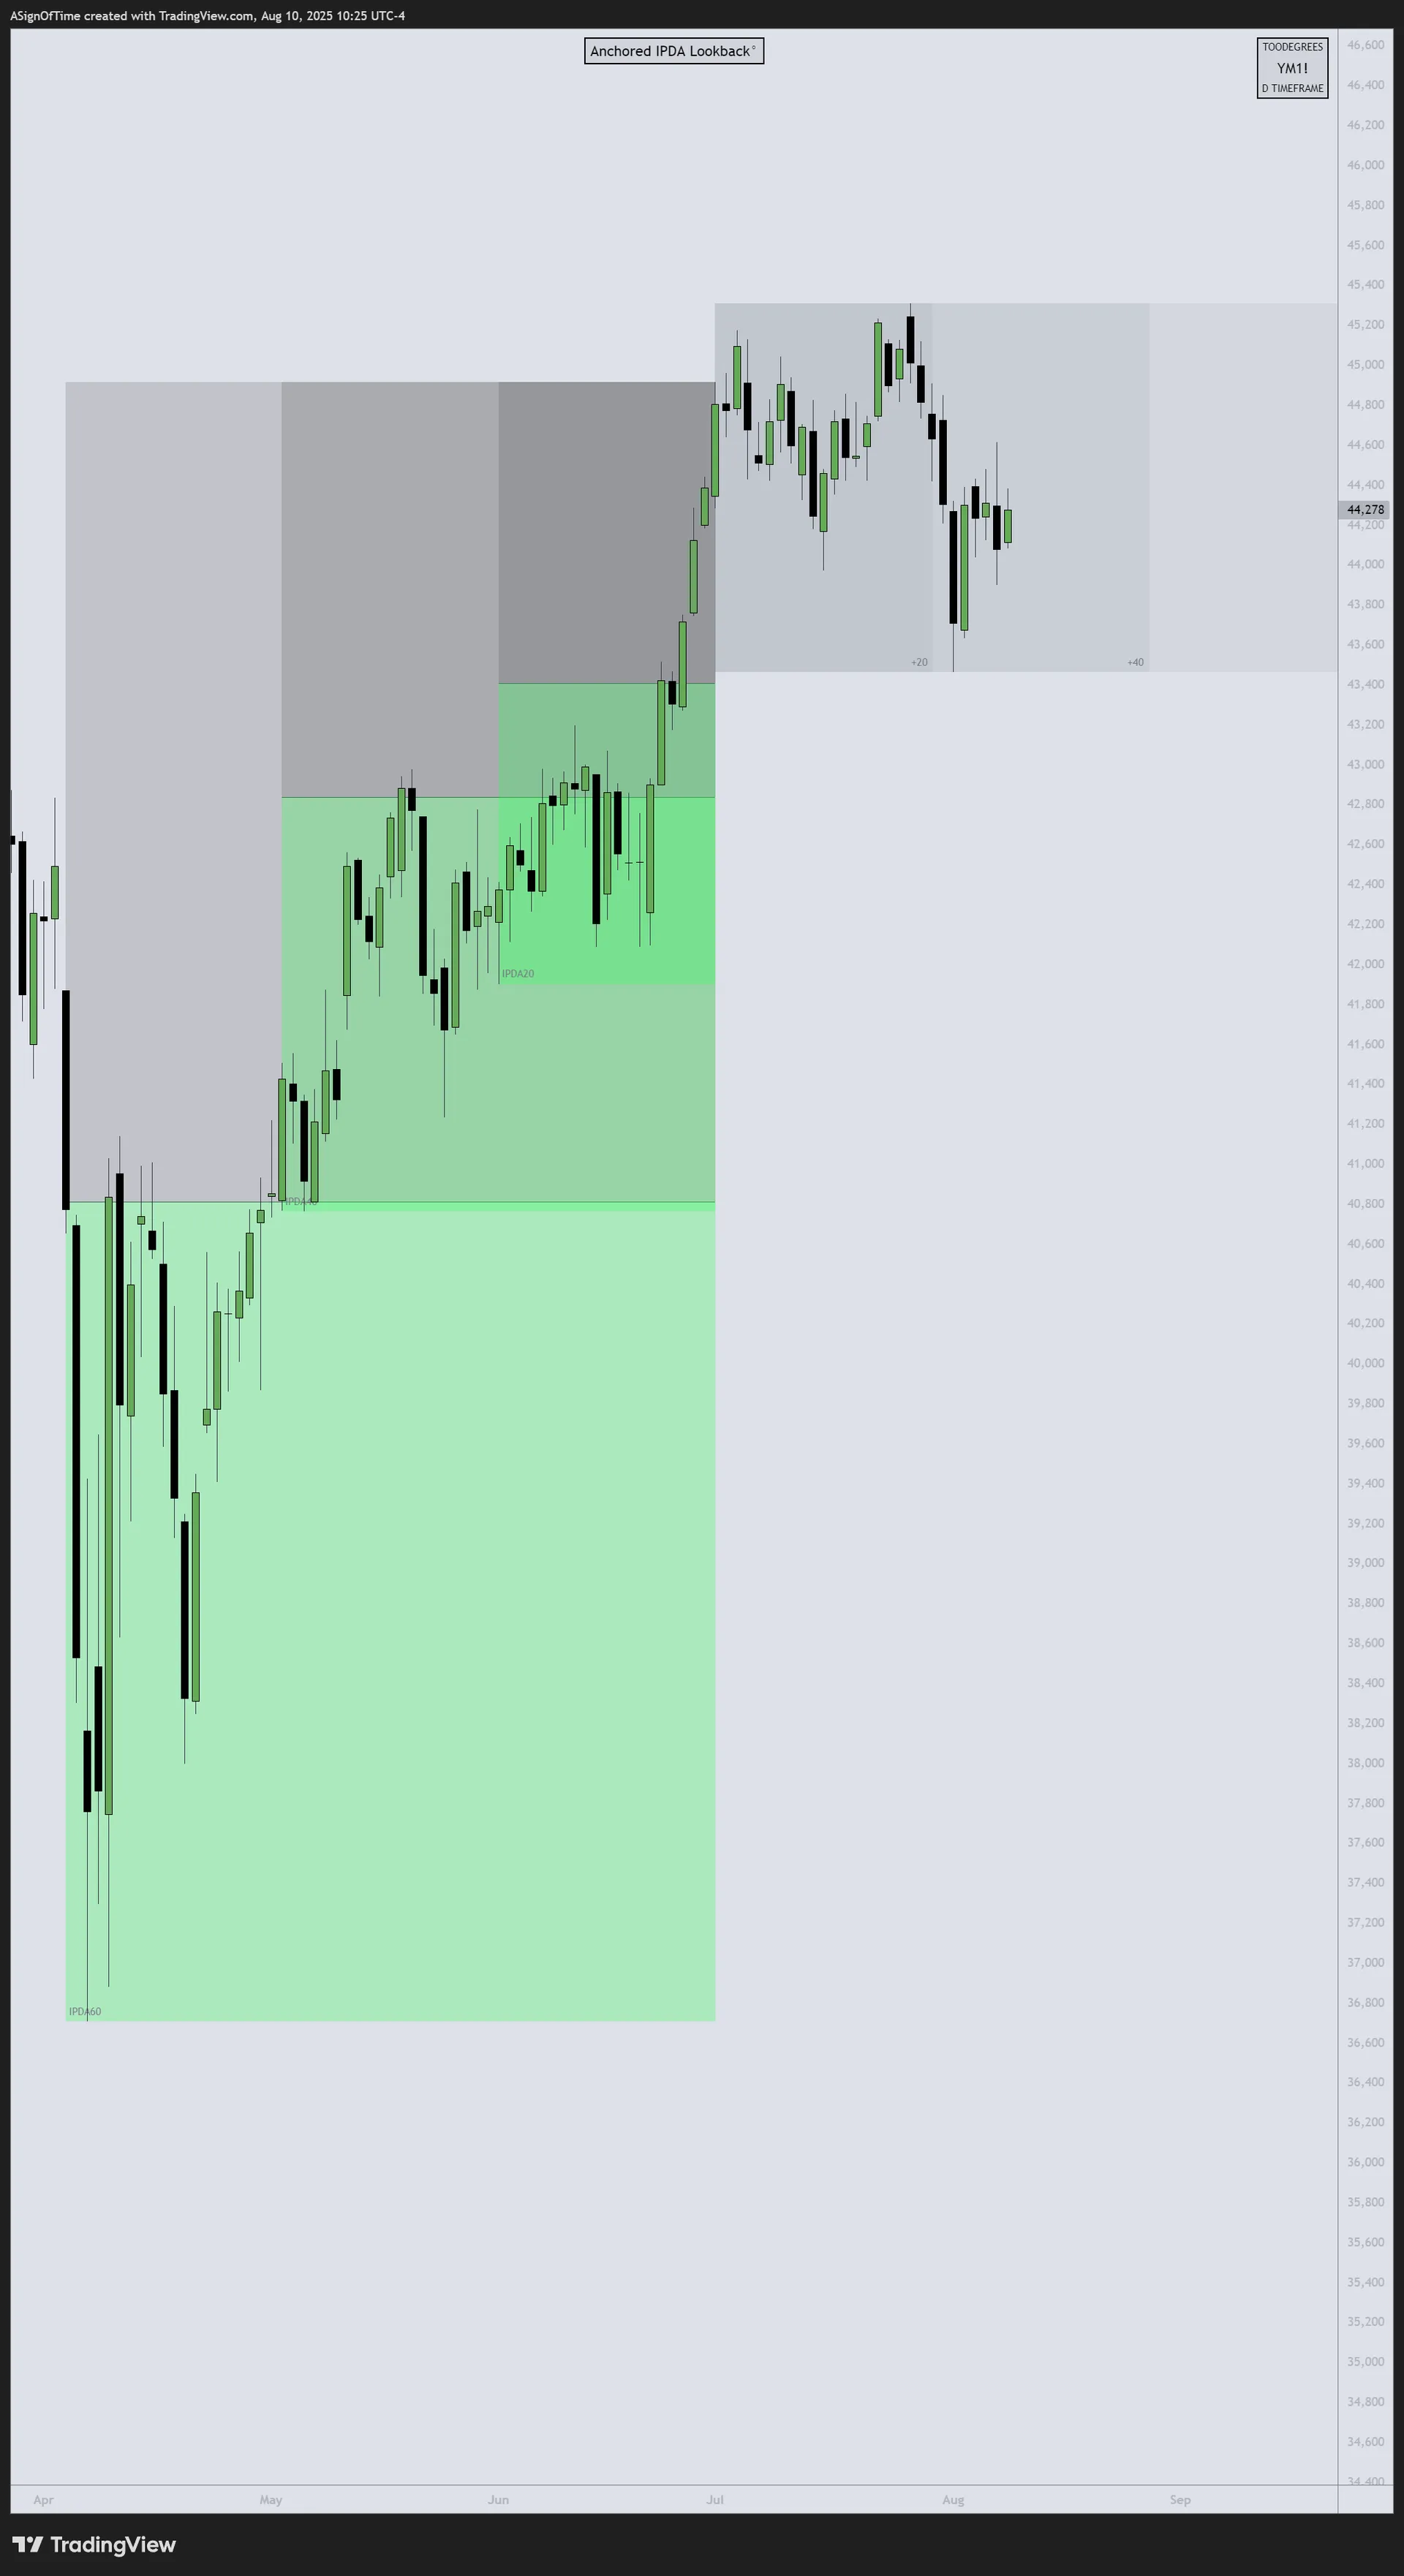
Below Summer Highs
Analyst Insight
Since the start of July, NQ and ES showed steady resilience, moving back toward recent highs after a brief consolidation. NQ led, climbing toward record territory on renewed AI/tech strength. ES followed closely with broad sector participation. YM underperformed — industrial and value-oriented names have yet to match the pace of the tech-led rally.
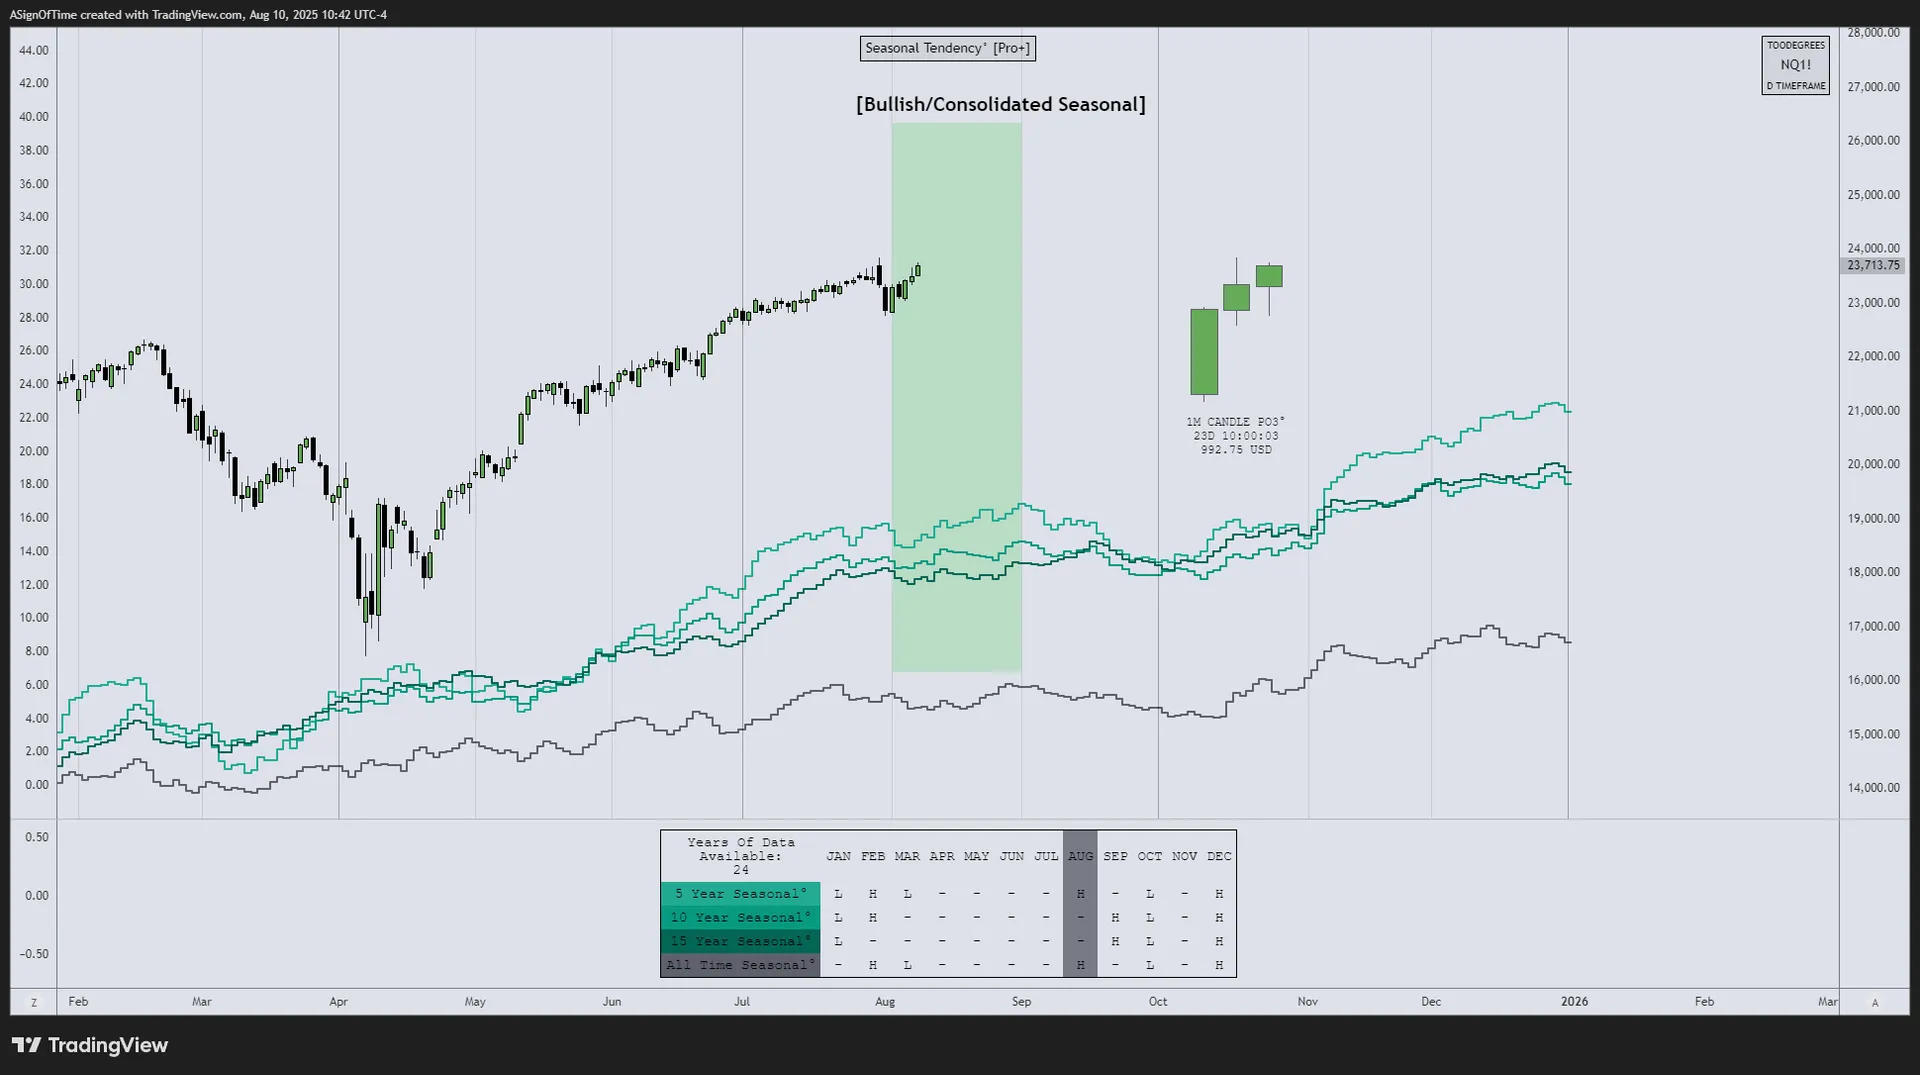
NQ Seasonality Analysis
Seasonal tendencies for the Nasdaq 100 E-Mini Futures. As NQ approaches the historically more volatile late-summer period, monitoring the seasonal roadmap provides additional context for directional bias.
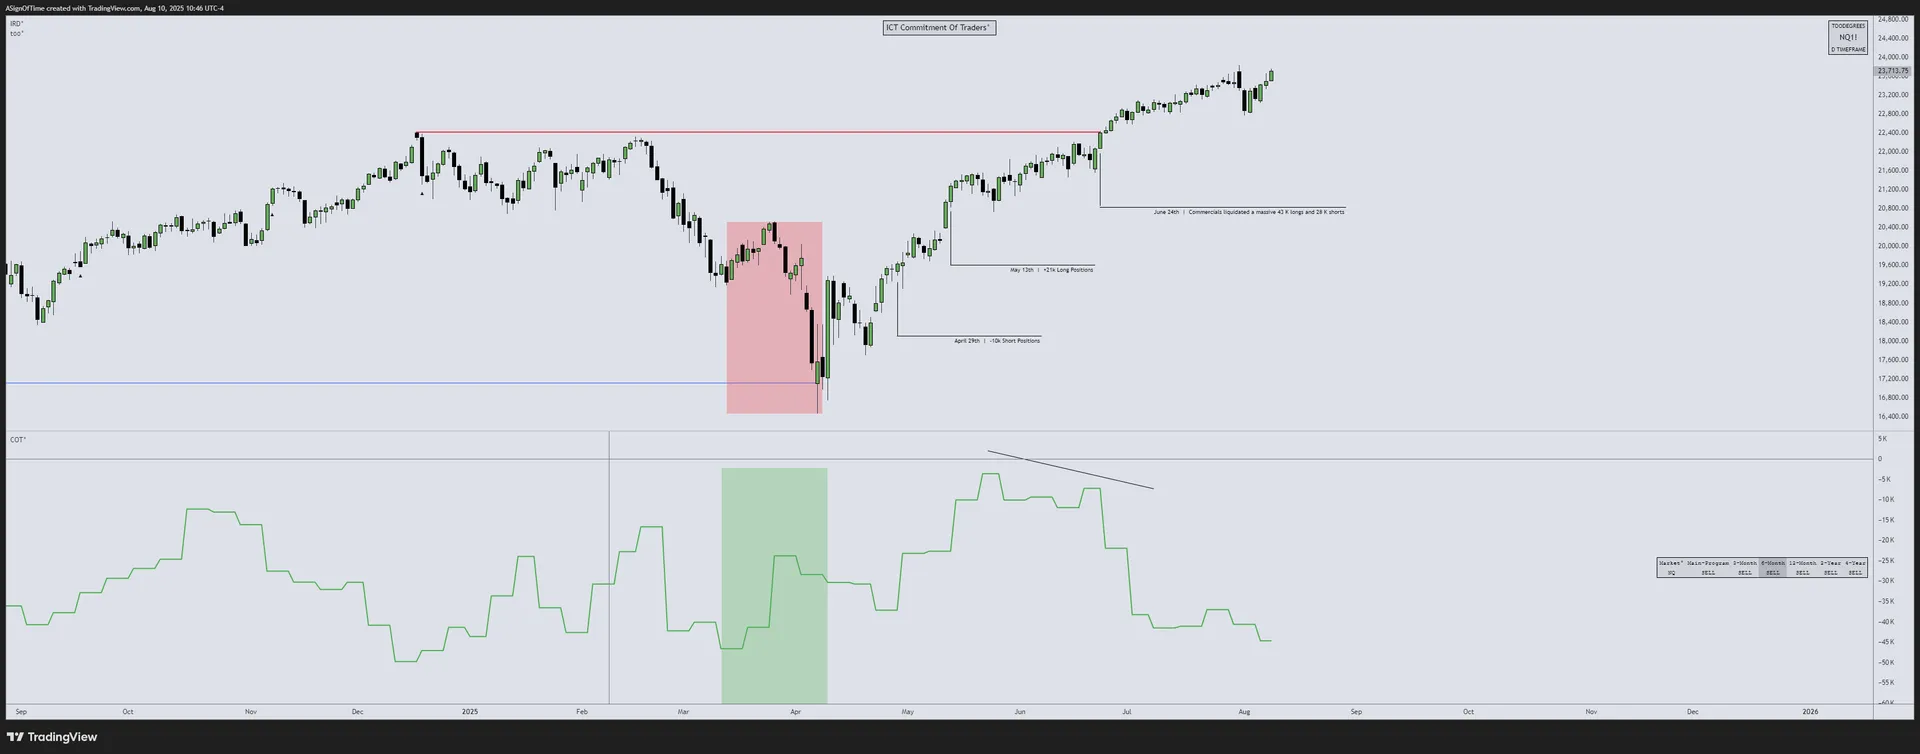
NQ Commitment of Traders
Commercials have steadily reduced their net long exposure since late June, even as price continued to push higher. This divergence can indicate: (1) profit-taking after the extended rally, (2) seasonal slowdown as August historically sees lighter volume, (3) contract rollover — commercials chose to close rather than roll to the new quarterly contract.
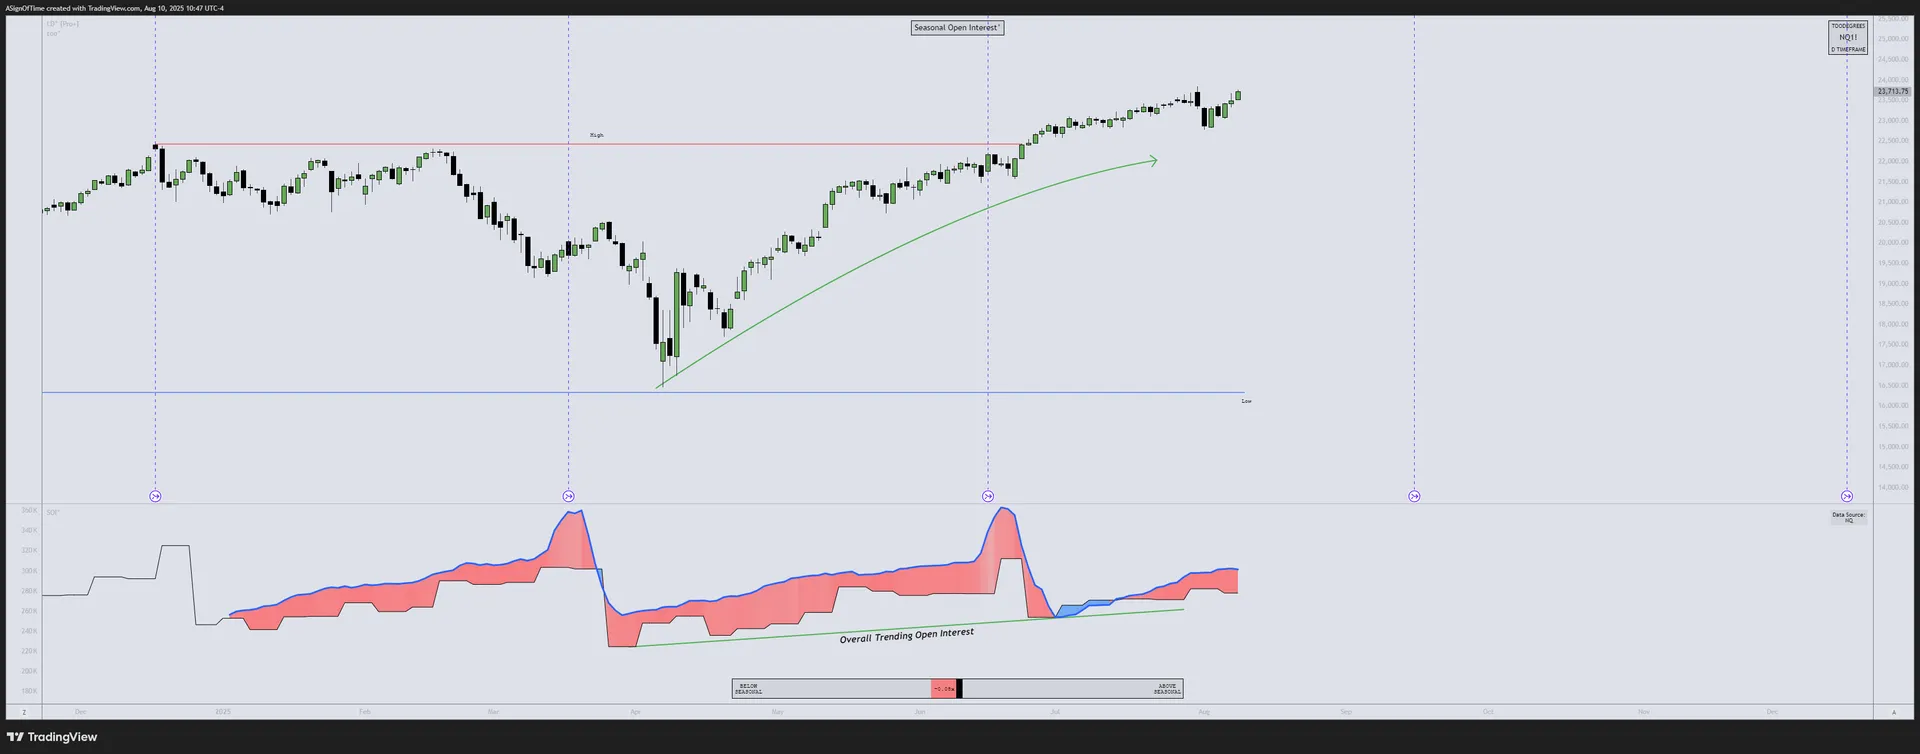
NQ Open Interest
Open Interest (OI) represents the number of outstanding NQ futures contracts. Monitoring OI alongside price action and commercial positioning provides a multi-layered view of market conviction.
Section 3
Inter-Market Dynamics — Currency & Bond Markets
July Results — Currency Markets
In July, the U.S. Dollar Index (DXY) climbed approximately +3.0% — marking its first monthly gain of 2025 — as resilient U.S. economic data and reduced Fed-cut expectations strengthened the greenback. EUR/USD fell roughly –3.0%, pressured by softer Euro-area data and a comparatively dovish ECB. GBP/USD slid –3.7%, weighed down by UK fiscal concerns and broad dollar strength.
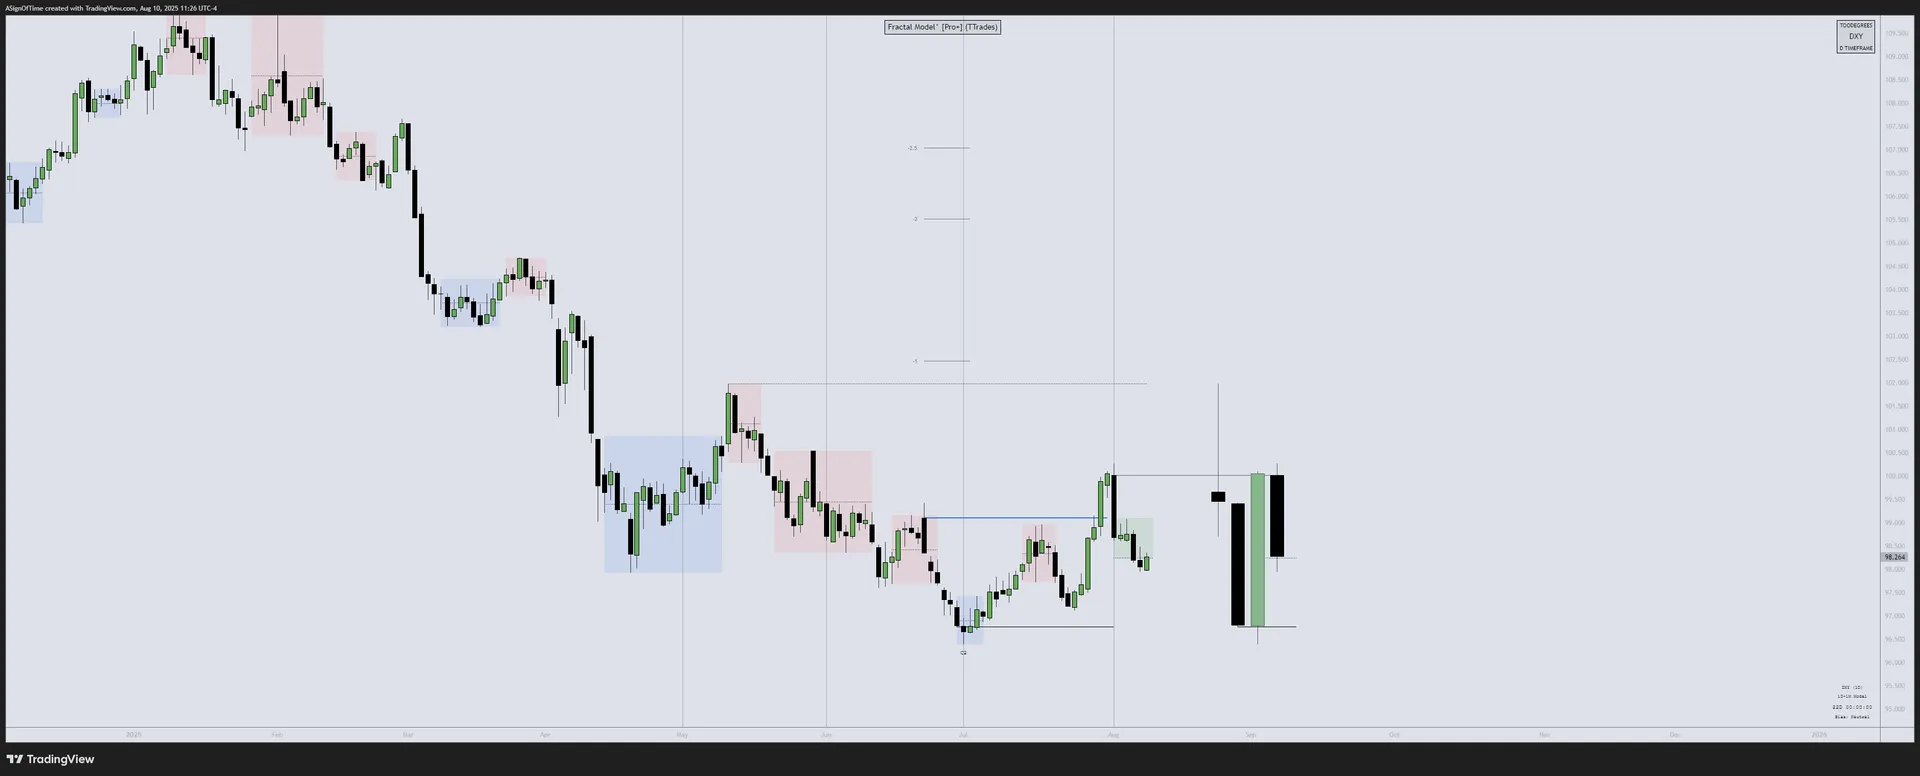
DXY Monthly Recap
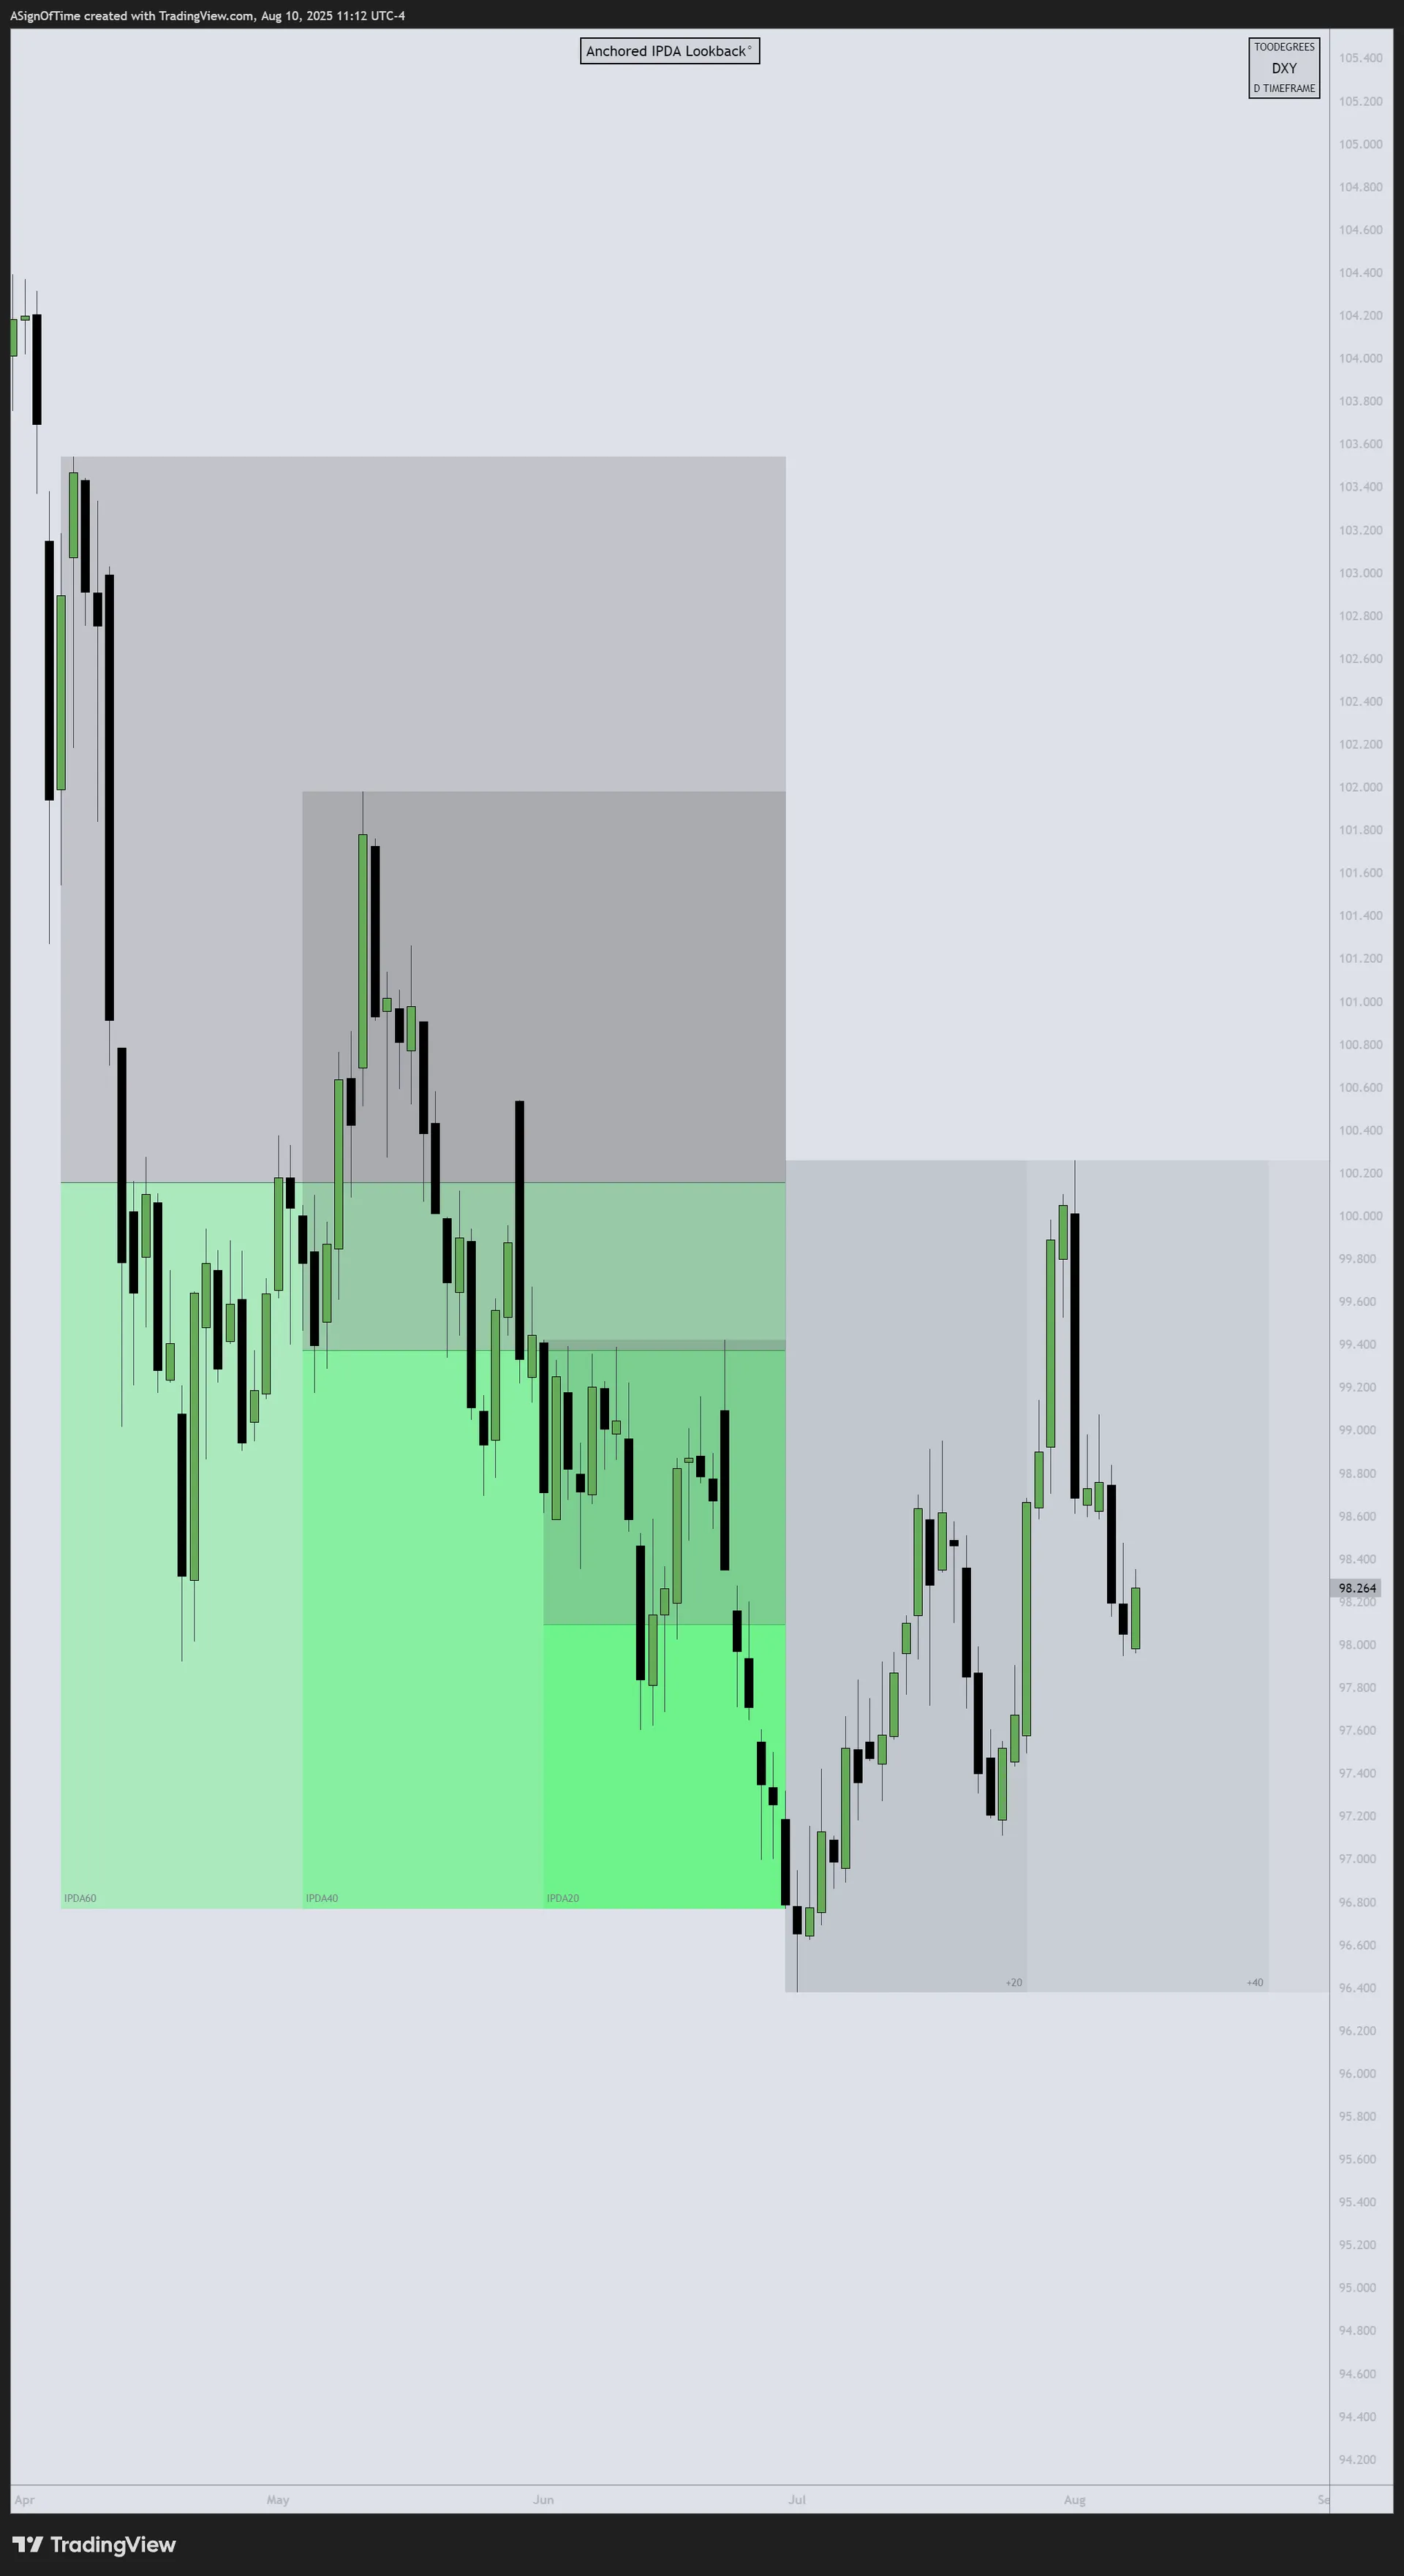
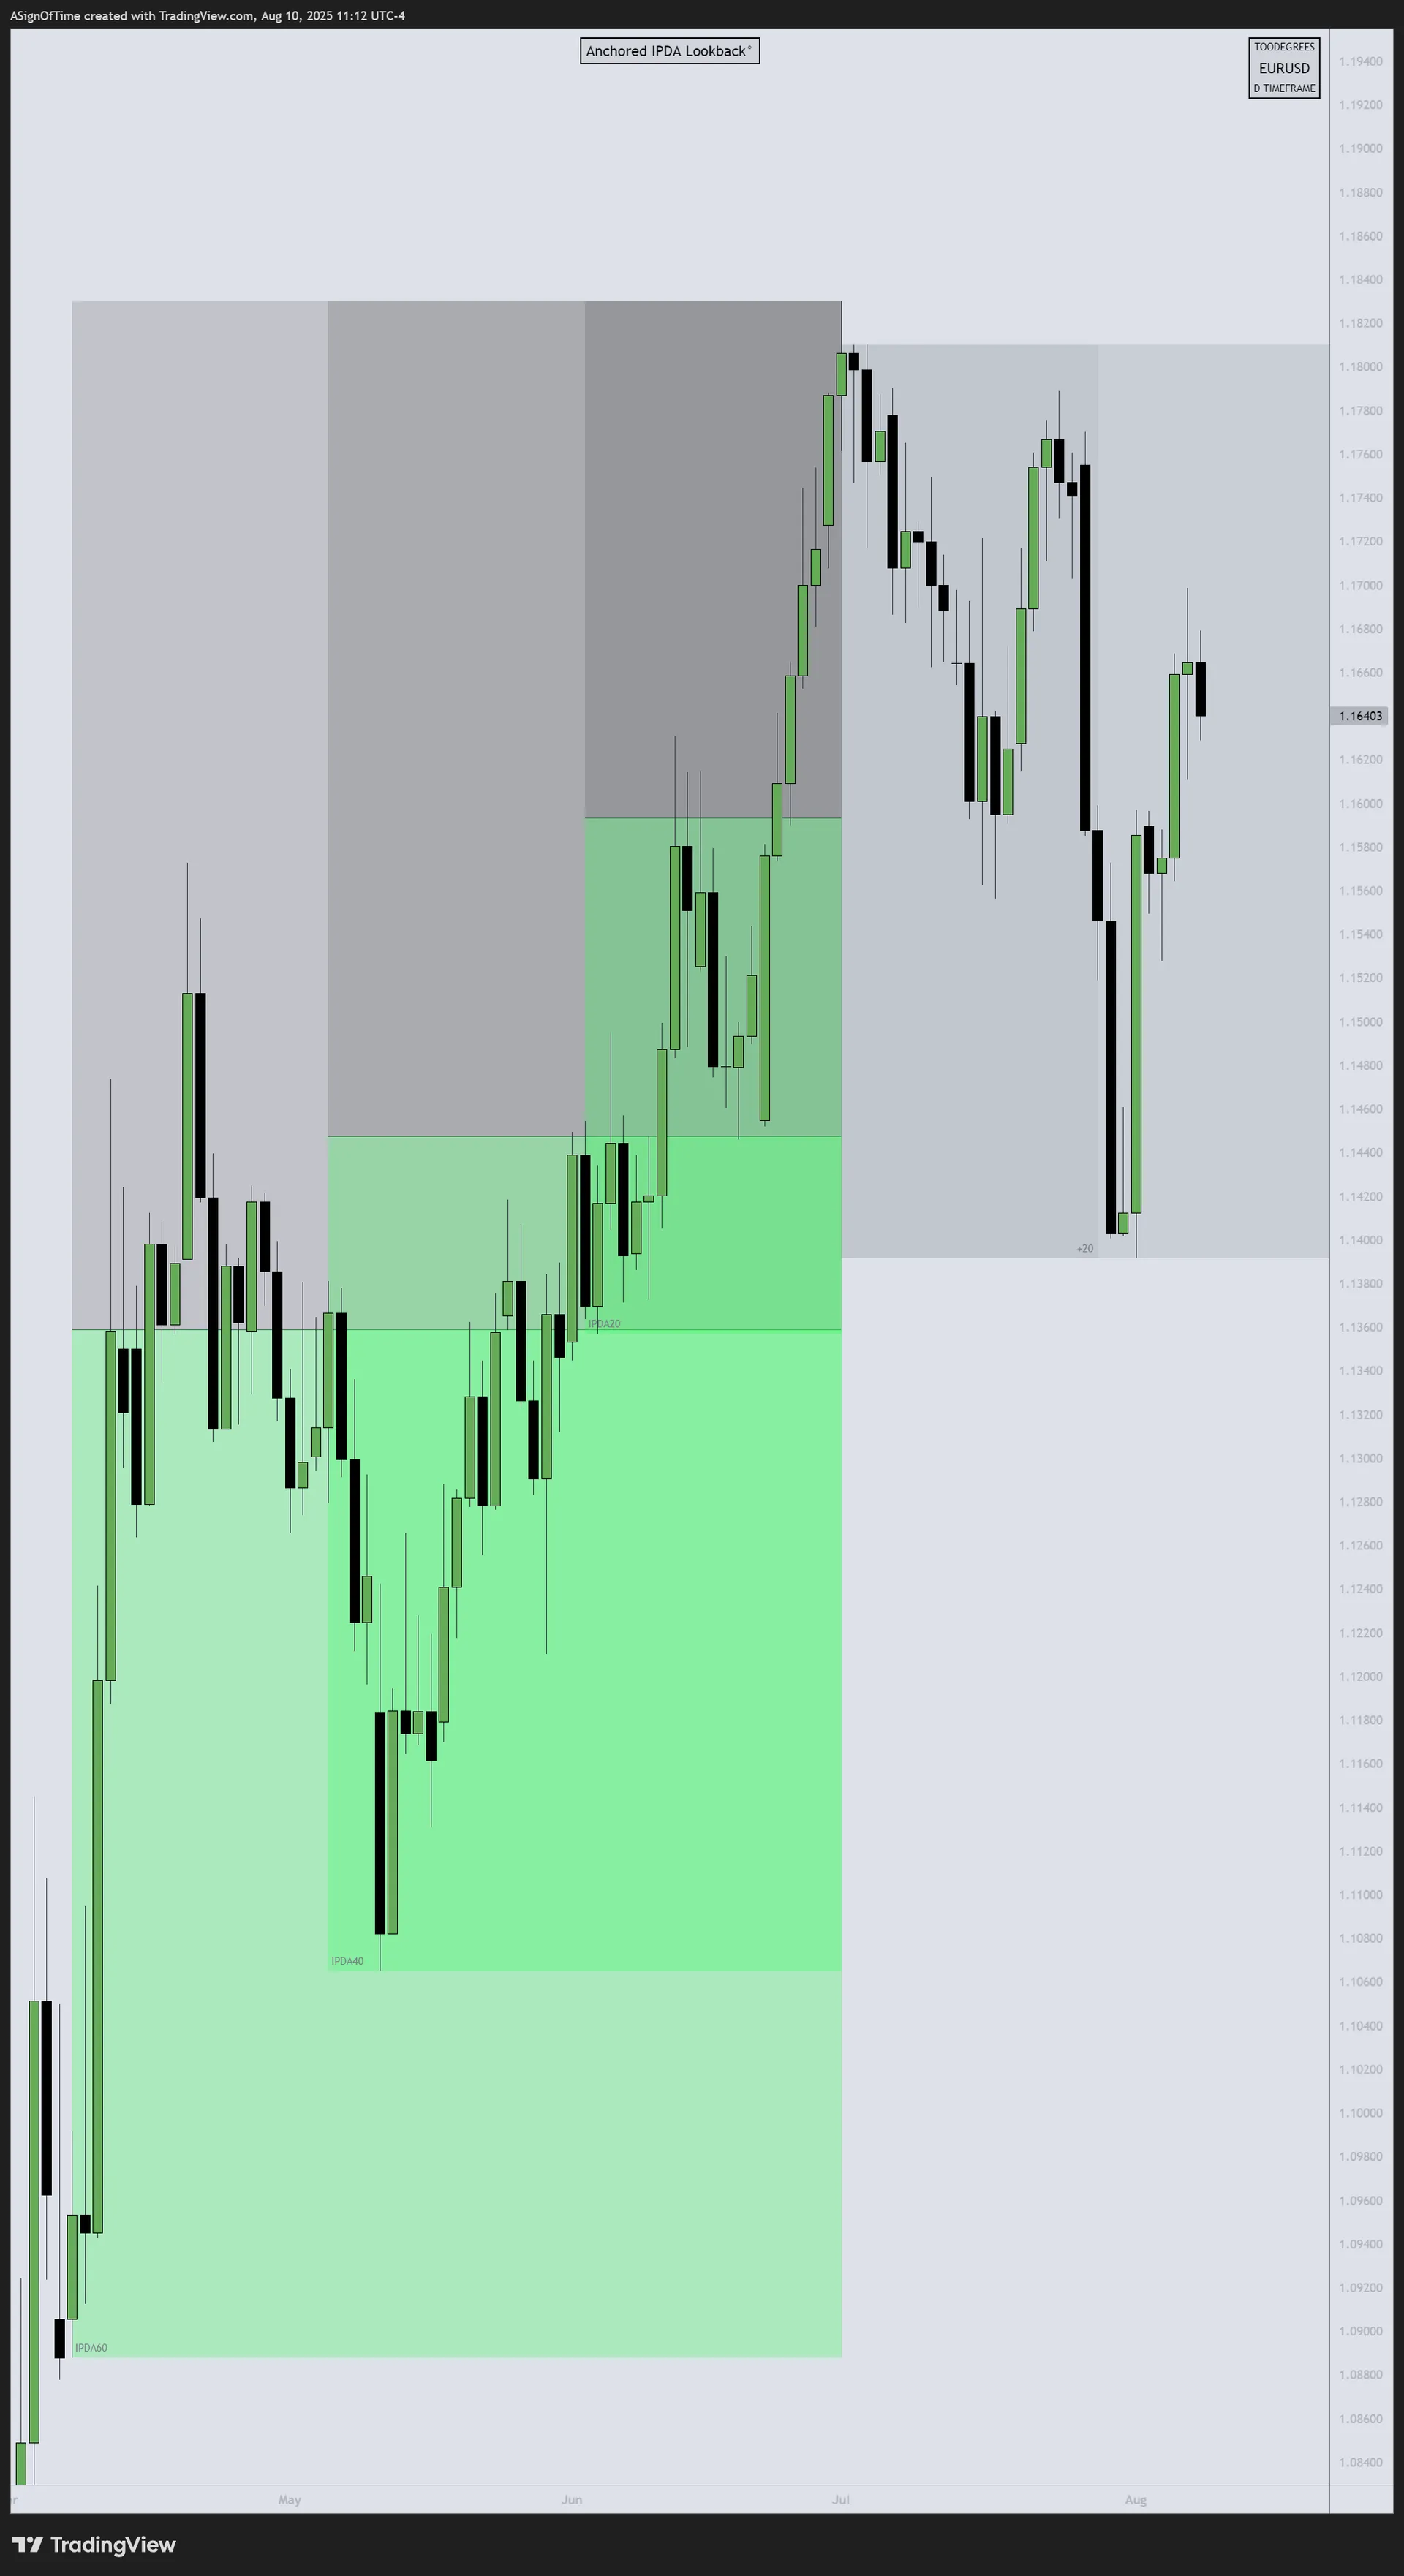
Multi-Asset Currency IPDA — July Anchored
IPDA Lookback anchored at the start of July — measuring Relative Strength across DXY, EUR/USD, and GBP/USD.
[US Dollar Index]
[EUR/USD]
[GBP/USD]
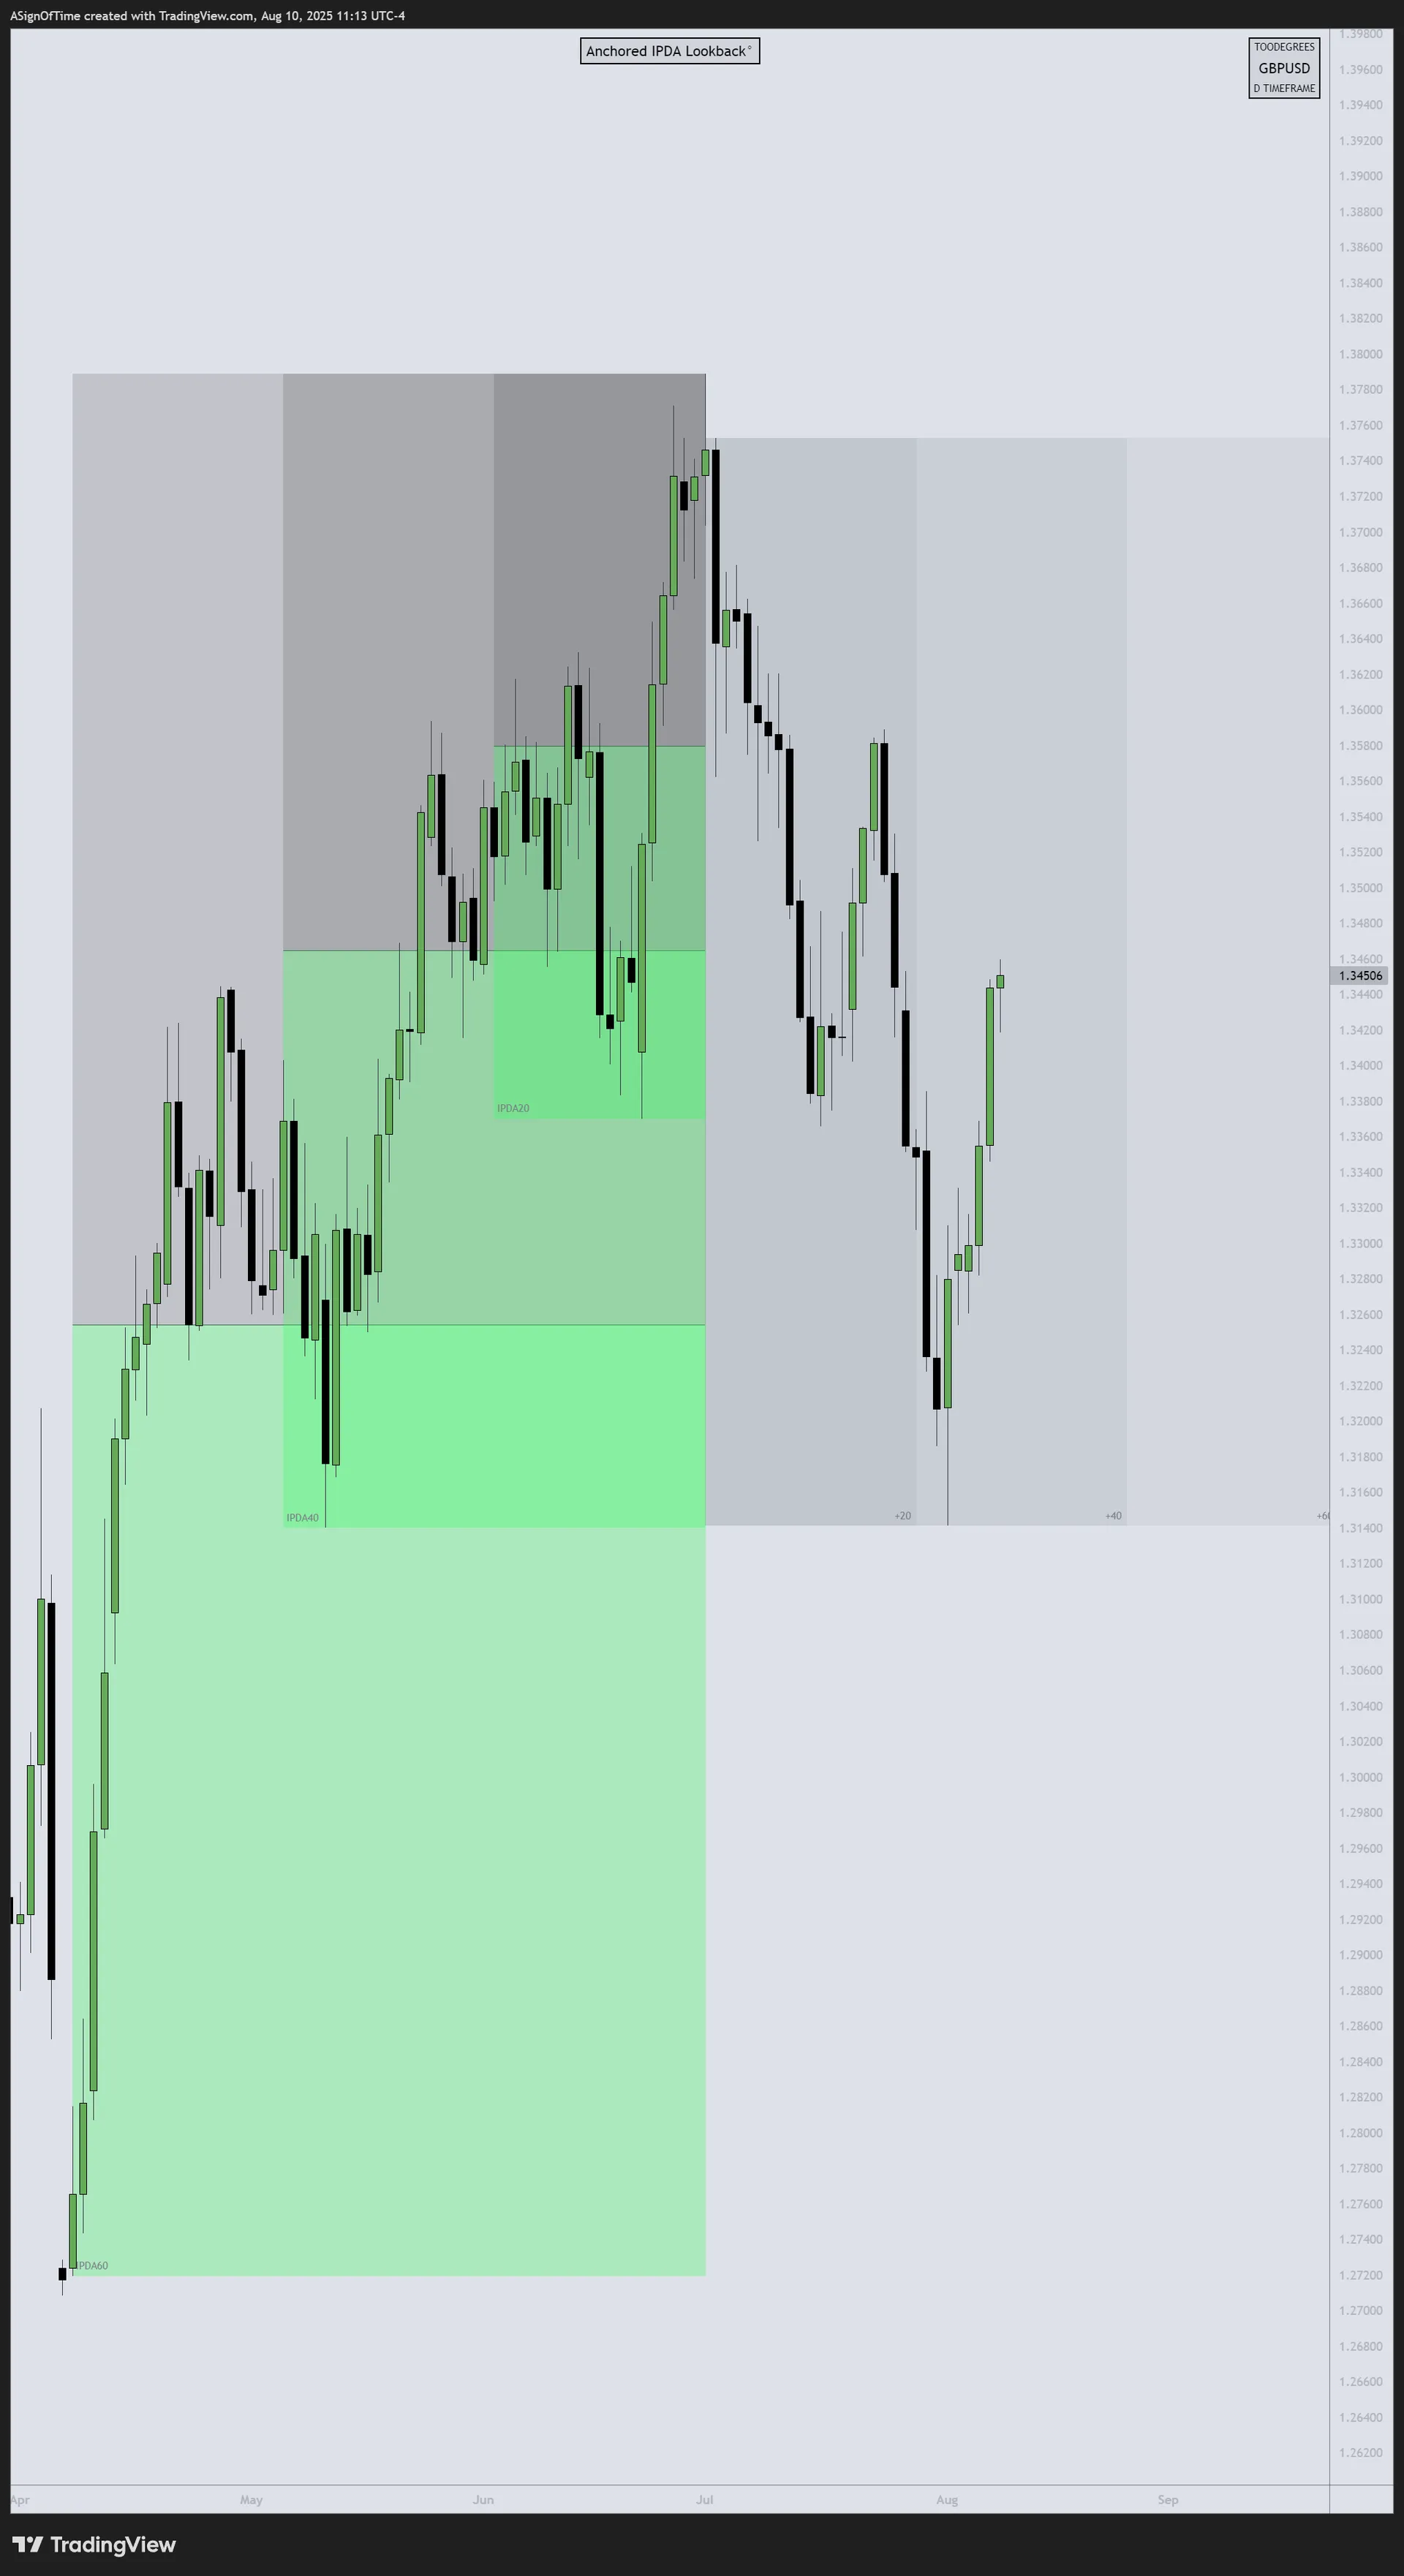
Analyst Insight
A clear SMT divergence formed between DXY, EUR/USD, and GBP/USD — providing early confluence for the July reversal. DXY reclaimed ground while EUR and GBP failed to extend their recent highs. Despite Open Interest trending lower during the DXY rally, the move was largely fueled by short-covering rather than broad speculative inflows, which may limit the sustainability of the bounce.
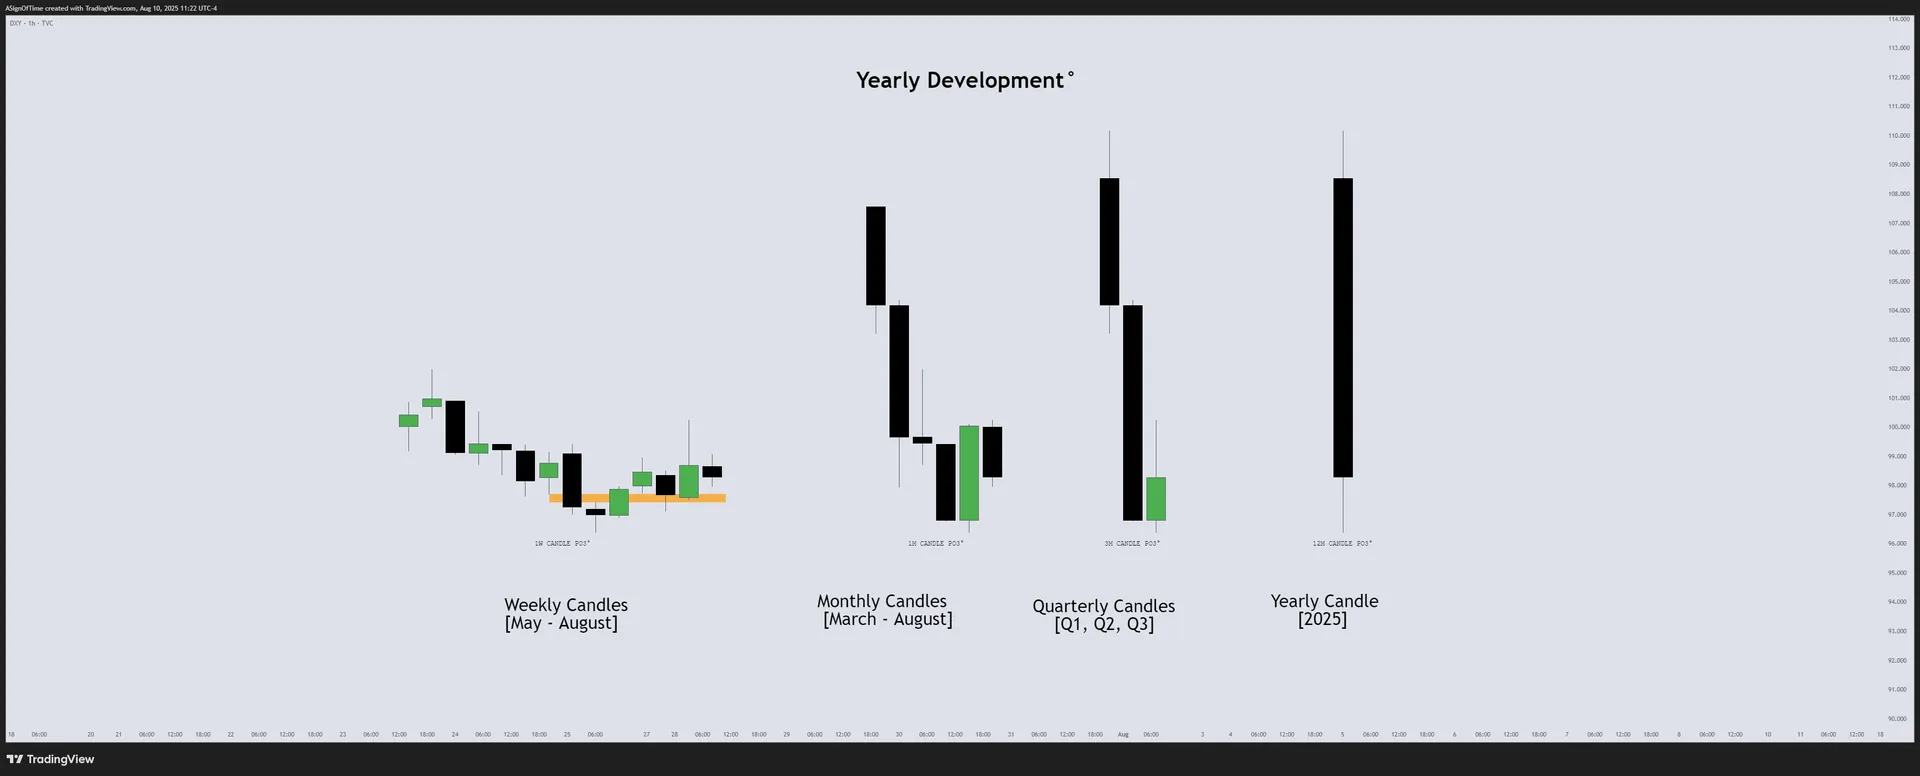
DXY — OHLC Statistical Mapping (StatMap)
DXY Seasonality Analysis
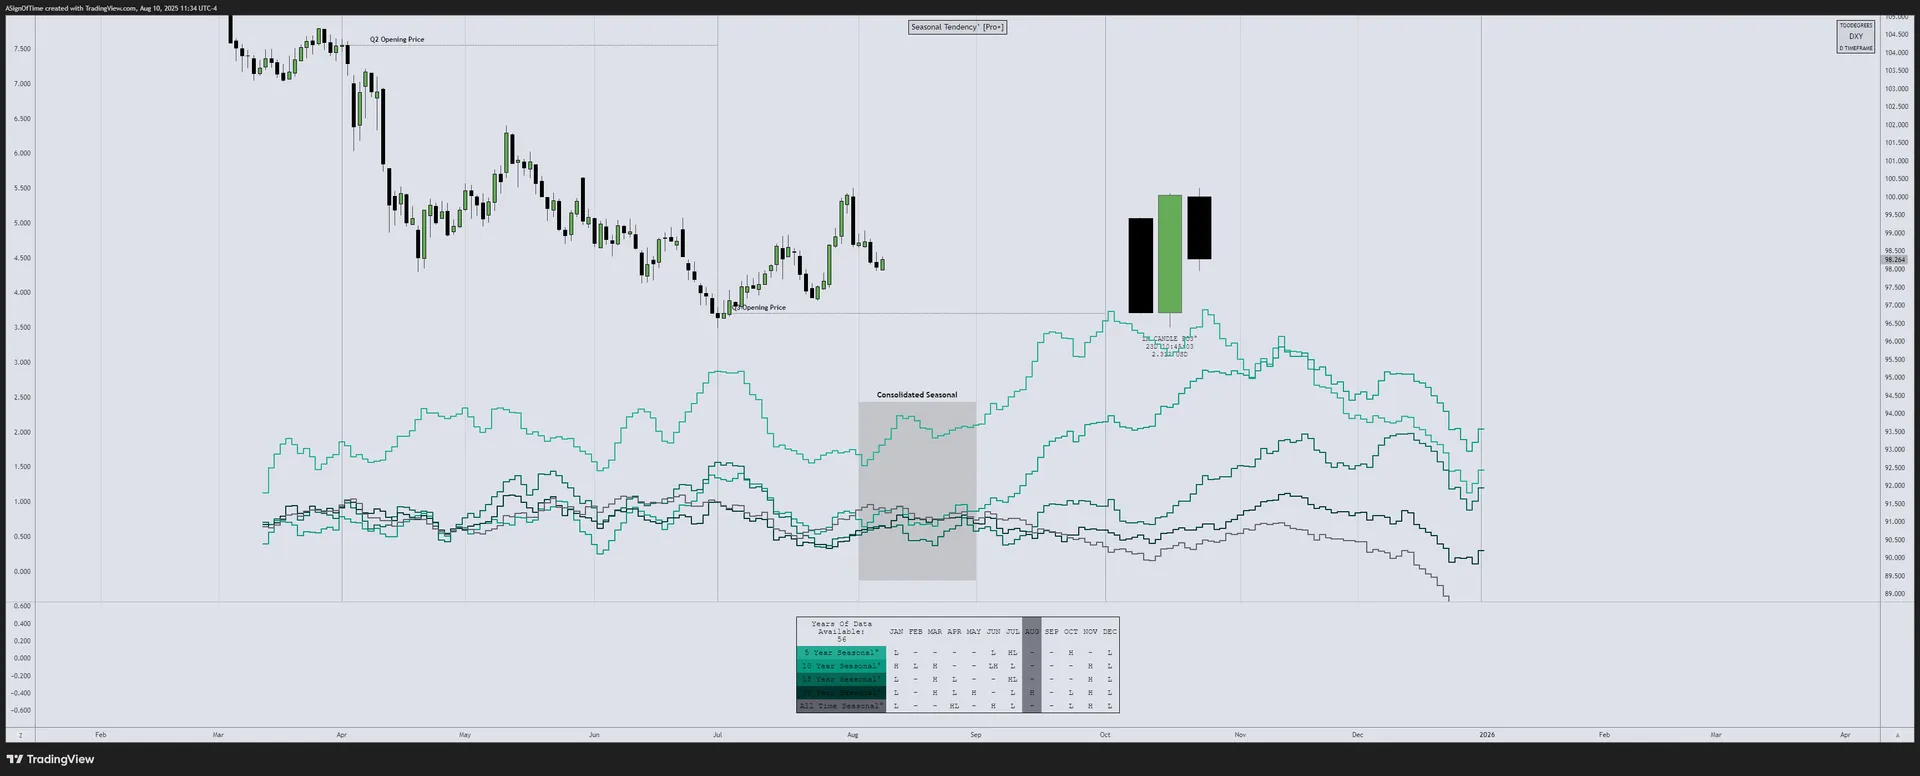
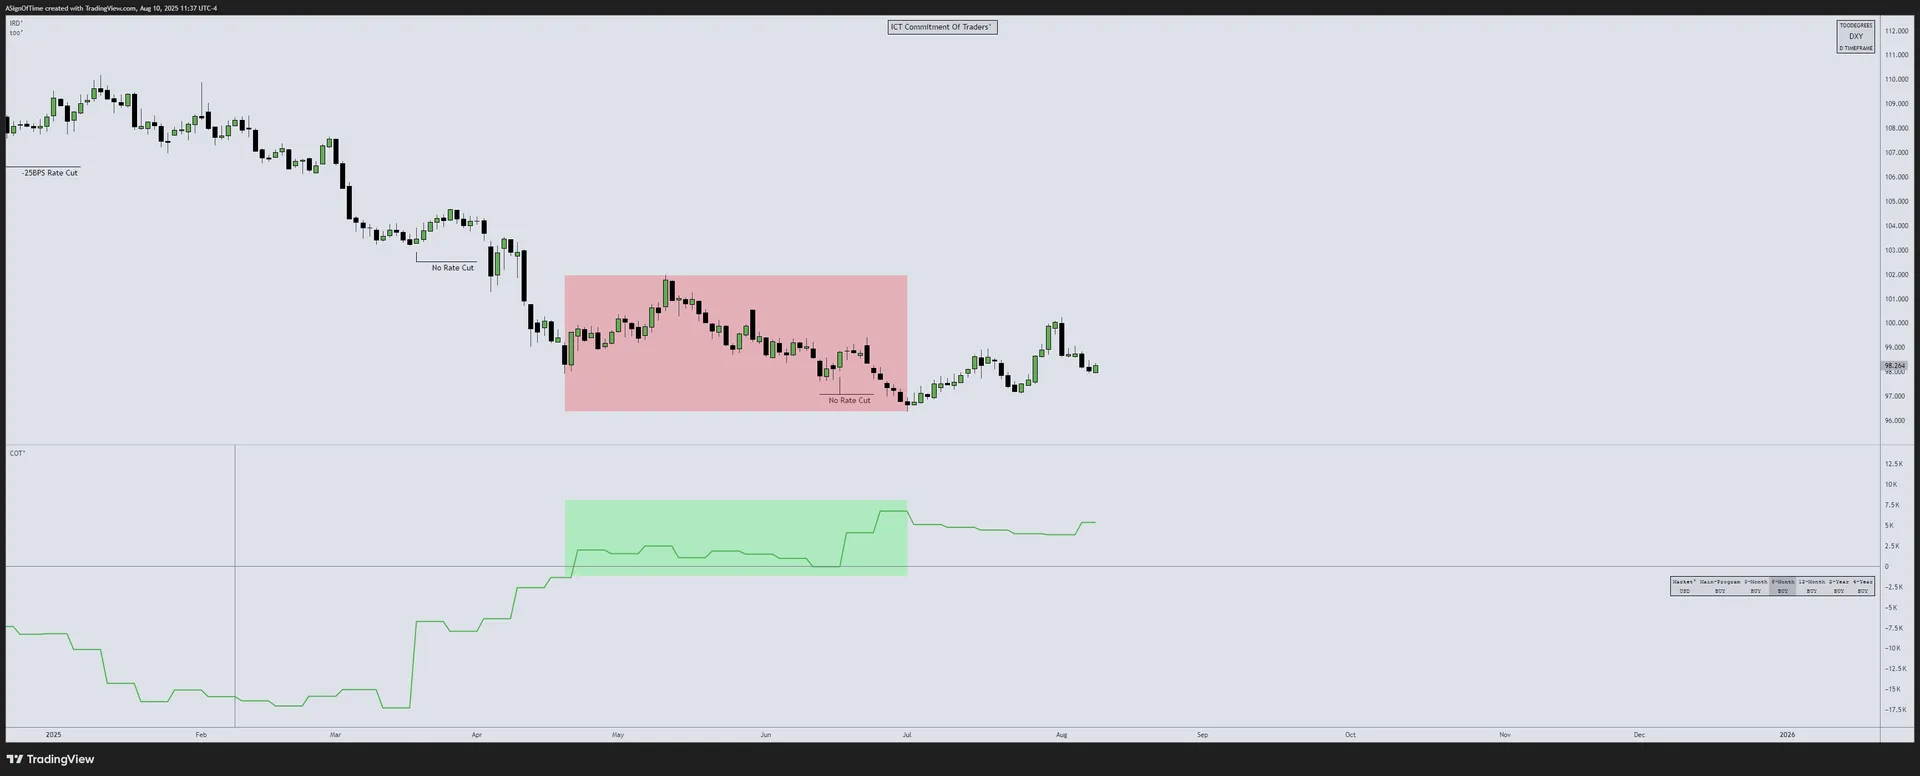
DXY Commitment of Traders
COT data shows commercials building net long exposure in DXY while speculative traders reduced positions — highlighting an institutional bid even as seasonals remain consolidated with limited directional bias.
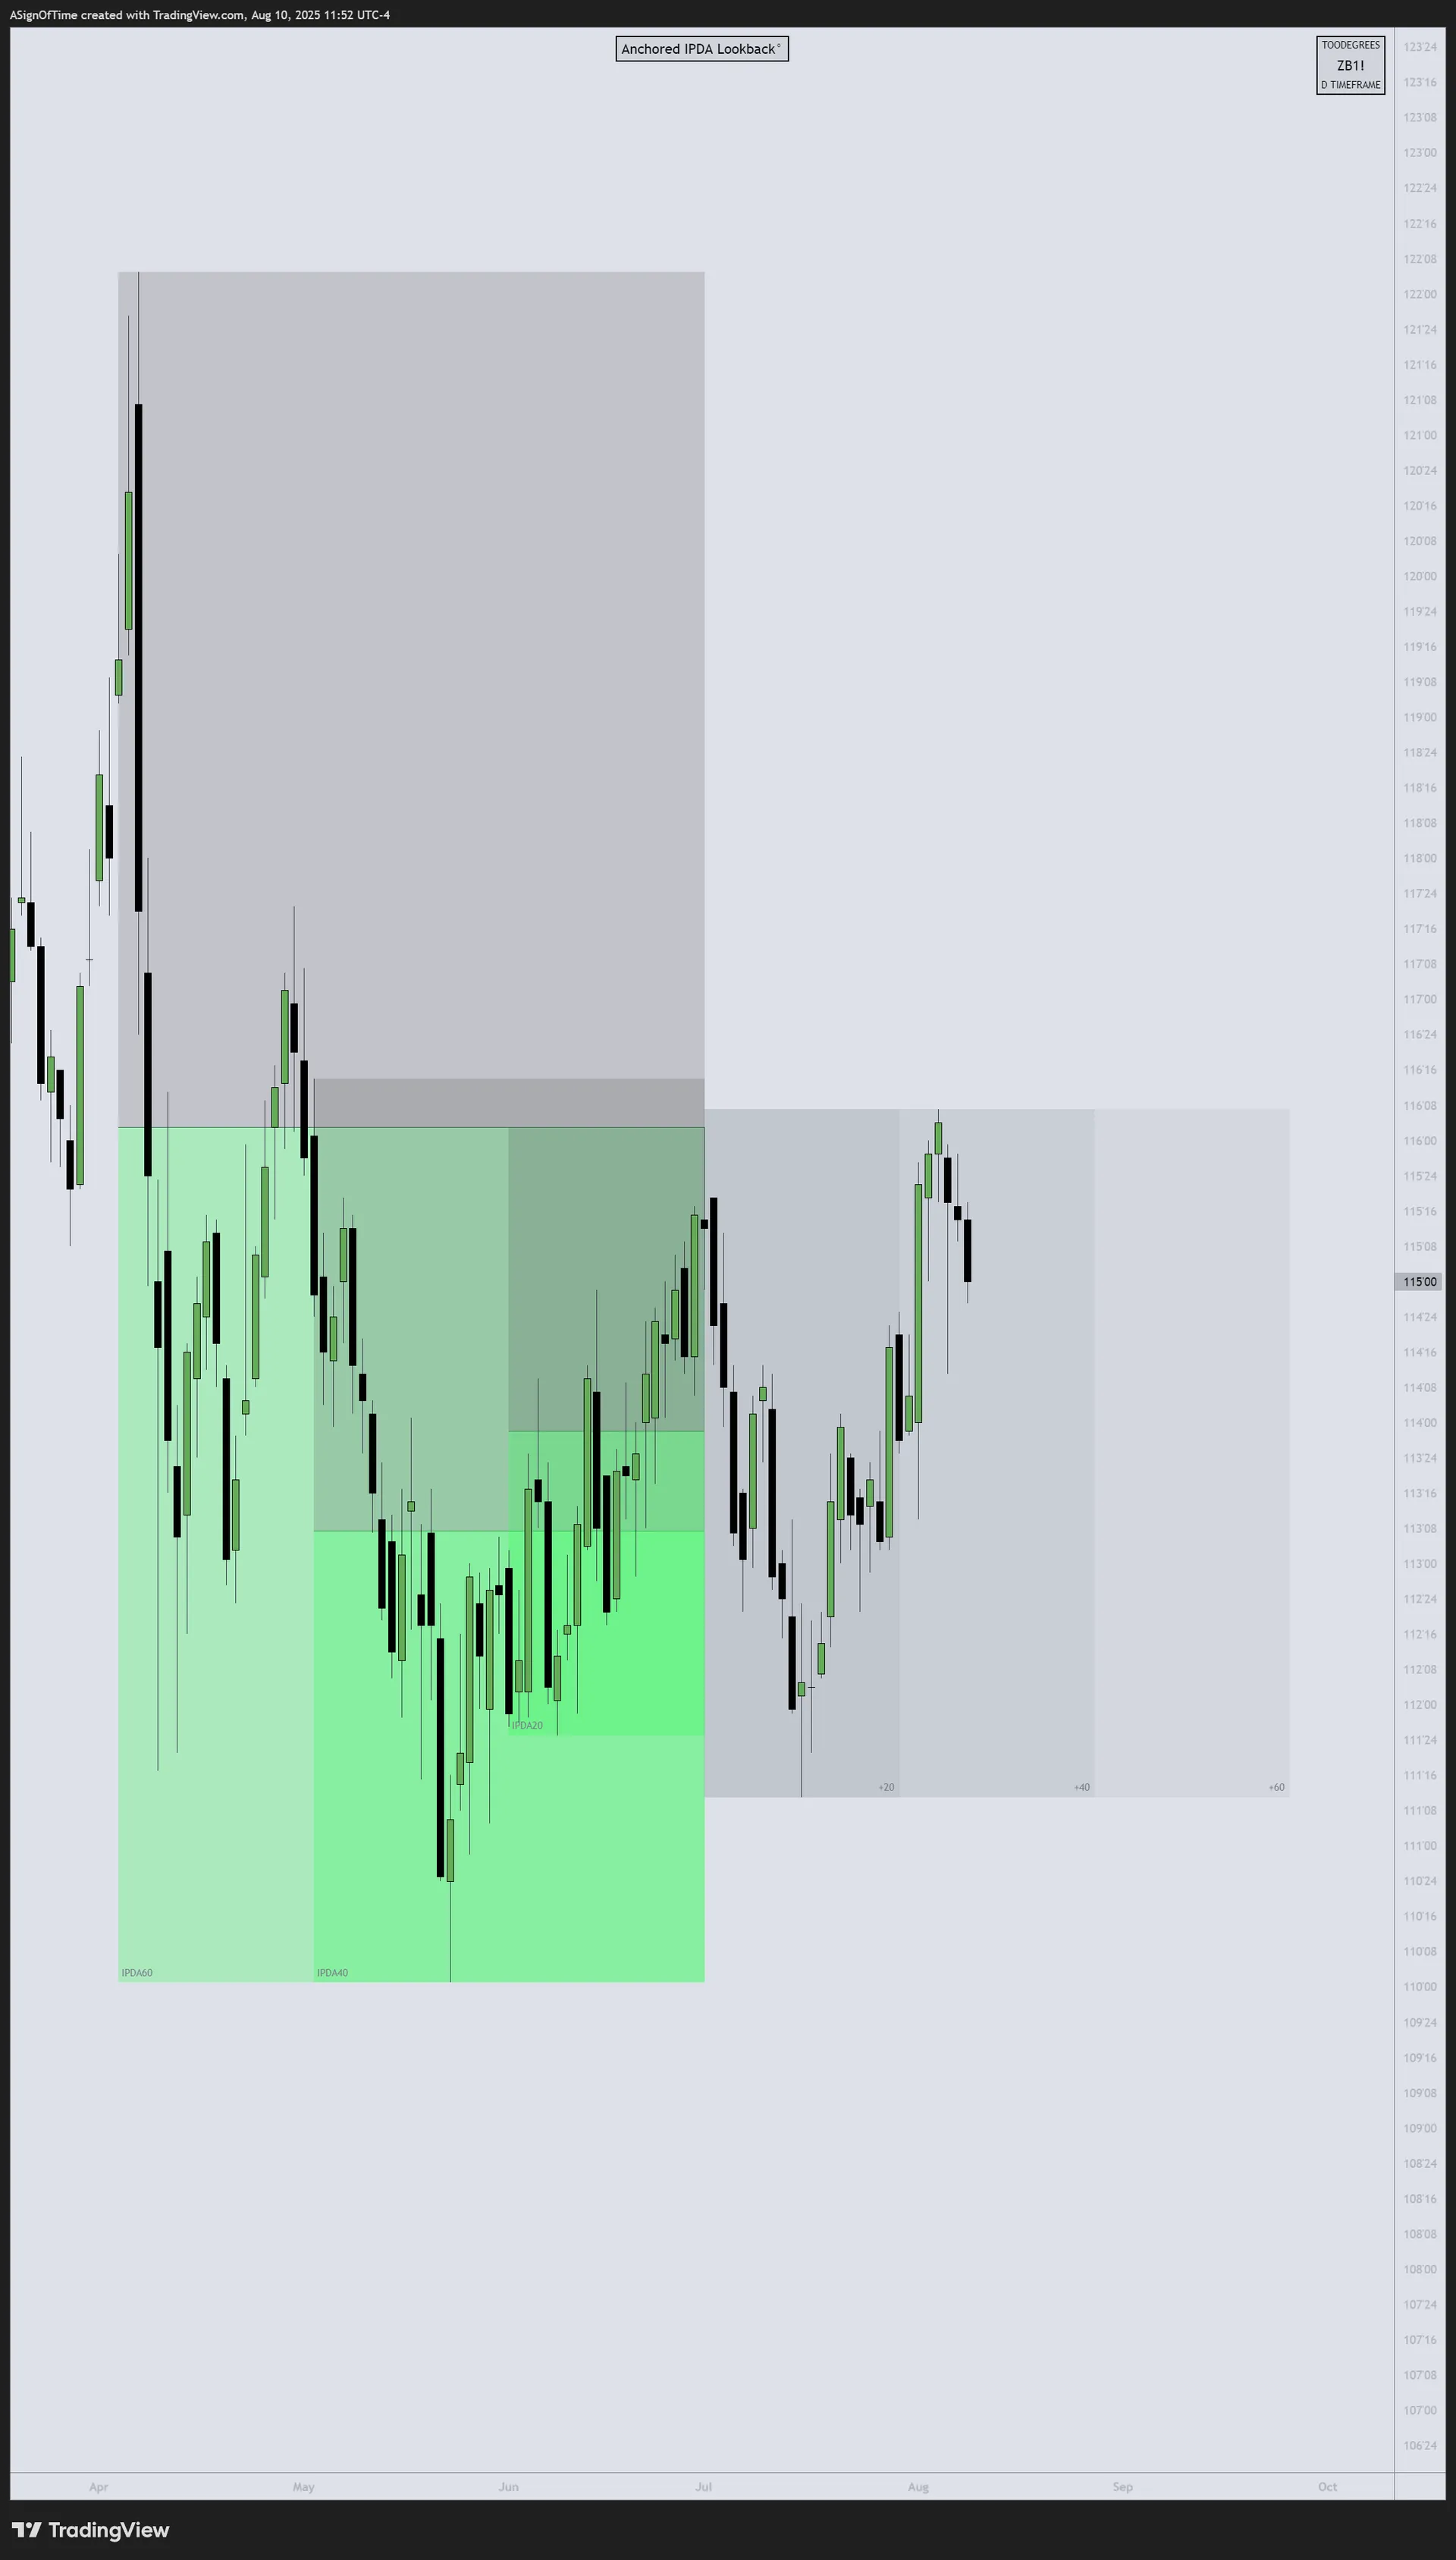
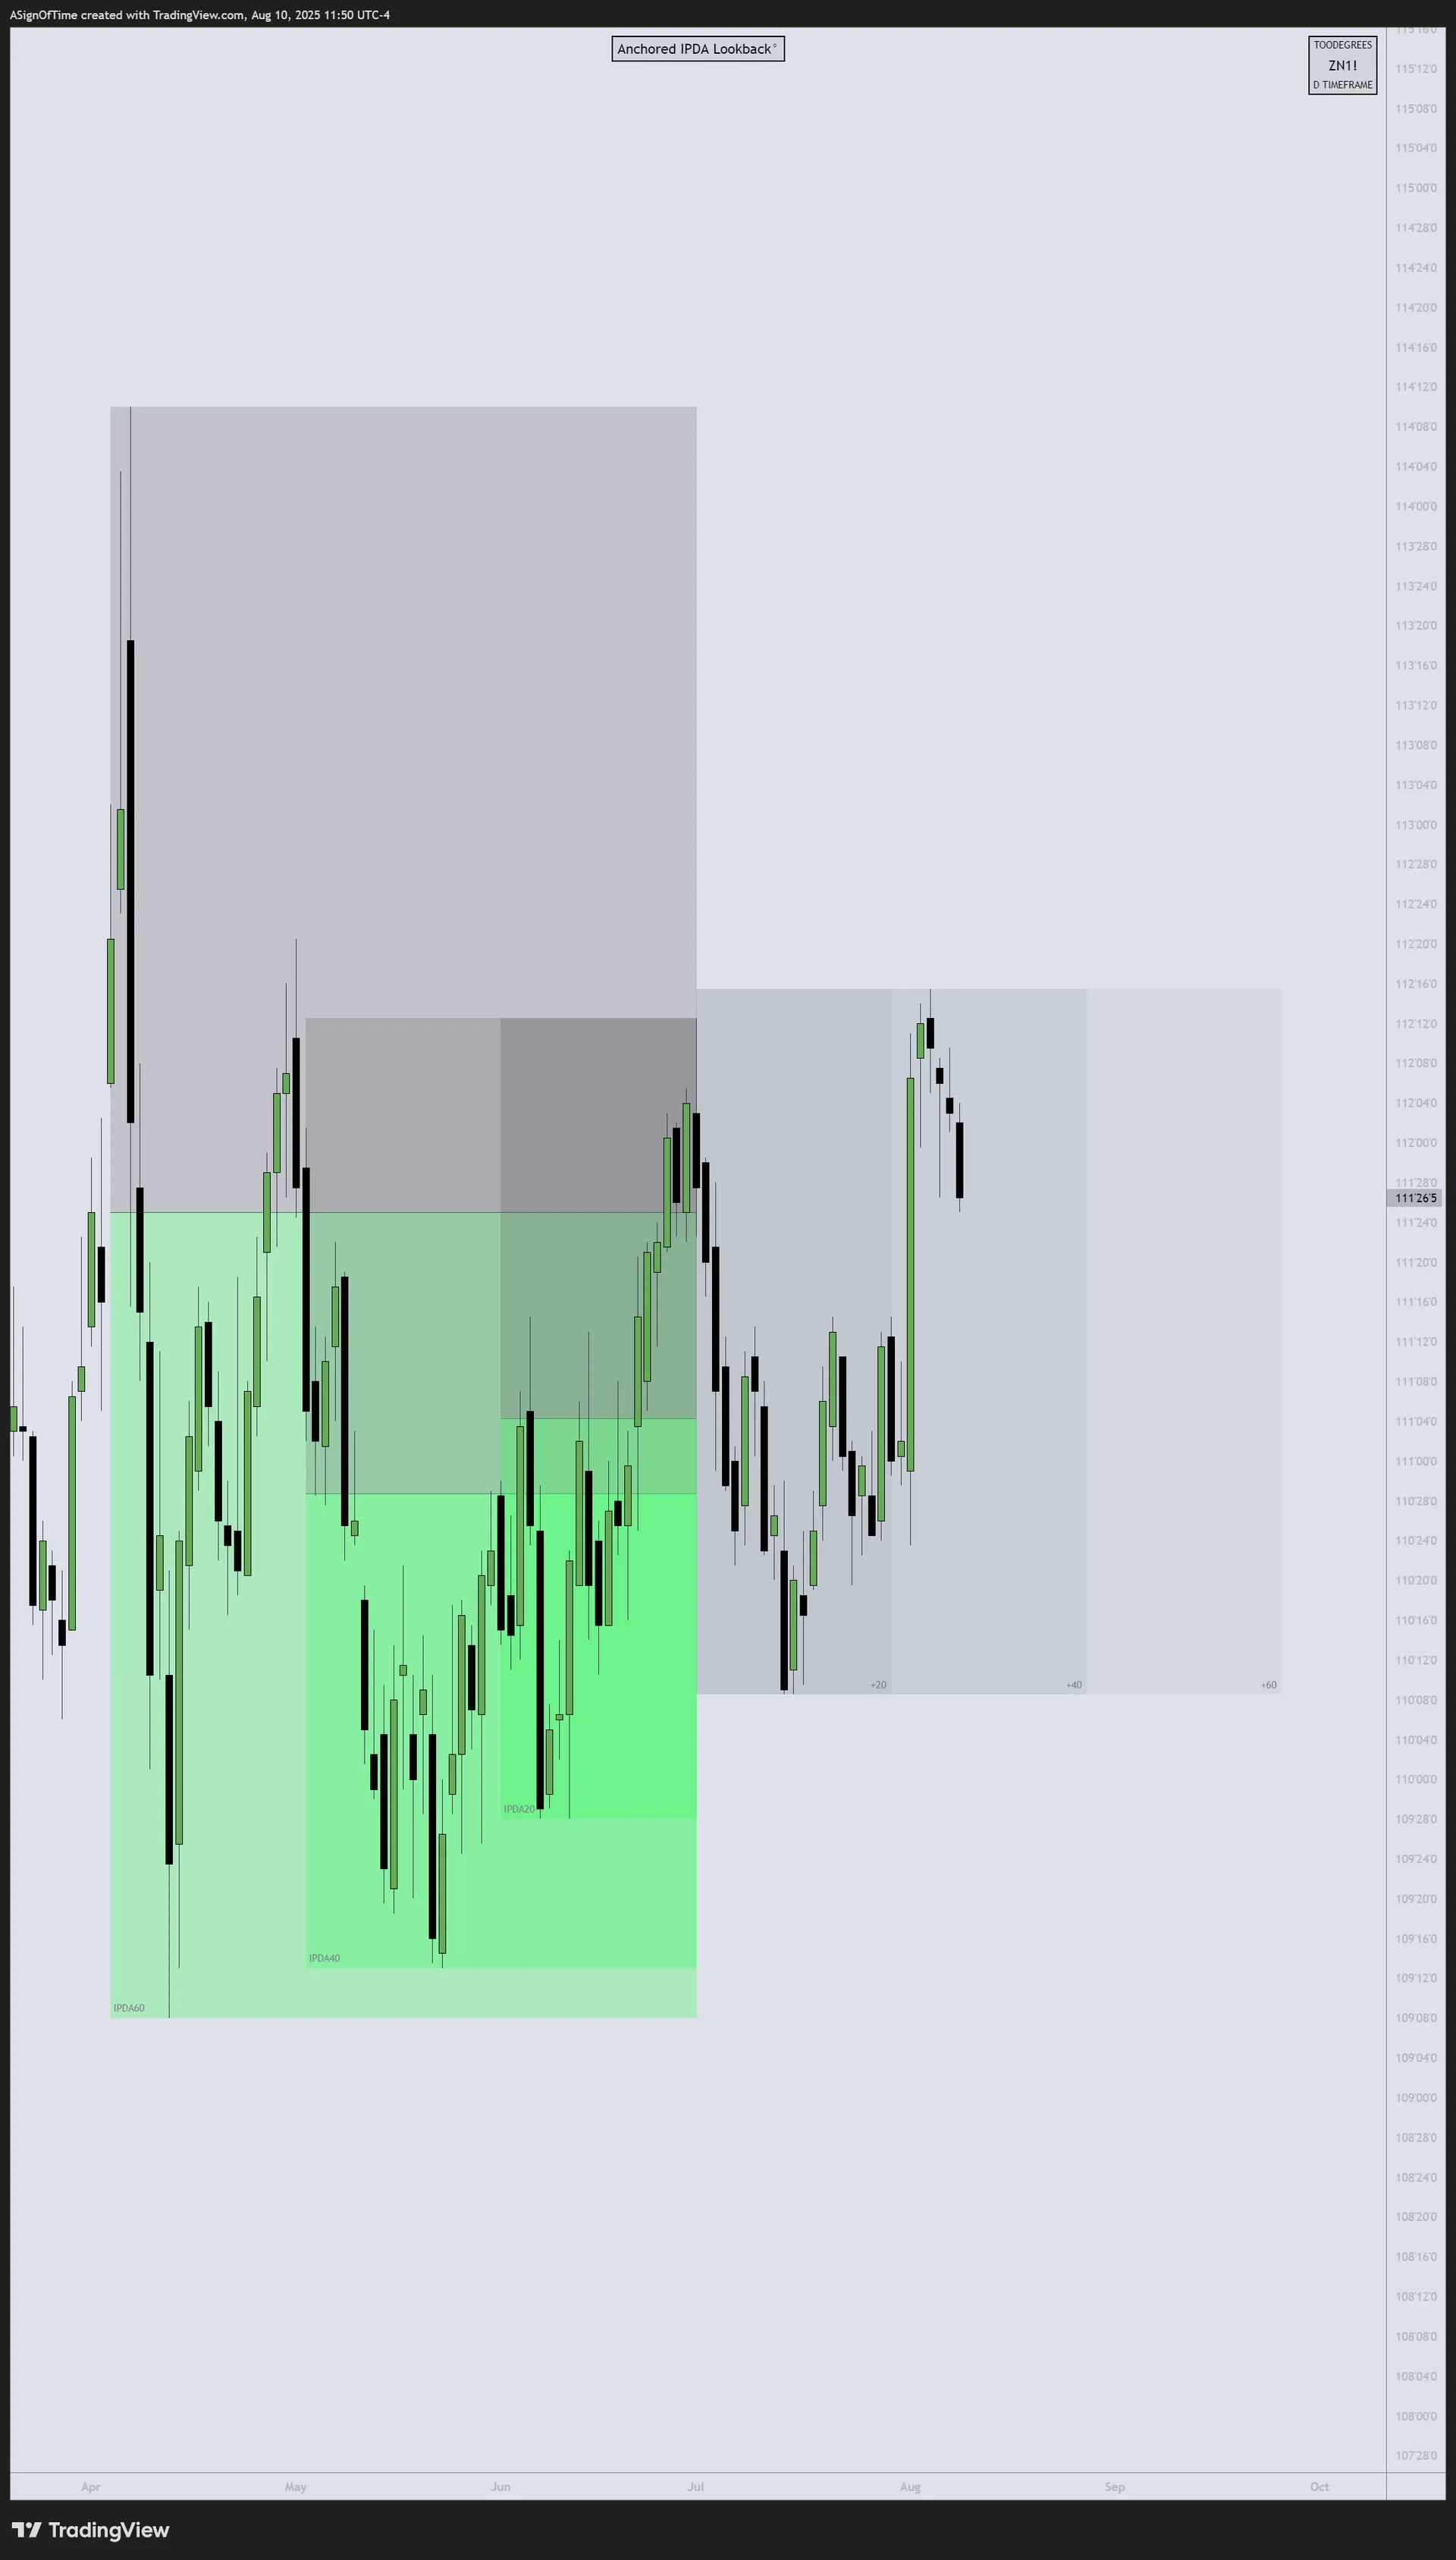
Multi-Asset Bond Futures — July Anchored
U.S. Treasury futures showed mixed performance in July. IPDA Lookback anchored at July 1st across ZB (30-Year T-Bond), ZN (10-Year T-Note), and ZF (5-Year T-Note).
[30-YEAR T-BOND $ZB]
[10-YEAR T-NOTE $ZN]
[5-YEAR T-NOTE $ZF]
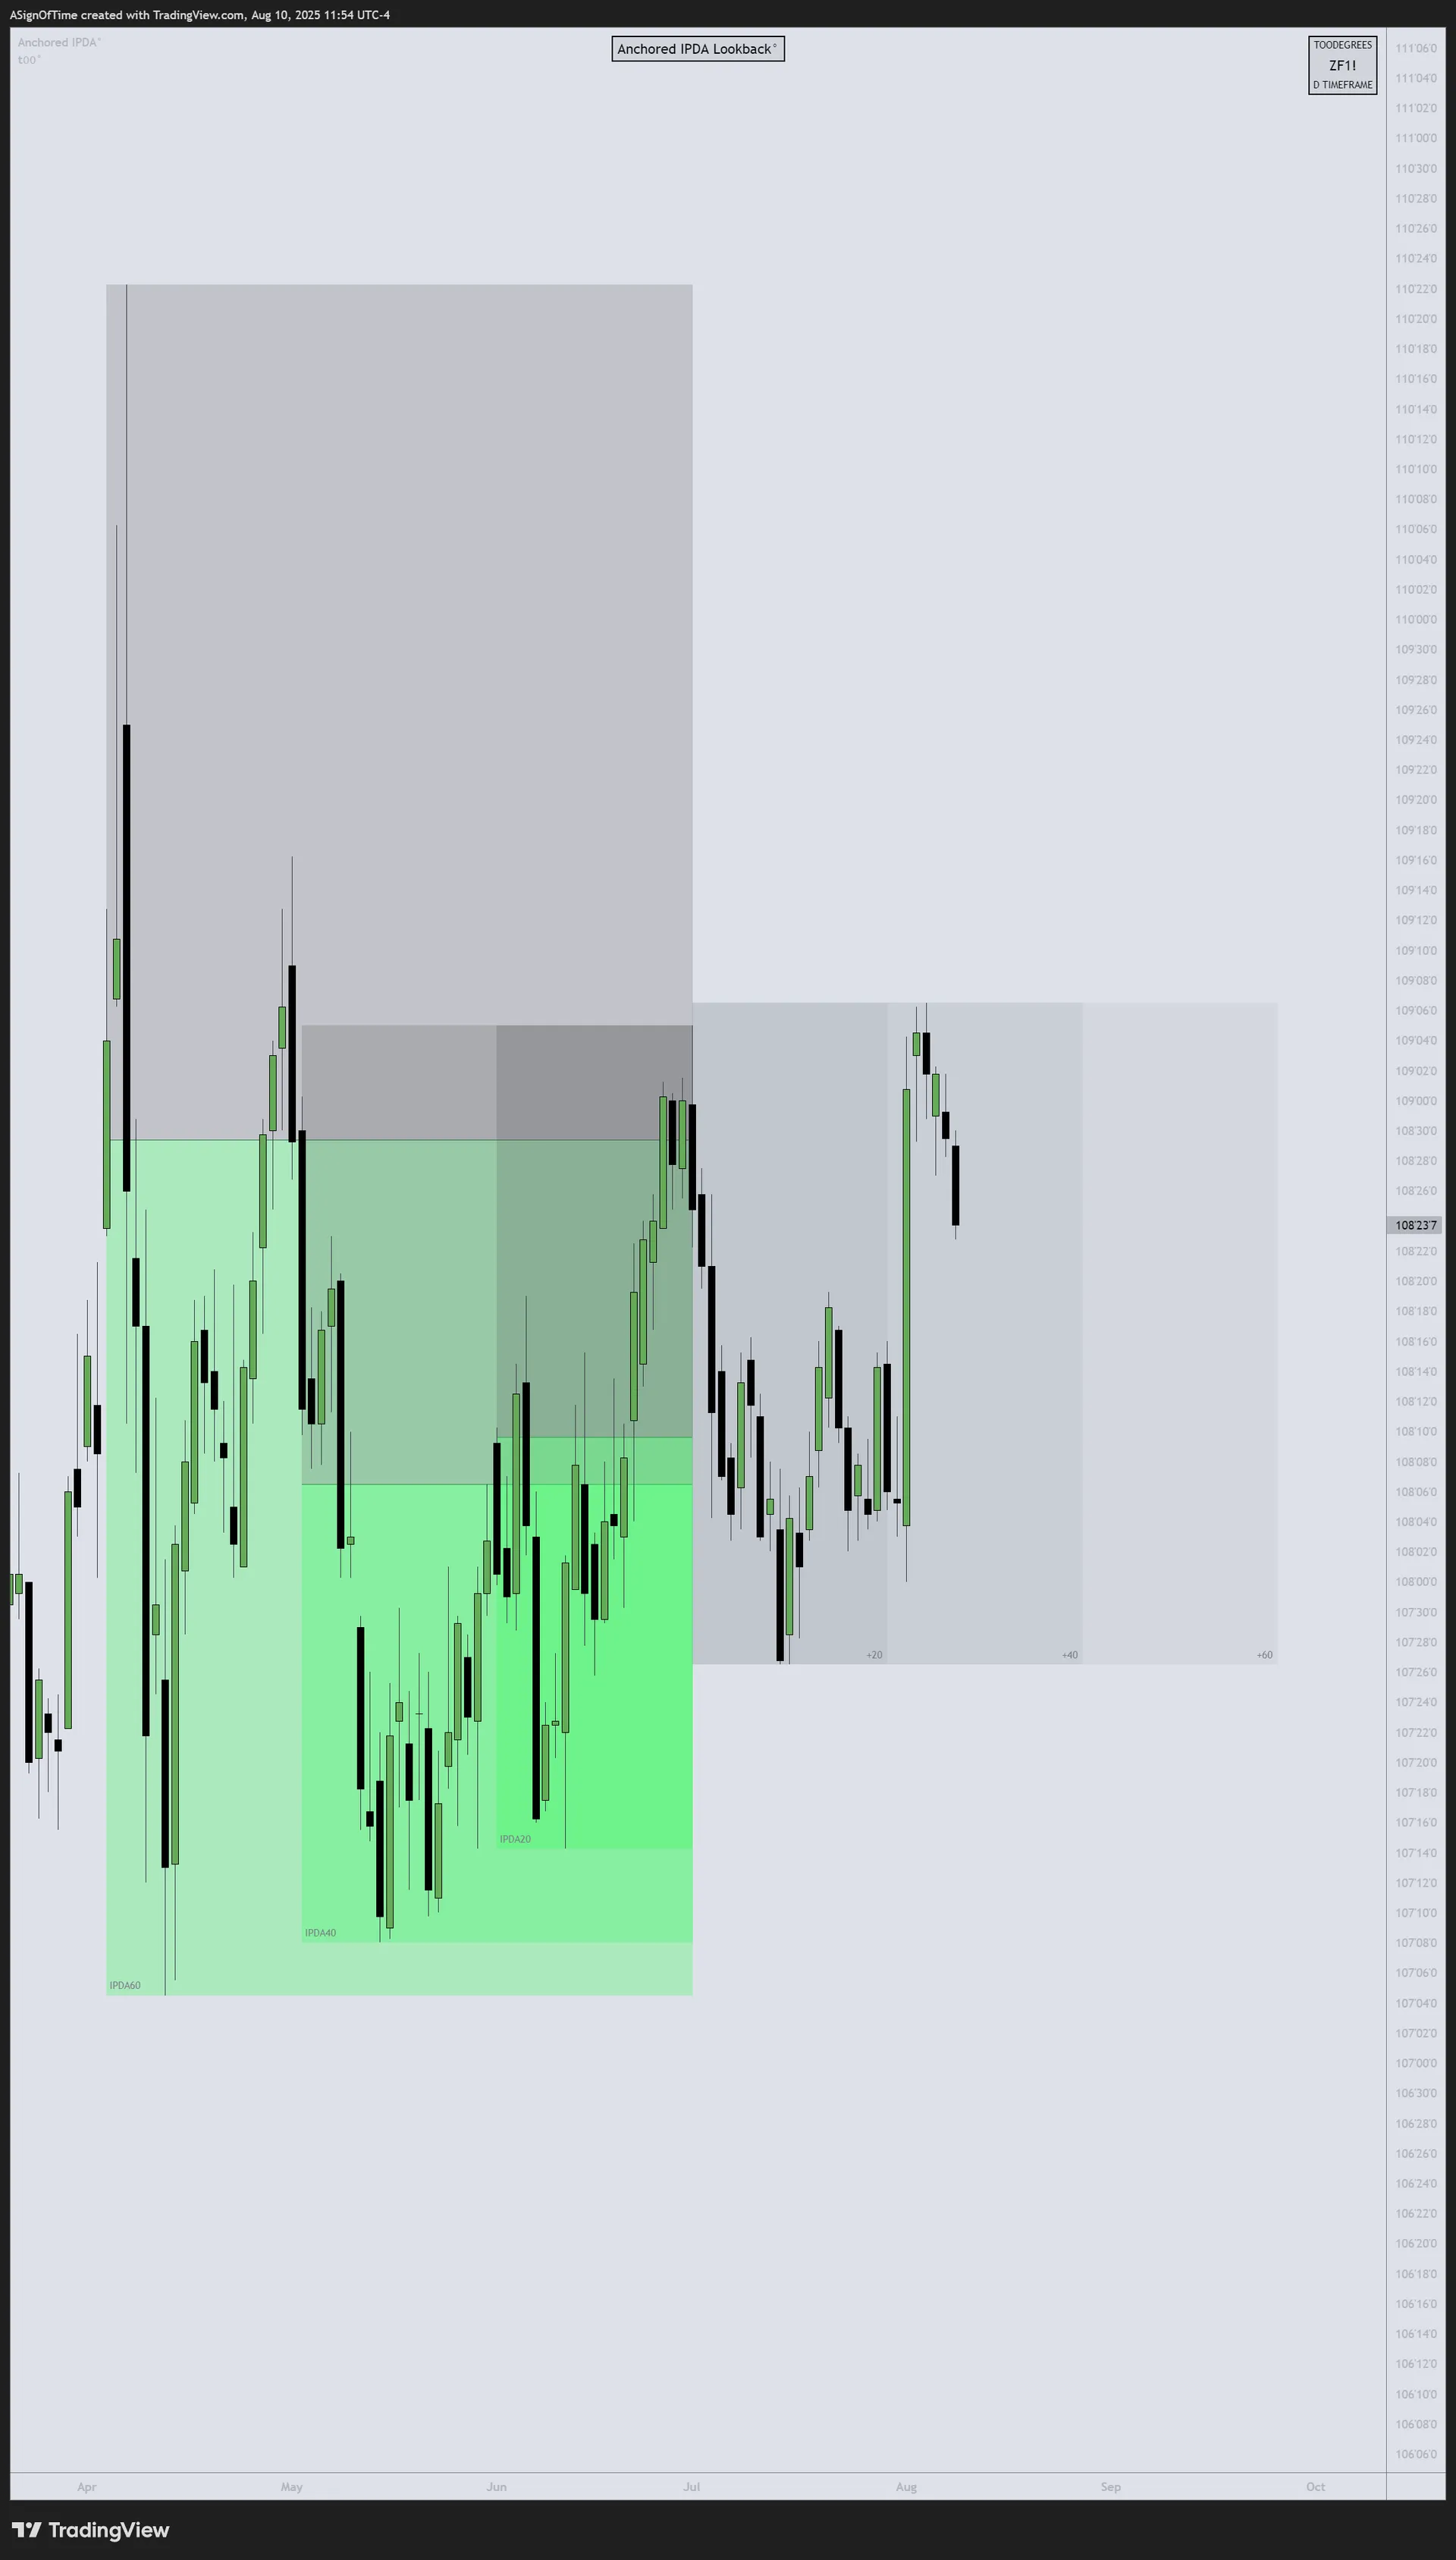
Analyst Insight
ZF (5-year) and ZN (10-year) largely respected their July-anchored IPDA 60-day ranges, showing limited directional expansion but maintaining stability. ZB (30-year) continues to lag, failing to sustain rallies beyond key range levels — underscoring cautious institutional stance toward longer duration amid inflation persistence and fiscal supply pressures.
Yield Curve — US Treasuries
In early August 2025, short-term rates (2-year) at 4.12%, mid-term (10-year) at 4.42%, and long-term (30-year) at 4.78%. The curve remains upward-sloping but the gap between short- and long-term yields has narrowed, reflecting growing expectations for Fed rate cuts. The reduced inversion hints at a potential turn in monetary policy, yet caution persists as investors balance slower growth risks against inflation persistence.
Inter-Market Dynamics Summary
| Metric | NQ | DXY | T-Bonds |
|---|---|---|---|
| Orderflow | Bullish → Bullish | Bearish → Bullish | Bearish → Sideways |
| Seasonality | Bullish → Neutral | Sideways → Sideways | Sideways → Sideways |
| Open Interest | Declining | Declining | Mixed |
| COT Report | Commercial Reducing | Net Long Building | Mixed |
| Interest Rate | — | 4.25%–4.5% | — |
Format: Previous Report → Current Report
Section 4
Additional Resources
Free TradingView Tools
Interest Rate & GDP Dashboard
by toodegrees — Free on TradingView
ICT Anchored IPDA Ranges
by toodegrees — Free on TradingView
ICT Commitment of Traders
by toodegrees — Free on TradingView
Seasonal Open Interest
by toodegrees — Free on TradingView
Community Resources
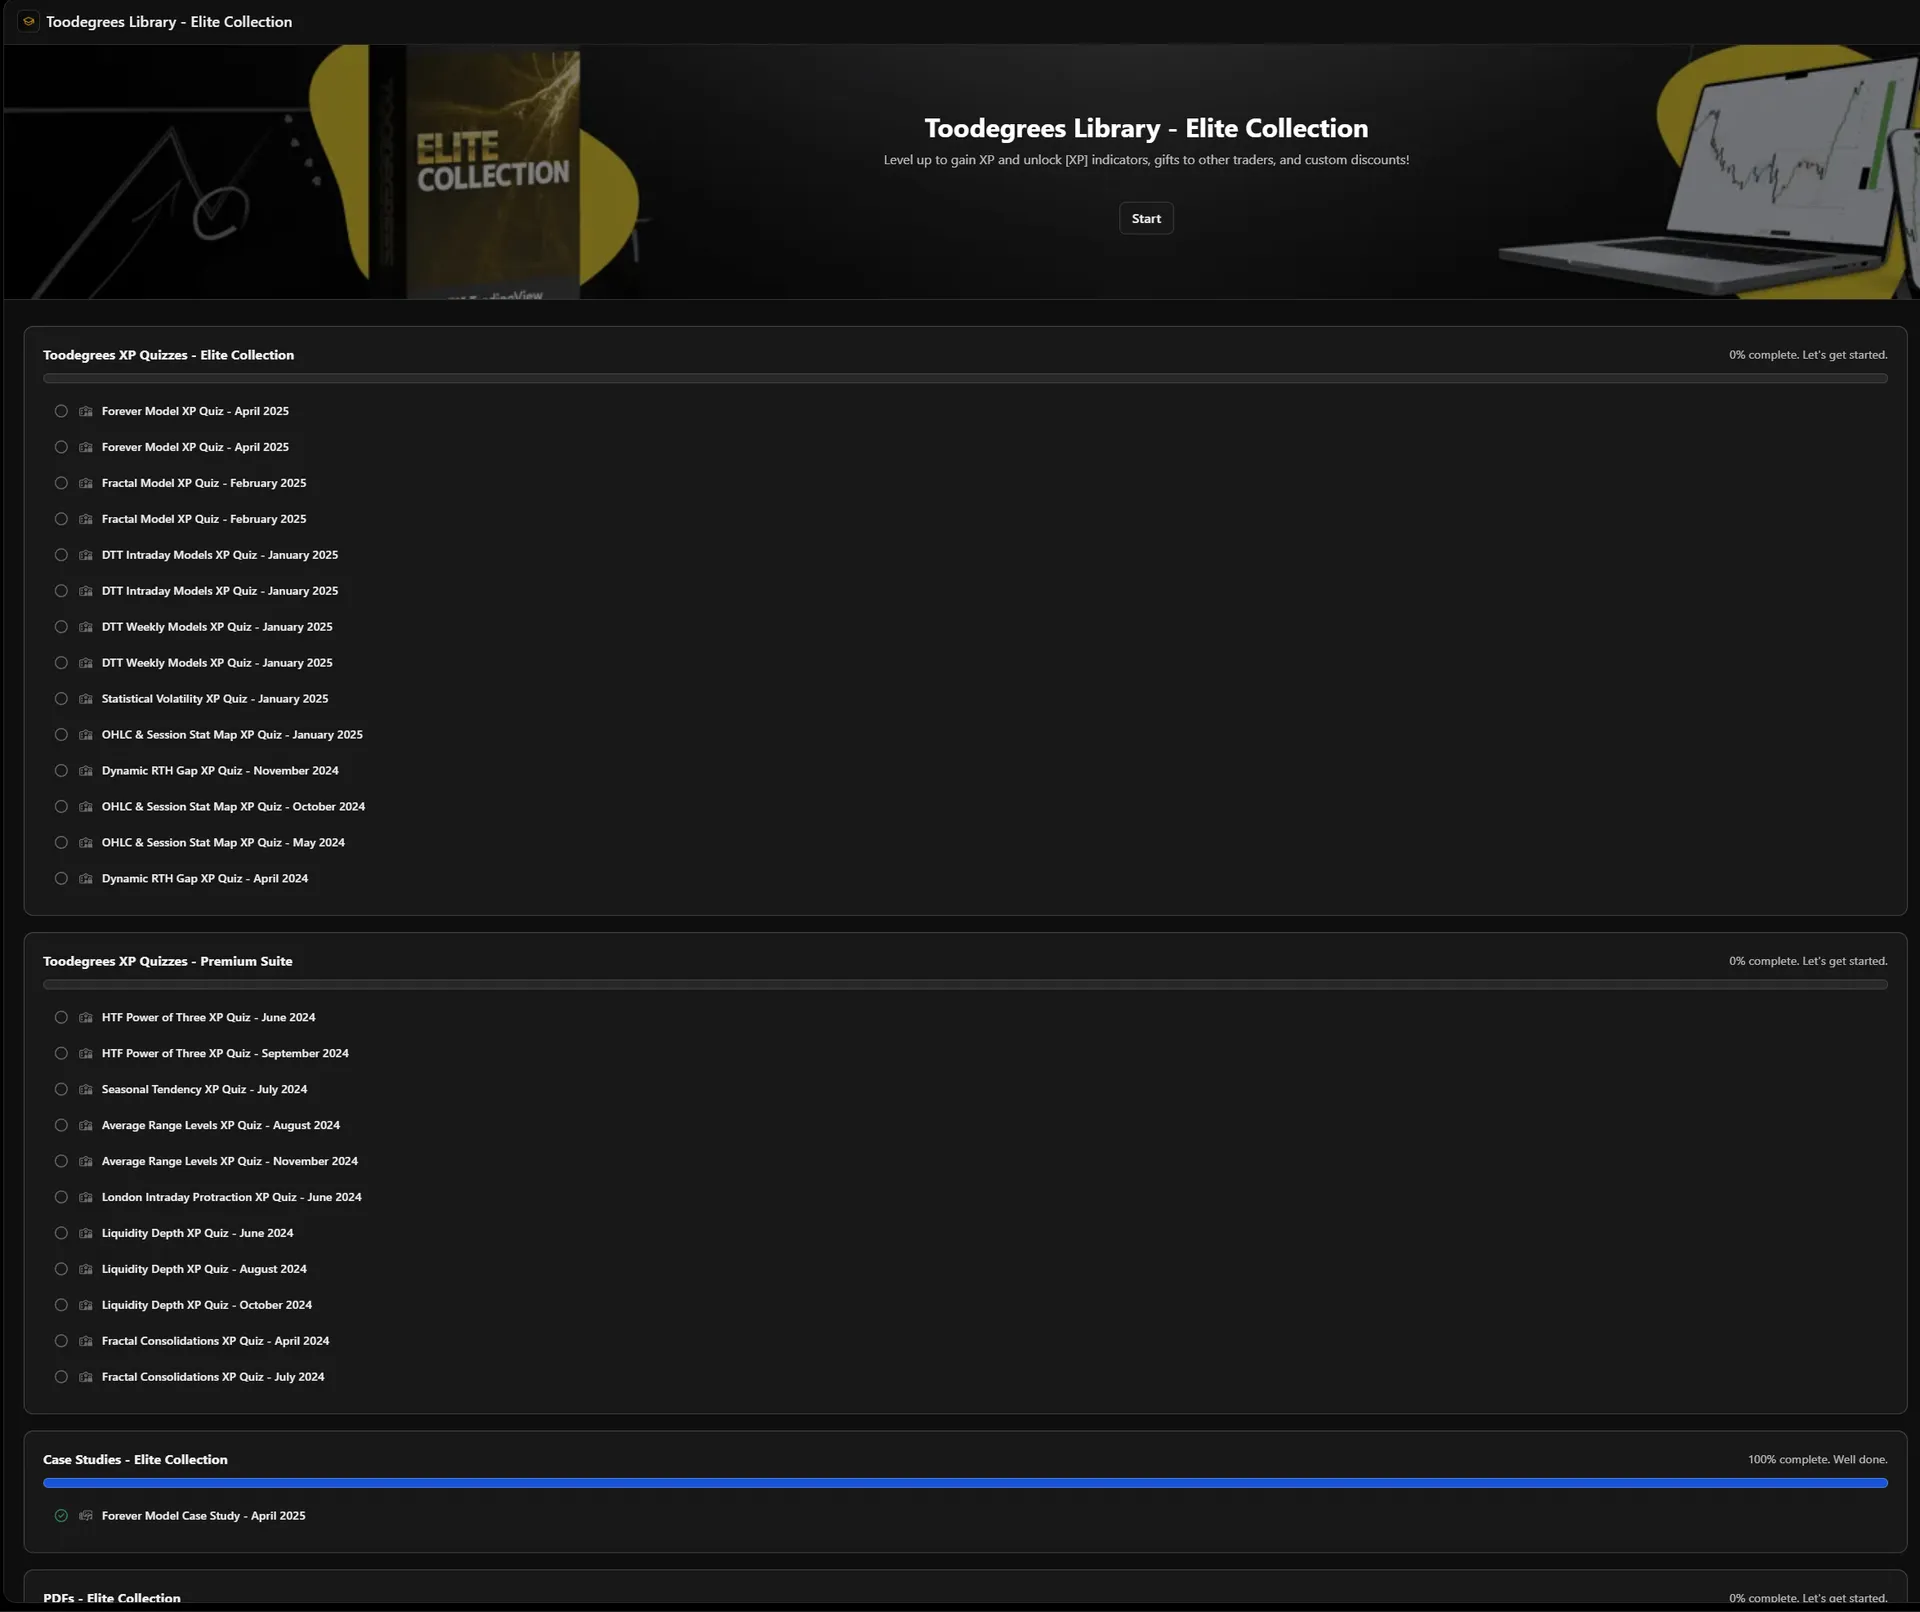
Toodegrees Library
Access all EOM Reports & premium content
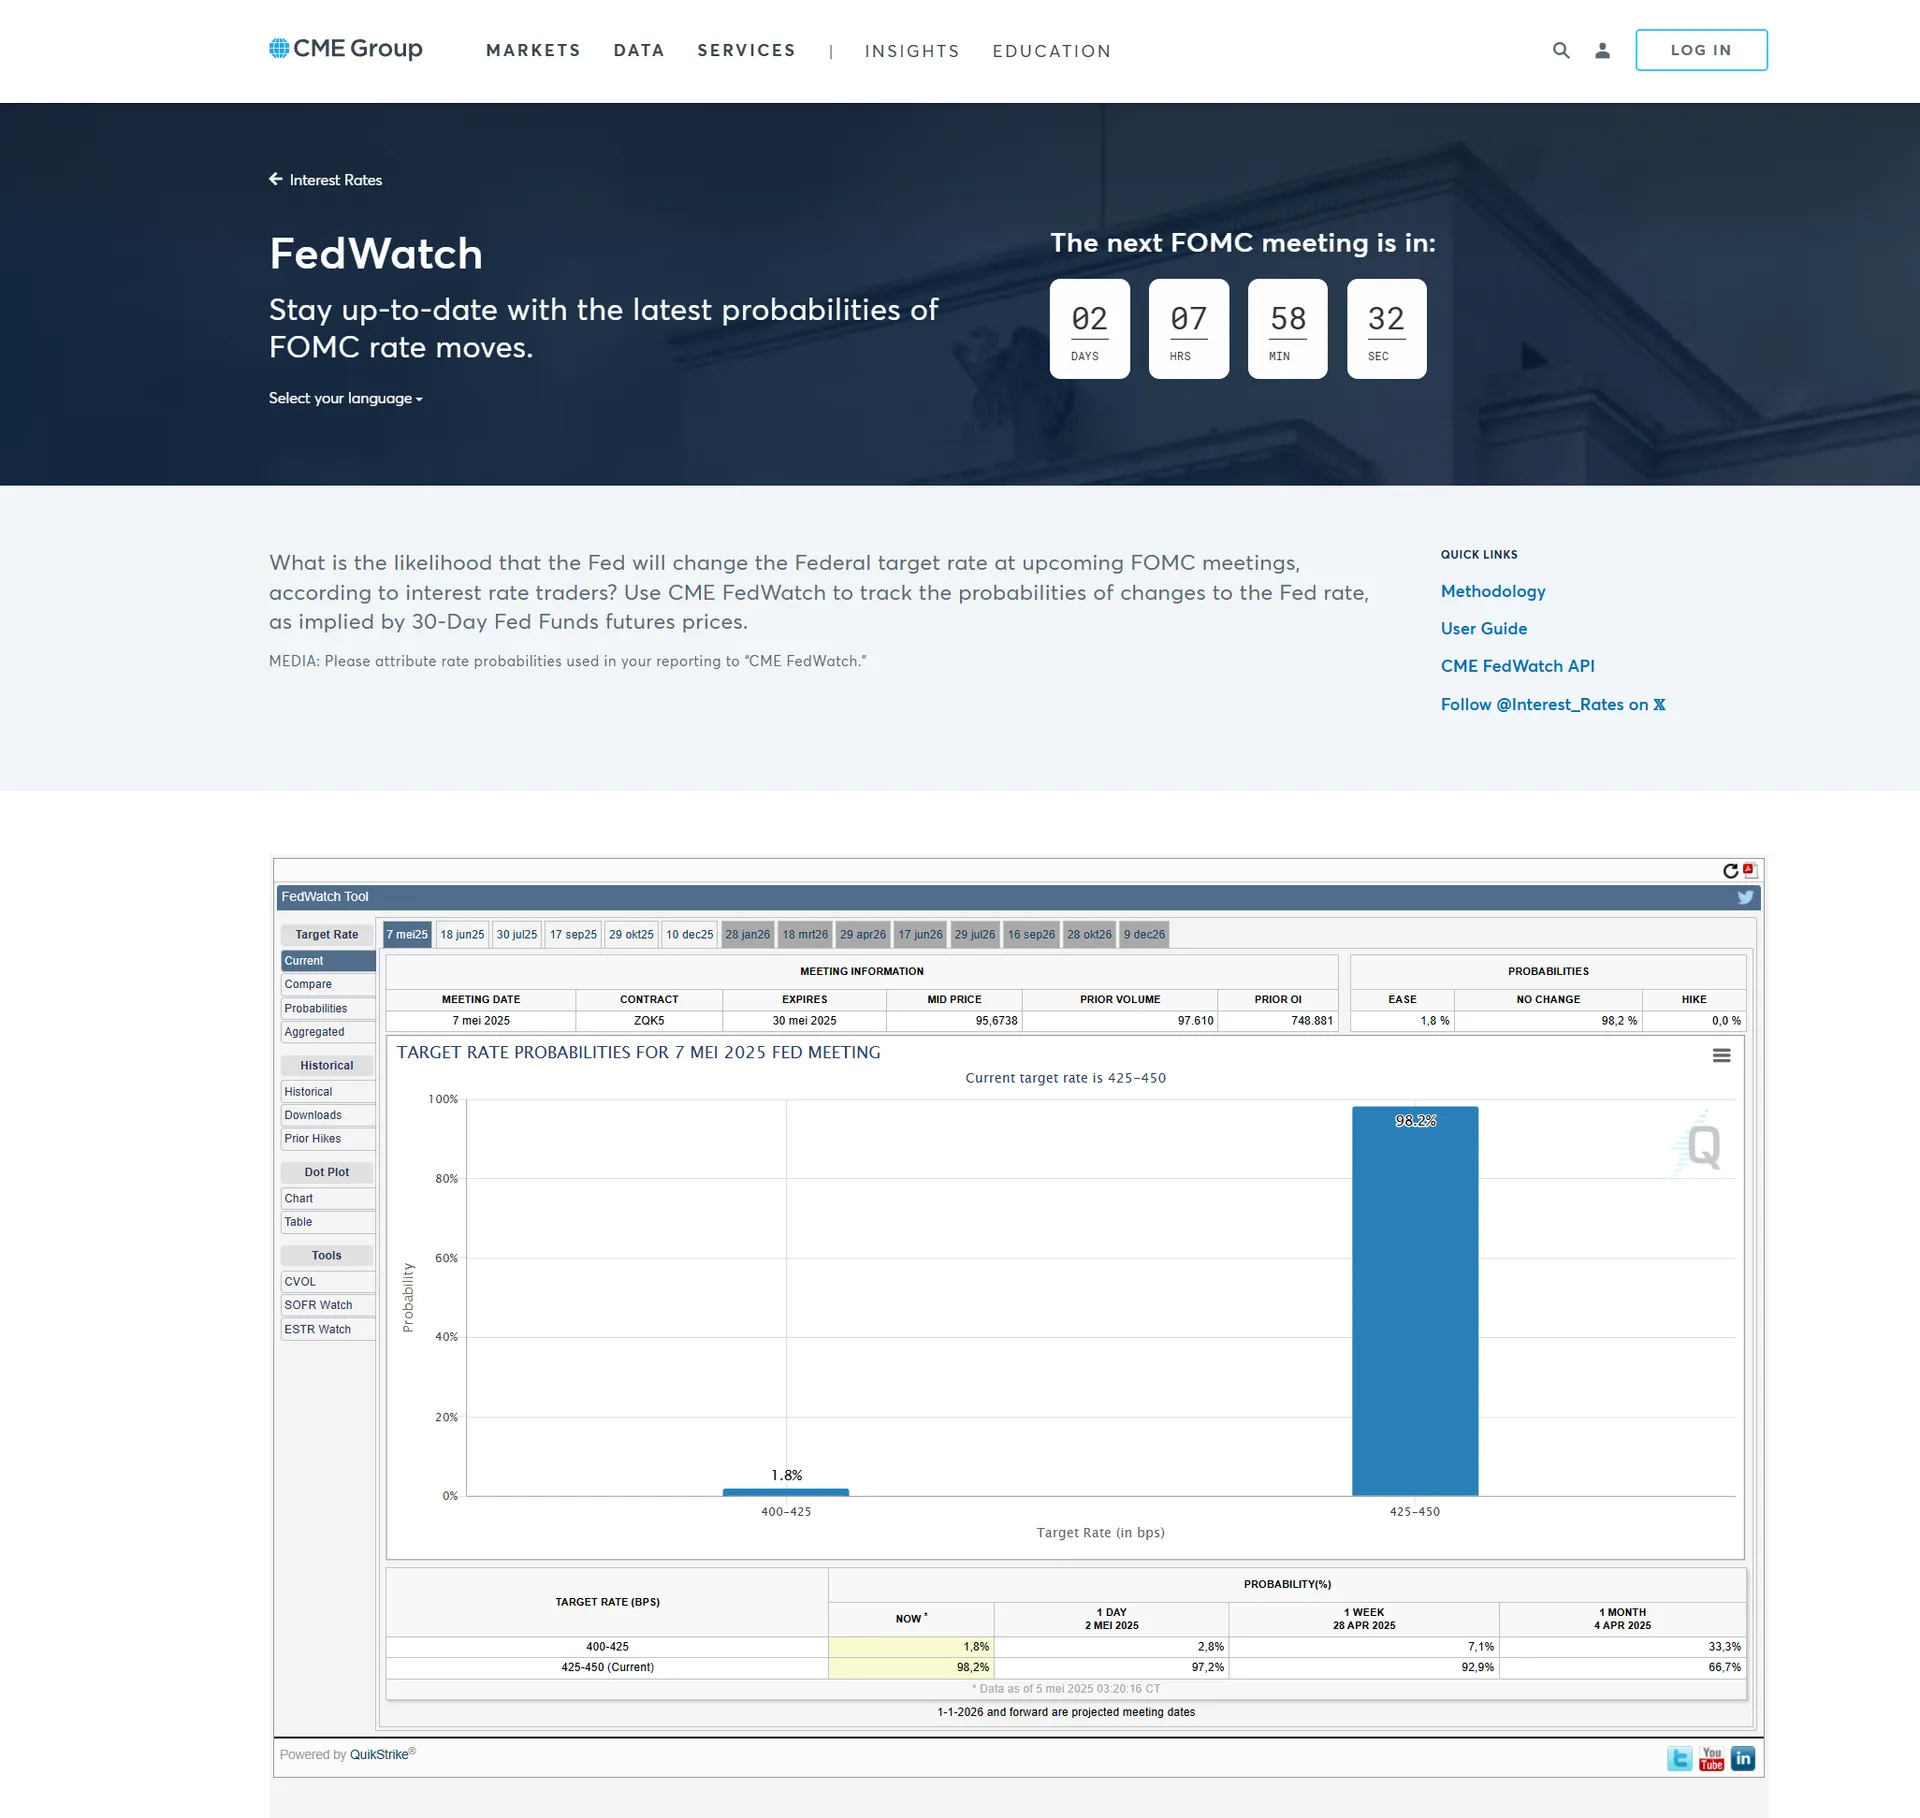
CME FedWatch Tool
Track Federal Reserve rate probability

July EOM Livestream
Full July analysis walkthrough on YouTube
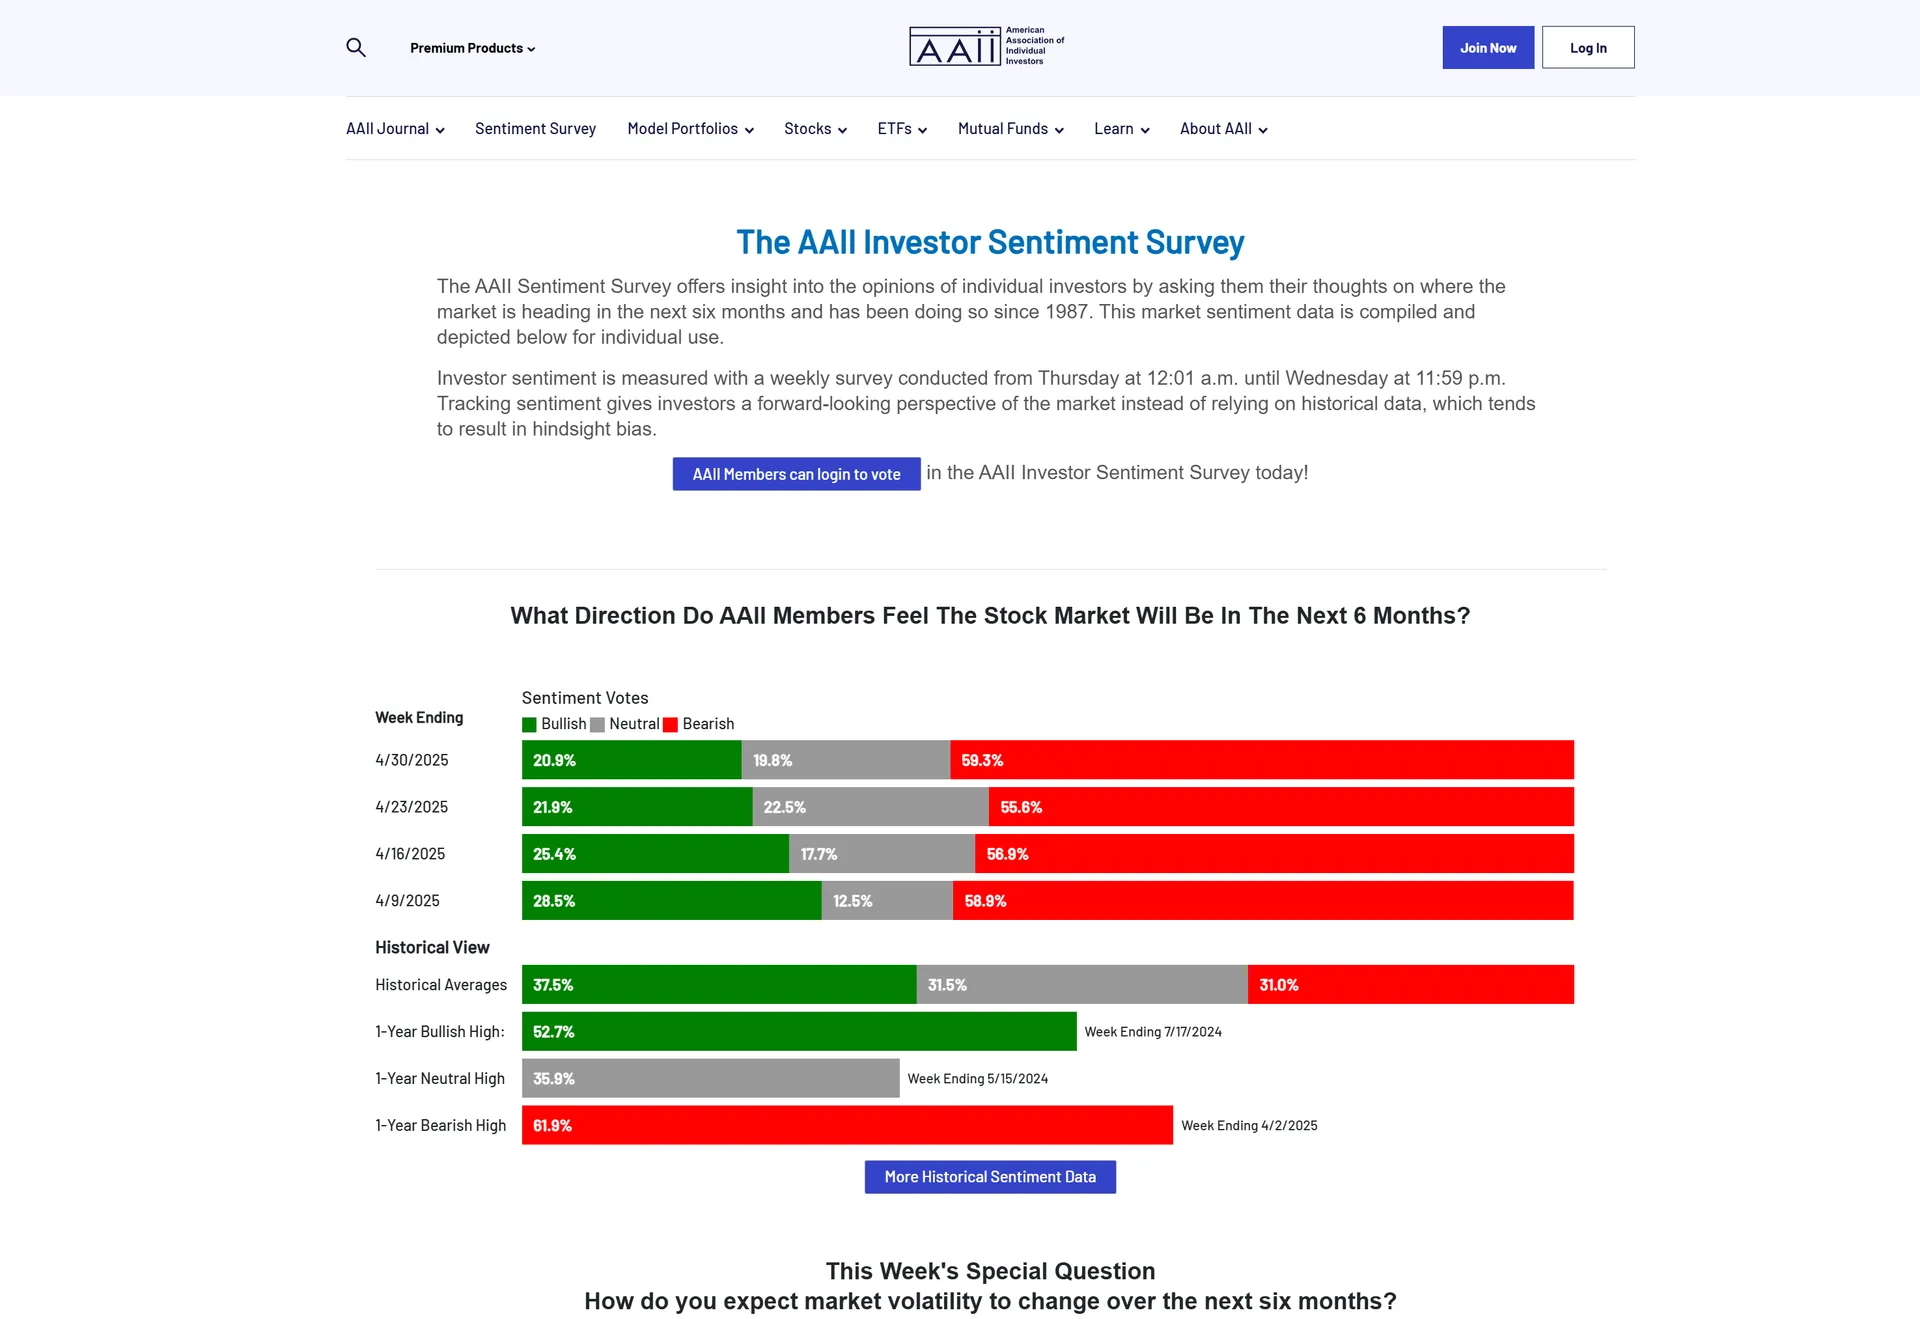
AAII Investor Sentiment Survey
Historical sentiment data & video breakdown
Follow Toodegrees
Section 5
Conclusion — Analysis Recap
July saw a shift in cross-asset momentum, with NQ and ES futures advancing above their 60-day anchored zones, while YM lagged and stayed capped beneath key resistance. July reflected a market consolidating at higher levels, with growth leadership intact but broader participation showing hesitation ahead of August catalysts.
In FX, DXY staged a rebound despite lower OI — suggesting short-covering rather than broad speculative inflows. A clear SMT divergence between DXY, EUR/USD, and GBP/USD provided early confluence for the reversal. ZF and ZN held their IPDA zones; ZB remained the weakest. The yield curve stayed upward-sloping but continued to flatten. COT data showed commercials building net long DXY while specs reduced. Overall, July marked a transition into a more selective, divergence-led environment as Q3 began.
Toodegrees Library