June 2025 EOM Report — Q2 Edition — Inter Market Dynamics

Written by
A Sign Of Time
Head of Education & Toodegrees Analyst

Section 1
Monthly Recap — US Indices (Q2 Edition)
Welcome to the July End-of-Month Market Recap, a concise review of June's price action across U.S. equity futures, FX pairs, and Treasury bonds. Equity futures continued their upward trajectory with NQ and ES reaching yearly highs, while the Dollar Index extended its pullback and EUR/USD showed the greatest strength.
Recent Events
U.S. Equity Rally & Dollar Plunge
U.S. stock markets extended their strong run into June, with major indexes logging back-to-back months of solid gains and setting fresh all-time highs. The U.S. Dollar Index plunged to its weakest levels in over three years, reflecting growing expectations for Federal Reserve easing and broader risk-on sentiment.
Key Drivers
Tech and AI Leadership: Mega-cap technology stocks — led by Nvidia, Microsoft, and Meta — drove the Nasdaq Composite up over 6% in June, marking its second consecutive month of outperformance.
Global Capital Flows: A softer dollar made U.S. equities cheaper for overseas investors, fueling increased portfolio inflows into U.S. stocks and ETFs.
Commodity Strength: The dollar's decline bolstered commodity prices (oil, metals), lifting energy and materials sectors.
Labor Market Resilience: While the labor market showed signs of cooling, it remained far from recessionary, supporting a "soft landing" narrative.
Central Bank Policies — June Announcements
Federal Reserve (FED)
Held federal funds rate at 4.25%–4.50% (June 17–18 meeting). Data-dependent stance amid mixed inflation and labor-market signals.
European Central Bank (ECB)
June 5: Cut deposit facility rate from 2.25% to 2.00%, main refi rate to 2.15% — a 25bps cut to address slowing inflation.
Bank of England (BoE)
June 19: Held Bank Rate at 4.25%, citing robust wage growth and consumer spending despite initial easing in inflation pressures.
June Results — US Index Futures
U.S. equity futures continued their upward trajectory in June. The Nasdaq-100 ($NQ) climbed +6.6% on the back of strong tech and AI earnings. The S&P 500 ($ES) followed with a +5.0% gain. The Dow ($YM) trailed at +4.3%. The relative outperformance of NQ and ES highlights the market's continued preference for growth assets.
$NQ = E-Mini Nasdaq 100 Futures · $ES = E-Mini S&P 500 Futures · $YM = E-Mini Dow Jones Futures
Sentiment Analysis
The Fed held rates in June and reiterated a data-dependent approach, keeping markets tentatively positioned for a Q3 or Q4 rate cut. Fears of a sweeping 20% tariff faded after the U.S. paused escalation plans, calming investor nerves.
AAII Investor Sentiment (June 27): Bullish sentiment at 35.2% (up from 32.9% in May). Bearish sentiment decreased to 44.1% (down from 48.8%). Fear & Greed Index (June 4): 63 — Greed (up from 56 in May). FOMC July FedWatch: 80.9% probability of hold at 4.25–4.50%.
Section 2
Technical Analysis — Nasdaq 100
Multi-Asset IPDA — June 2nd Anchored
IPDA Lookback anchored at the start of June, measuring Relative Strength across NQ, ES, and YM relative to the 60-day lookback period.
[E-MINI NASDAQ 100]
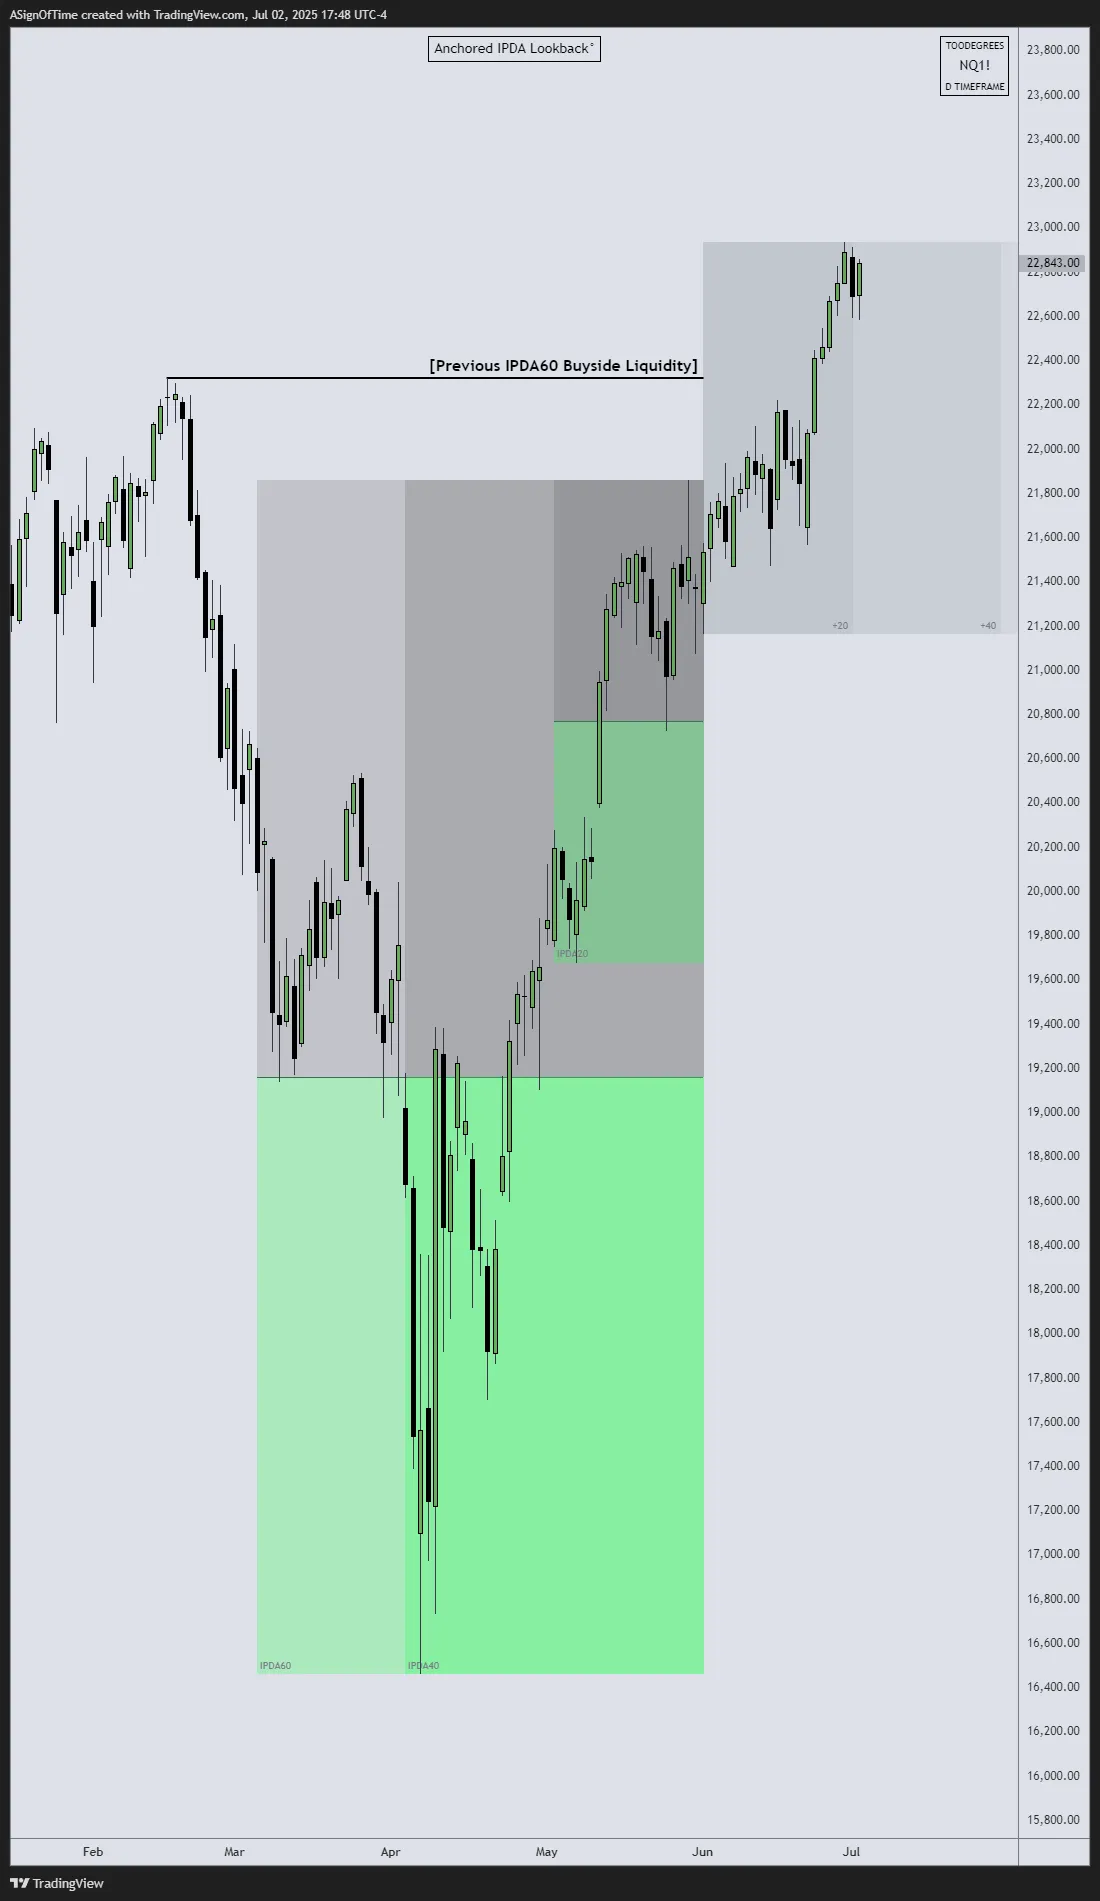
Above 60-Day BSL
[E-MINI S&P 500]
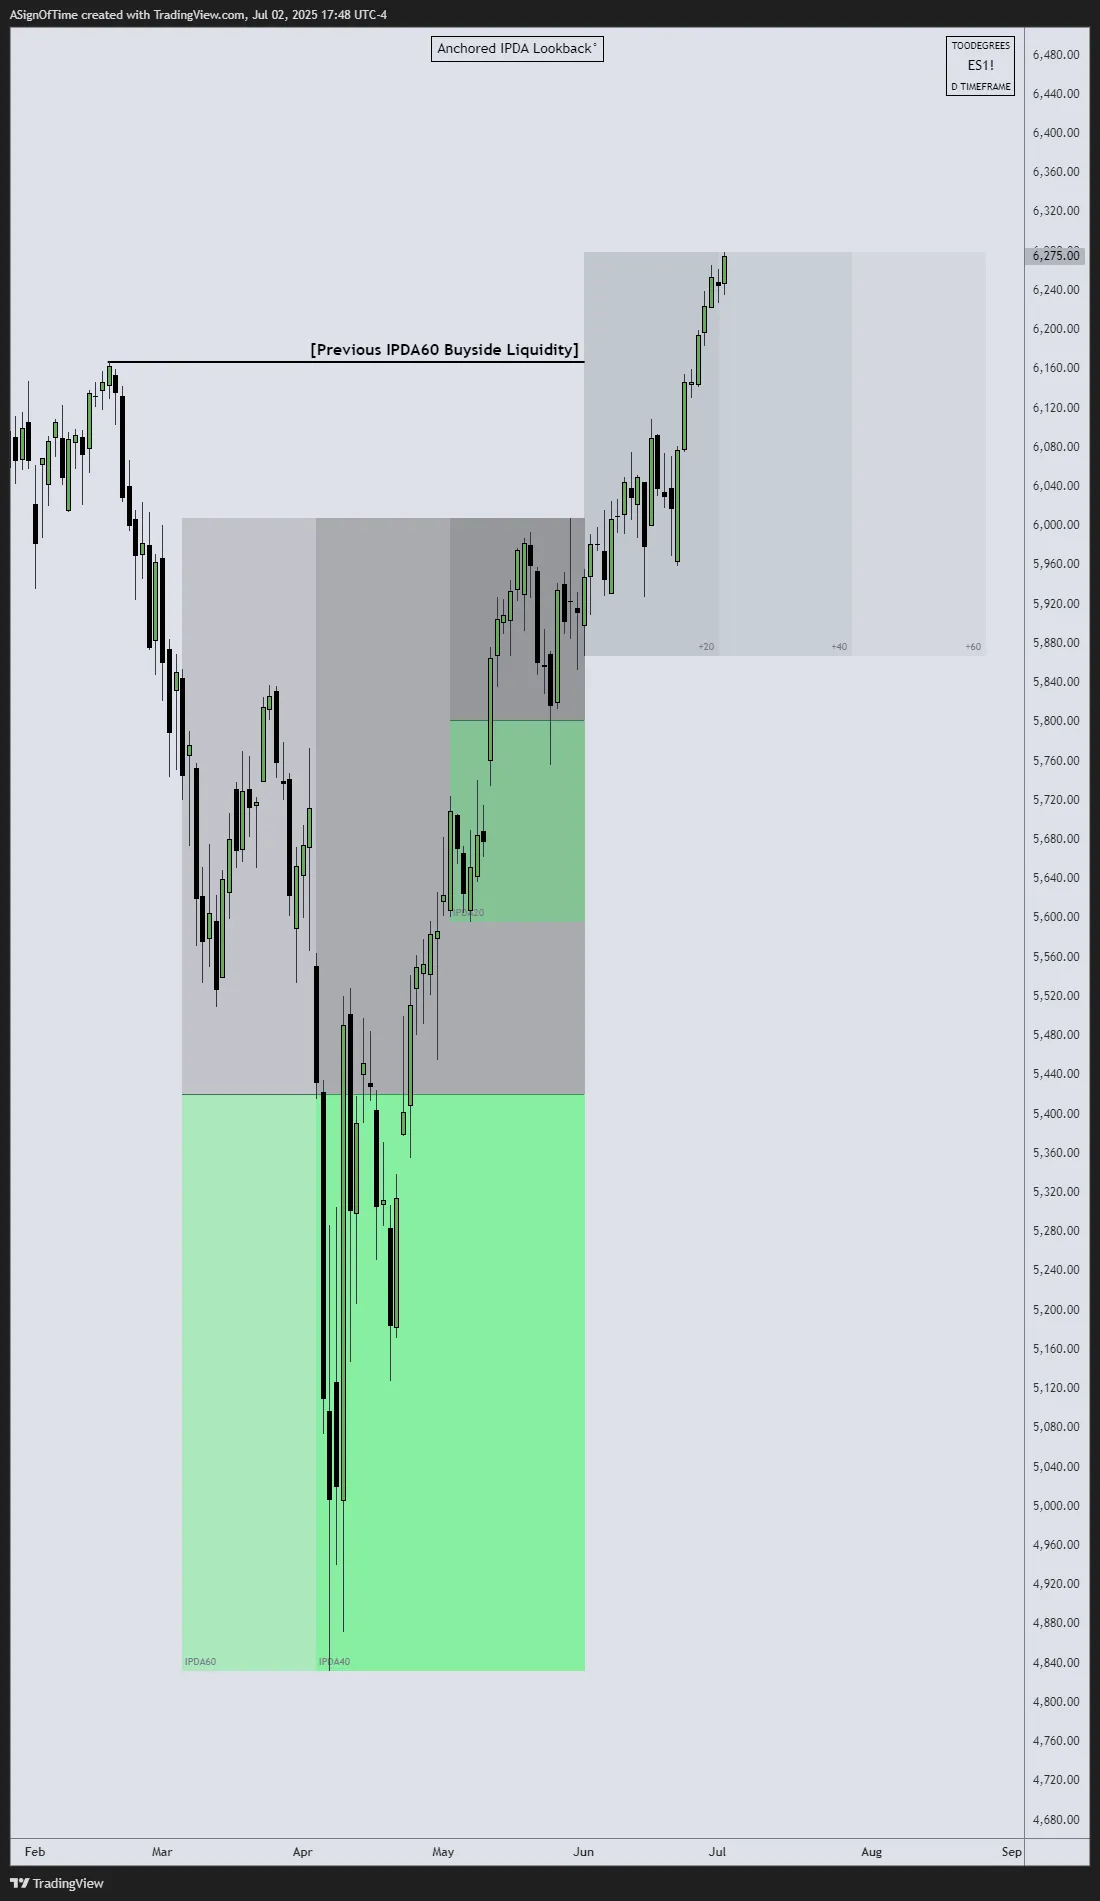
Above 60-Day BSL
[E-MINI DOW JONES]
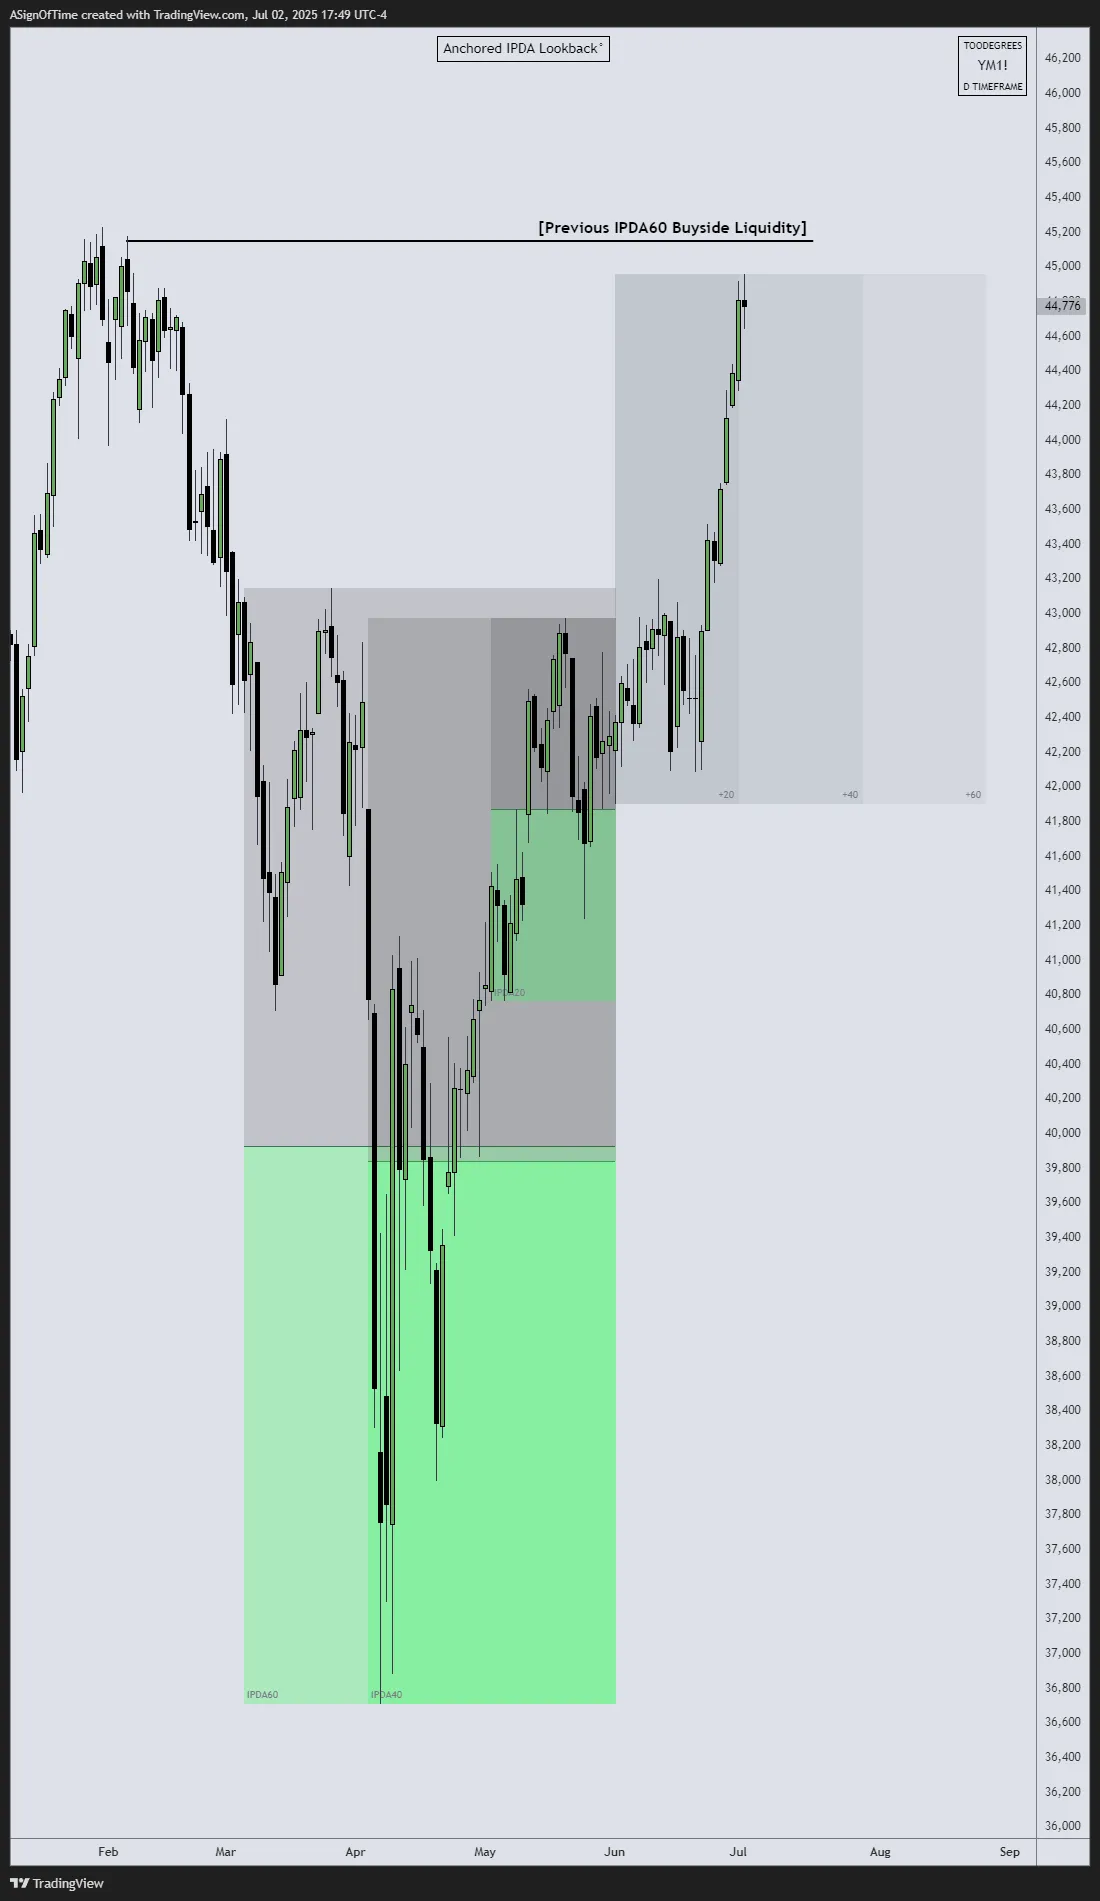
Below ATH Liquidity
Analyst Insight
In the previous report, we outlined our expectation for the indices to aim for the yearly highs — so far NQ and ES have reached this target. Both ran up into and above their May-anchored 60-Day Buyside Liquidity zones. YM remains below the All Time High Liquidity pool, highlighting its ongoing relative weakness.
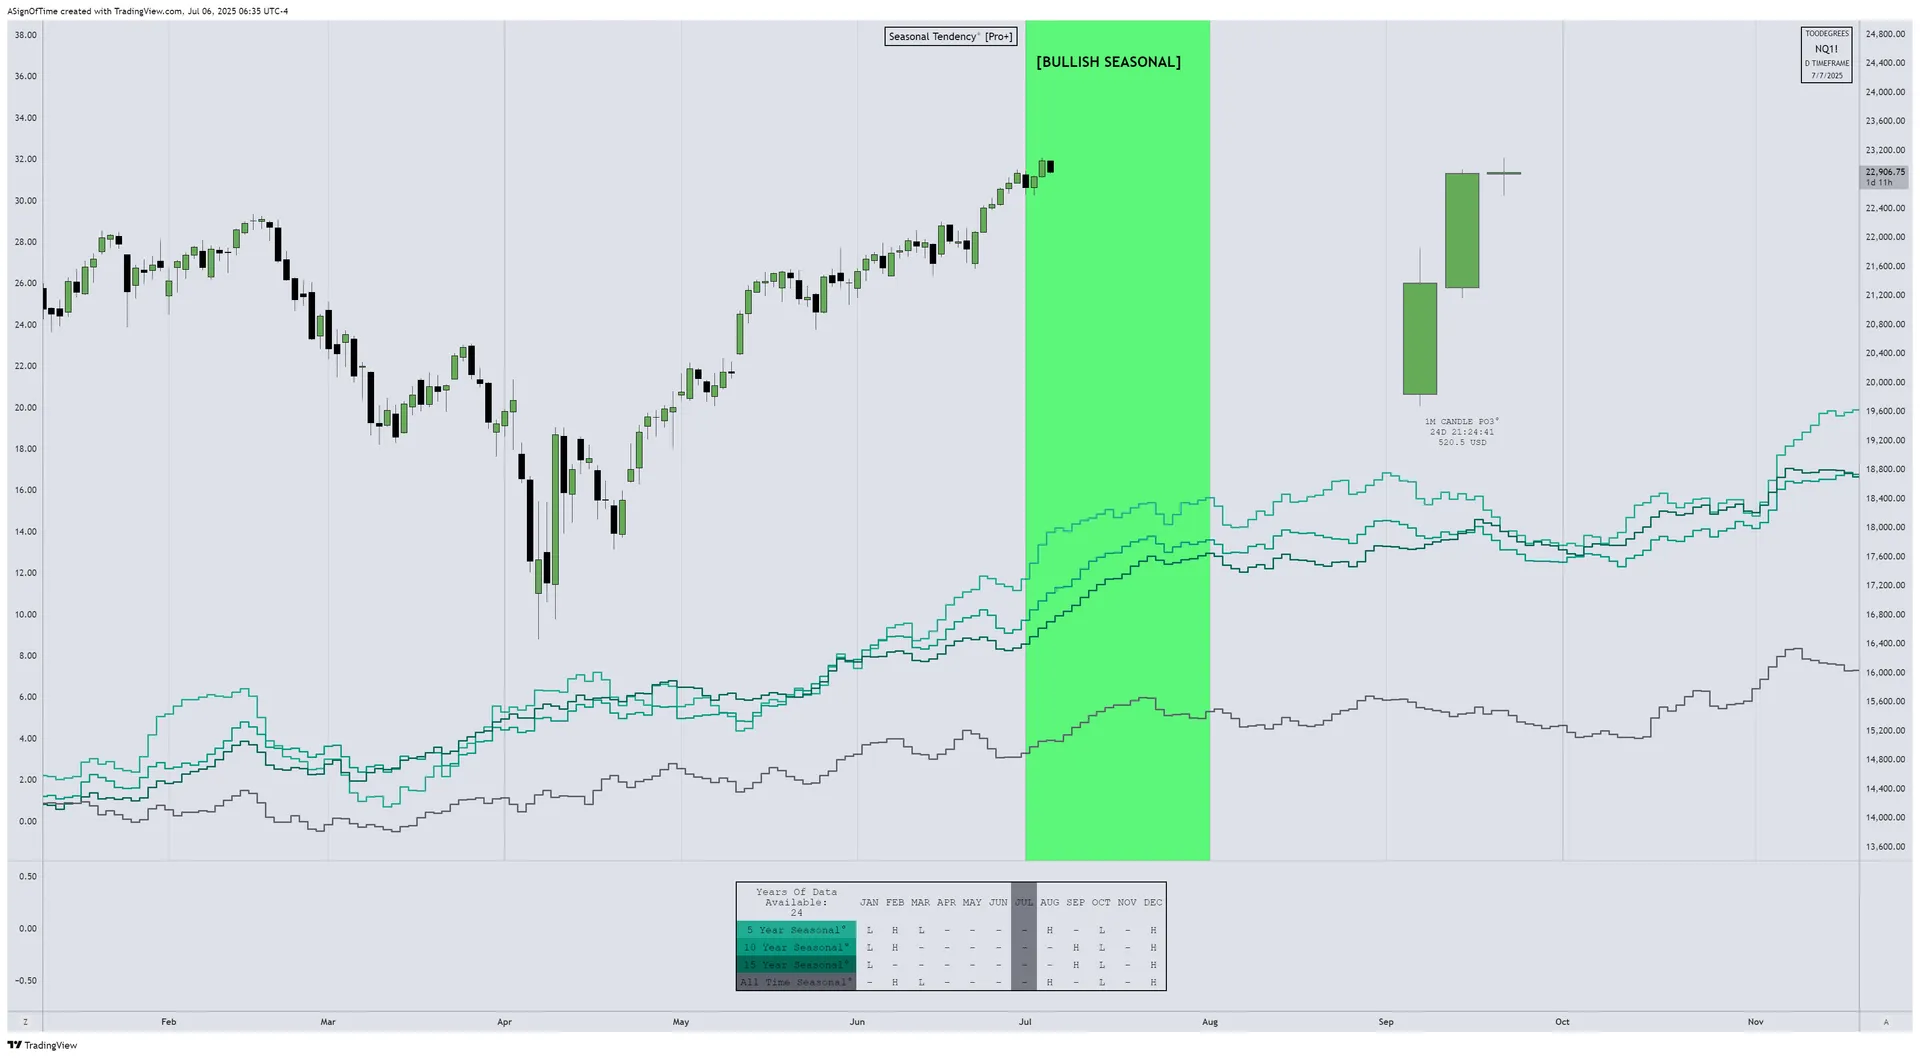
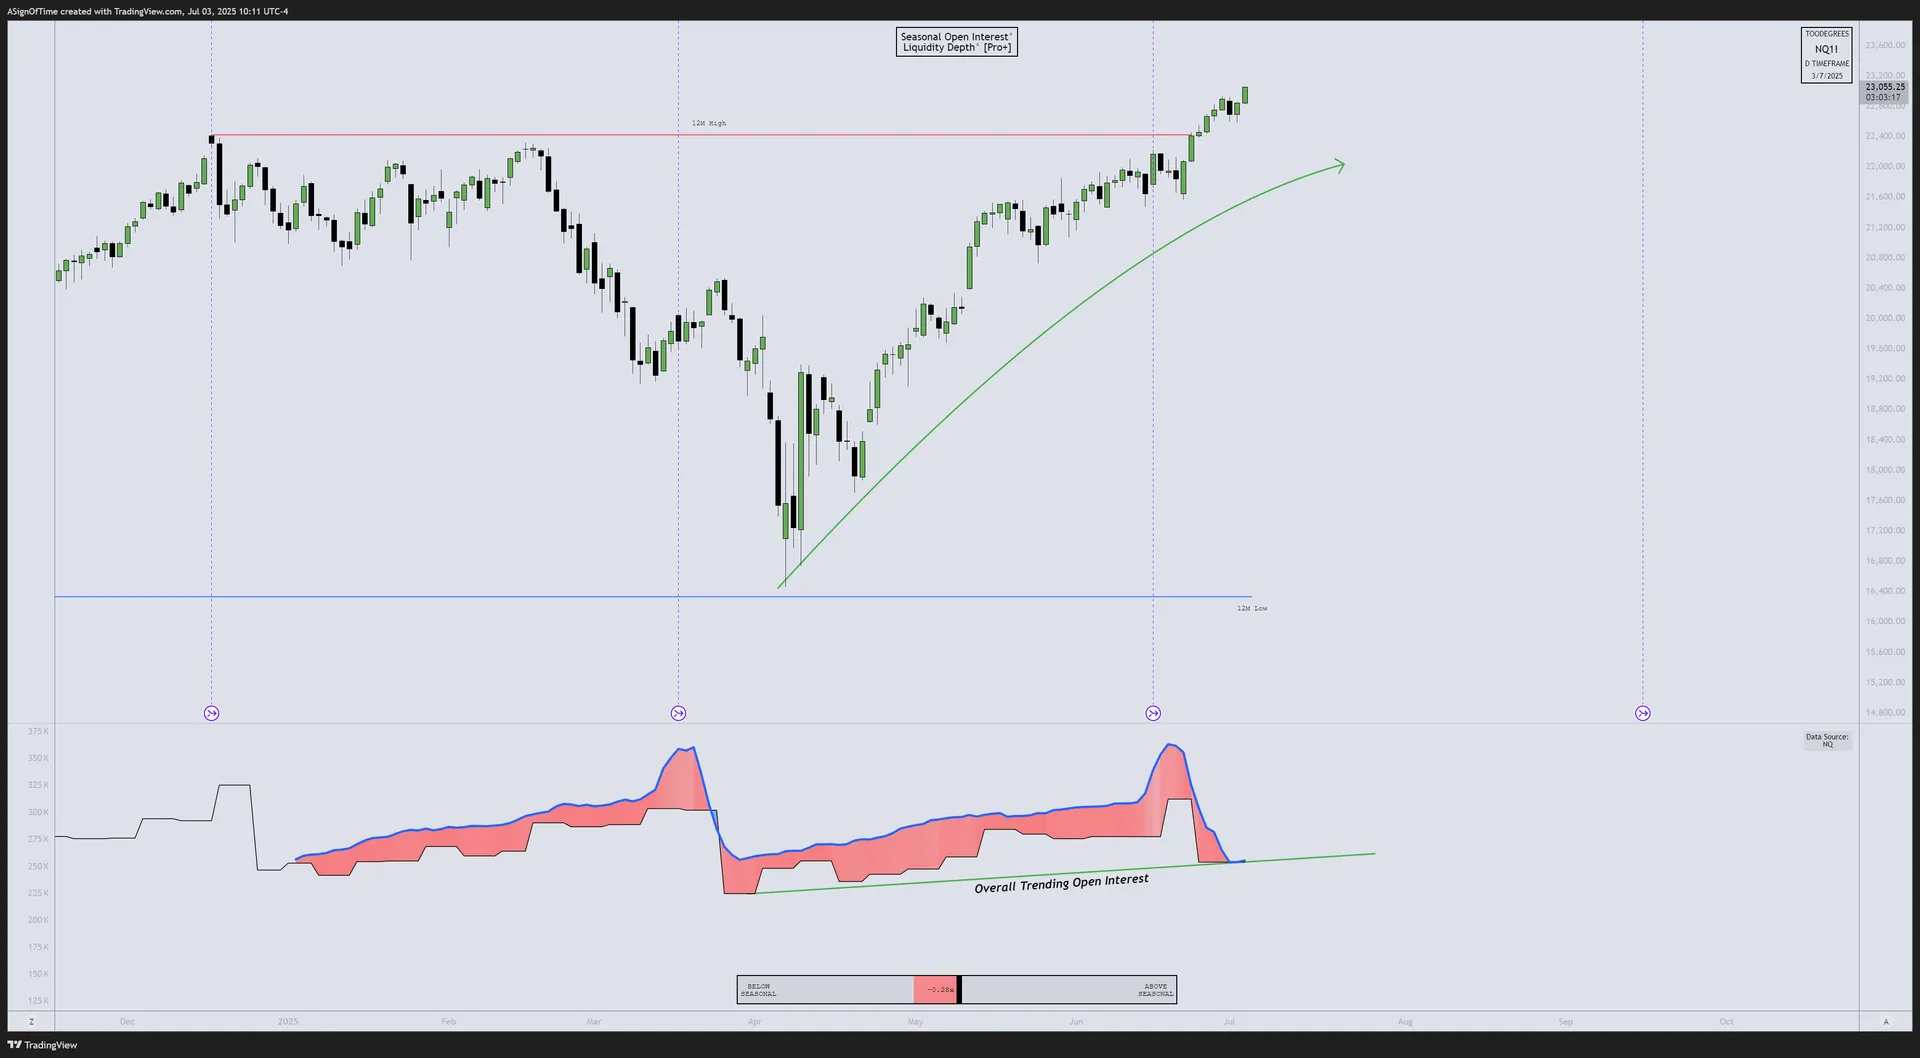
NQ Seasonality Analysis
Seasonal tendencies are recurring patterns in stocks, bonds, currencies, and commodities. As of now, NQ has been moving in line with its Seasonal Roadmap since April — suggesting continued price exploration ahead.
NQ Open Interest
As expected around the expiry of a quarterly contract, Open Interest plummeted significantly in June. The expectation now is for OI to slowly pick up its pace. Rising OI + Commercial backing + Seasonal alignment = multiple confluences aligned.
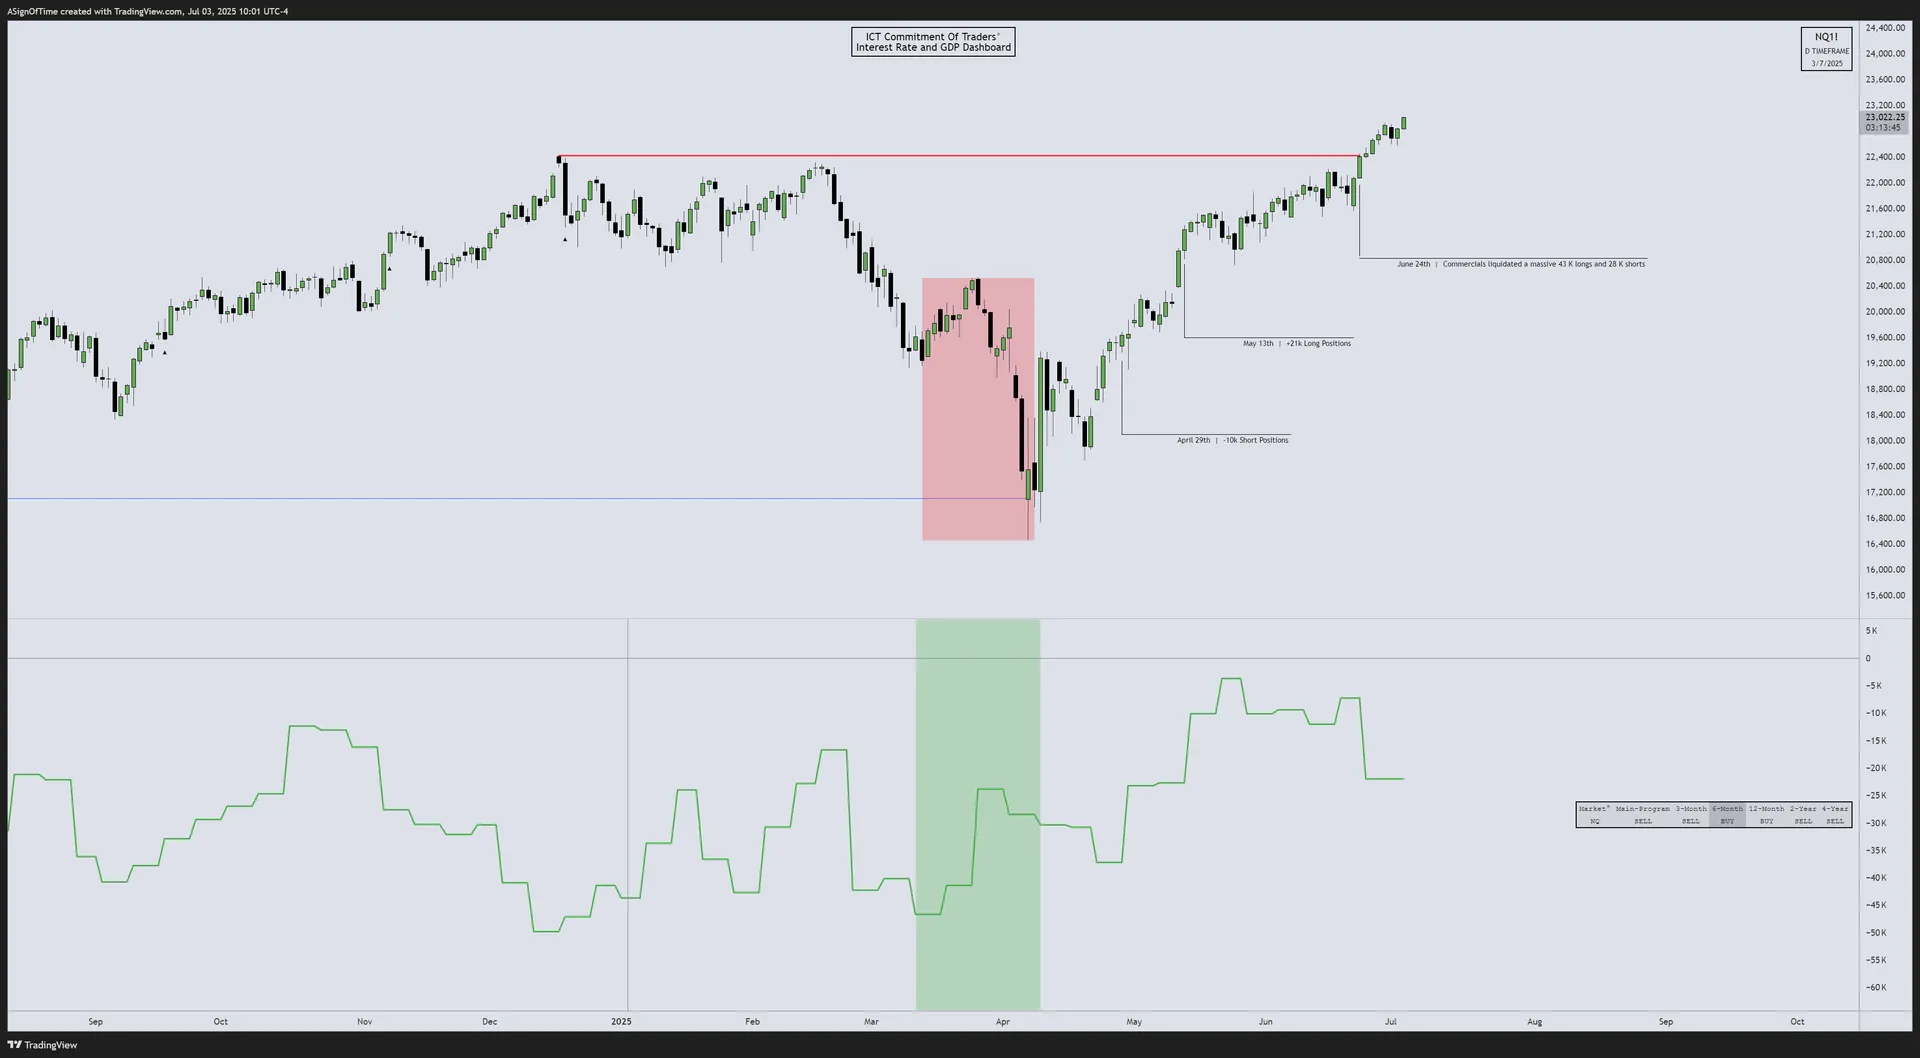
NQ Commitment of Traders
The COT Report (CFTC, weekly) provides insight into the positioning of Commercial Traders, Large Traders, and Small Speculators — revealing the Hedging Program of commercial participants.
Section 3
Inter-Market Dynamics — Currency & Bond Markets
June Results — Currency Markets
In June, the U.S. Dollar Index (DXY) fell by approximately –1.67%, extending its 2025 slide. EUR/USD surged +2.60%, driven by resilient Euro-area PMI readings and a more hawkish ECB outlook. GBP/USD climbed +0.76% amid broad dollar weakness but capped by UK fiscal jitters.
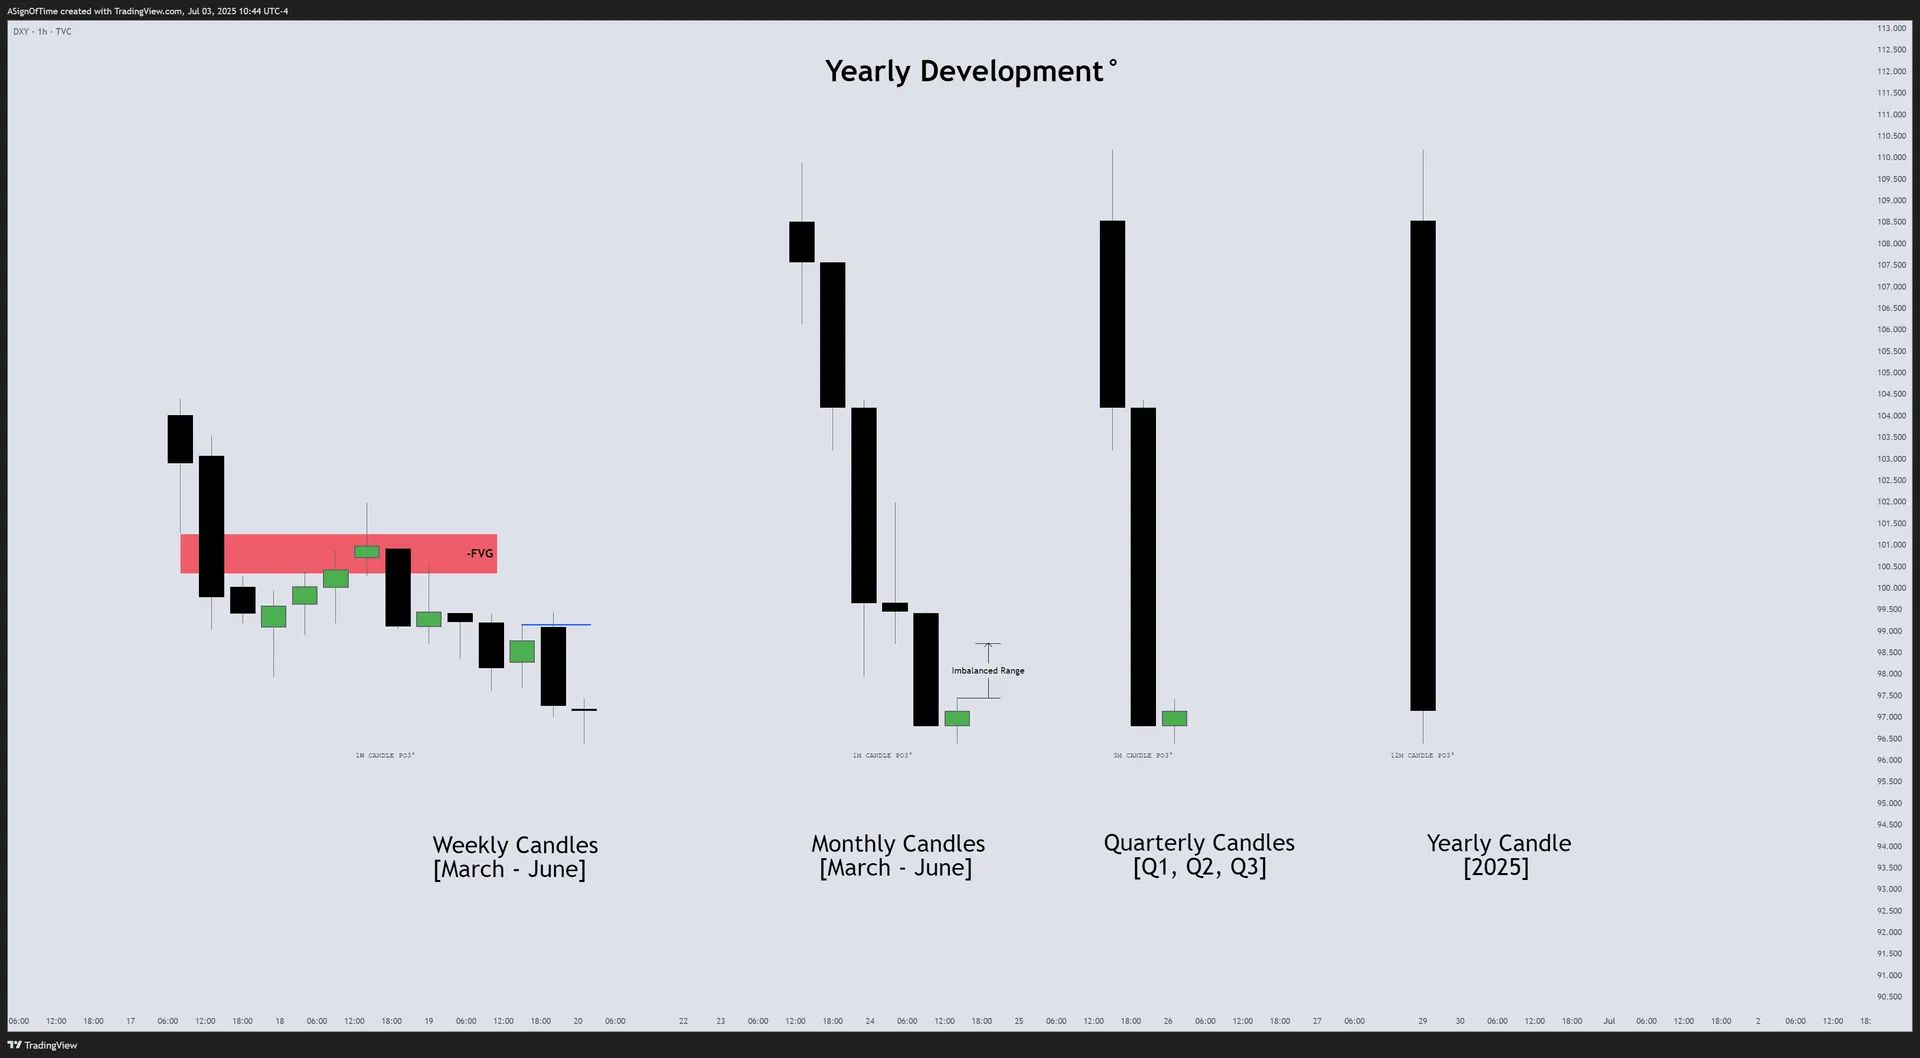
DXY Monthly Recap — HTF Power of Three Dashboard
The DXY began 2025 retracing higher into late March, creating a Bearish Fair Value Gap — our key Point of Interest. At April's open the DXY retraced back into that FVG and rolled over. May and June continued the pull-back. The Q2 quarterly candle has now closed deeply bearish. The 2025 yearly candle shows a long upper wick of rejection after Q2 selling, suggesting early-year dollar gains have given way to renewed weakness.
Multi-Asset Currency IPDA — June Anchored
IPDA Lookback anchored at the start of June — measuring Relative Strength across DXY, EUR/USD, and GBP/USD.
[US Dollar Index]

[EUR/USD]
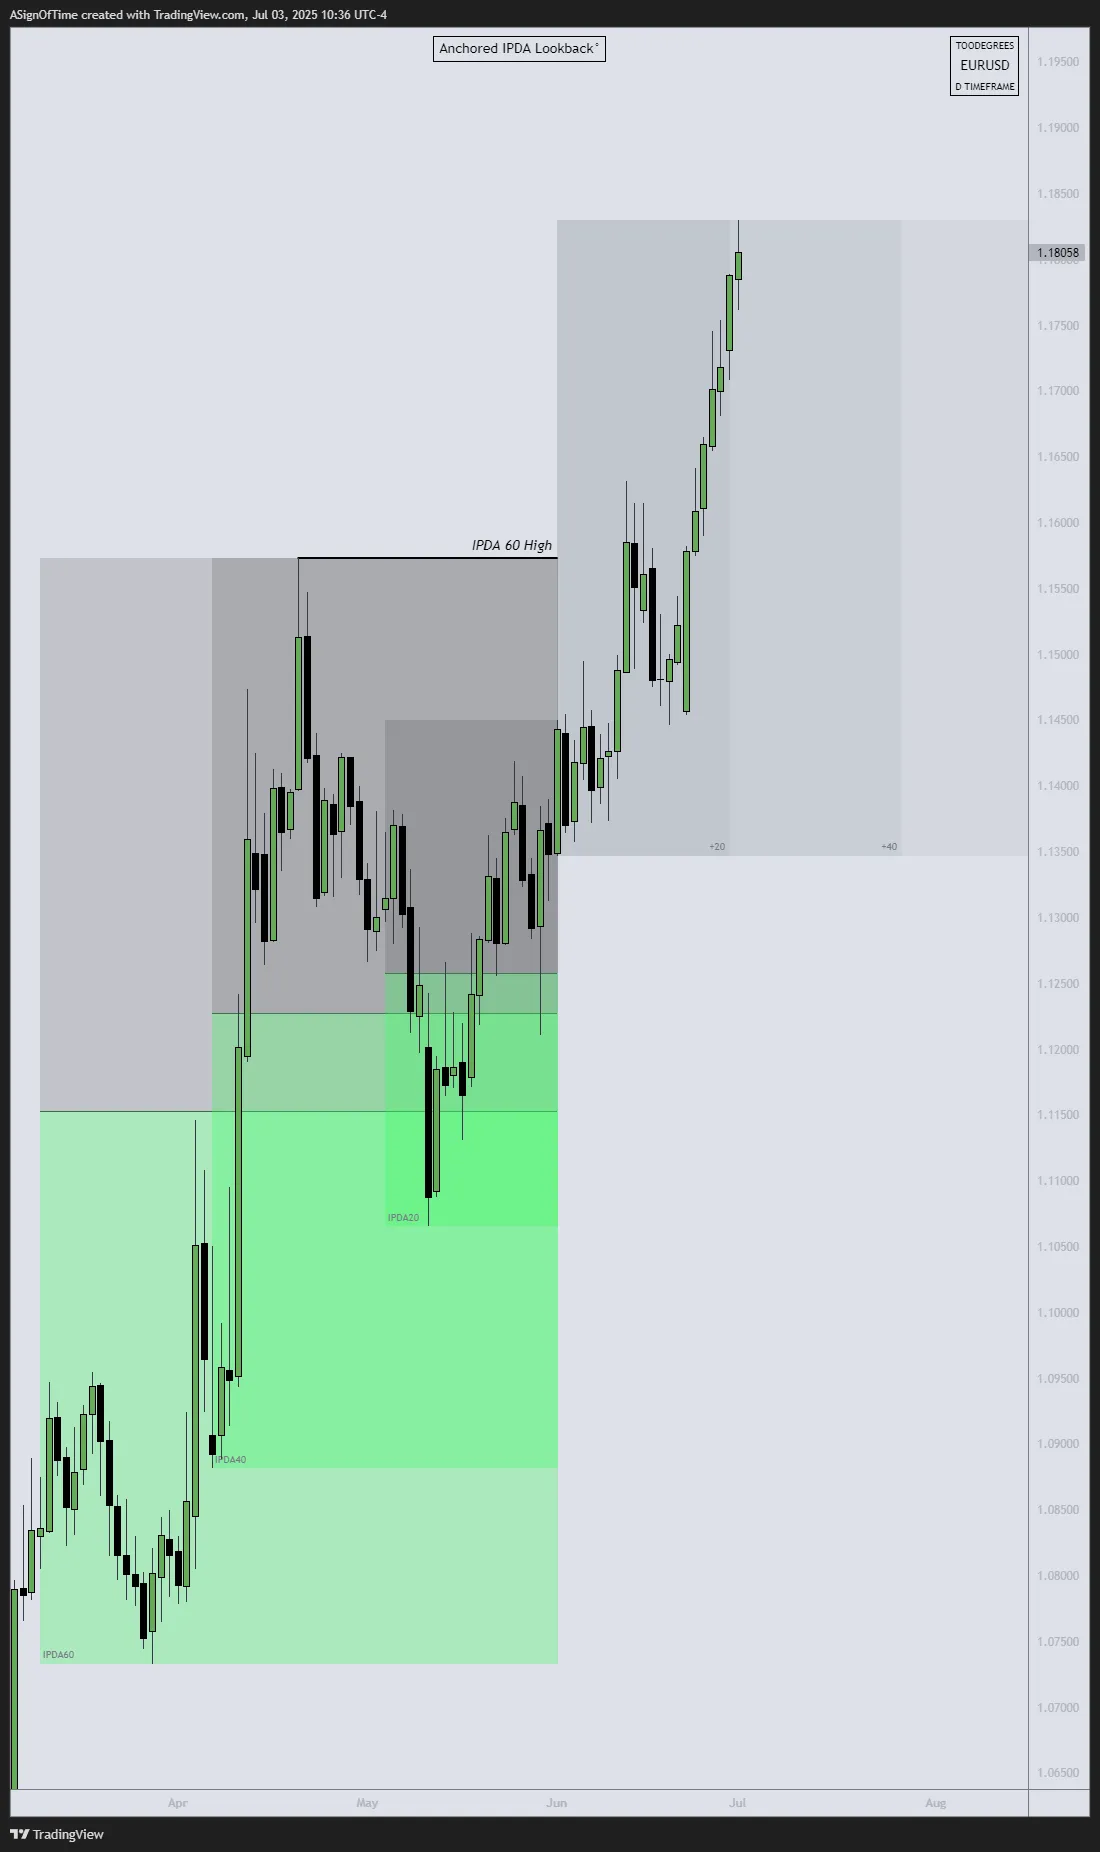
[GBP/USD]
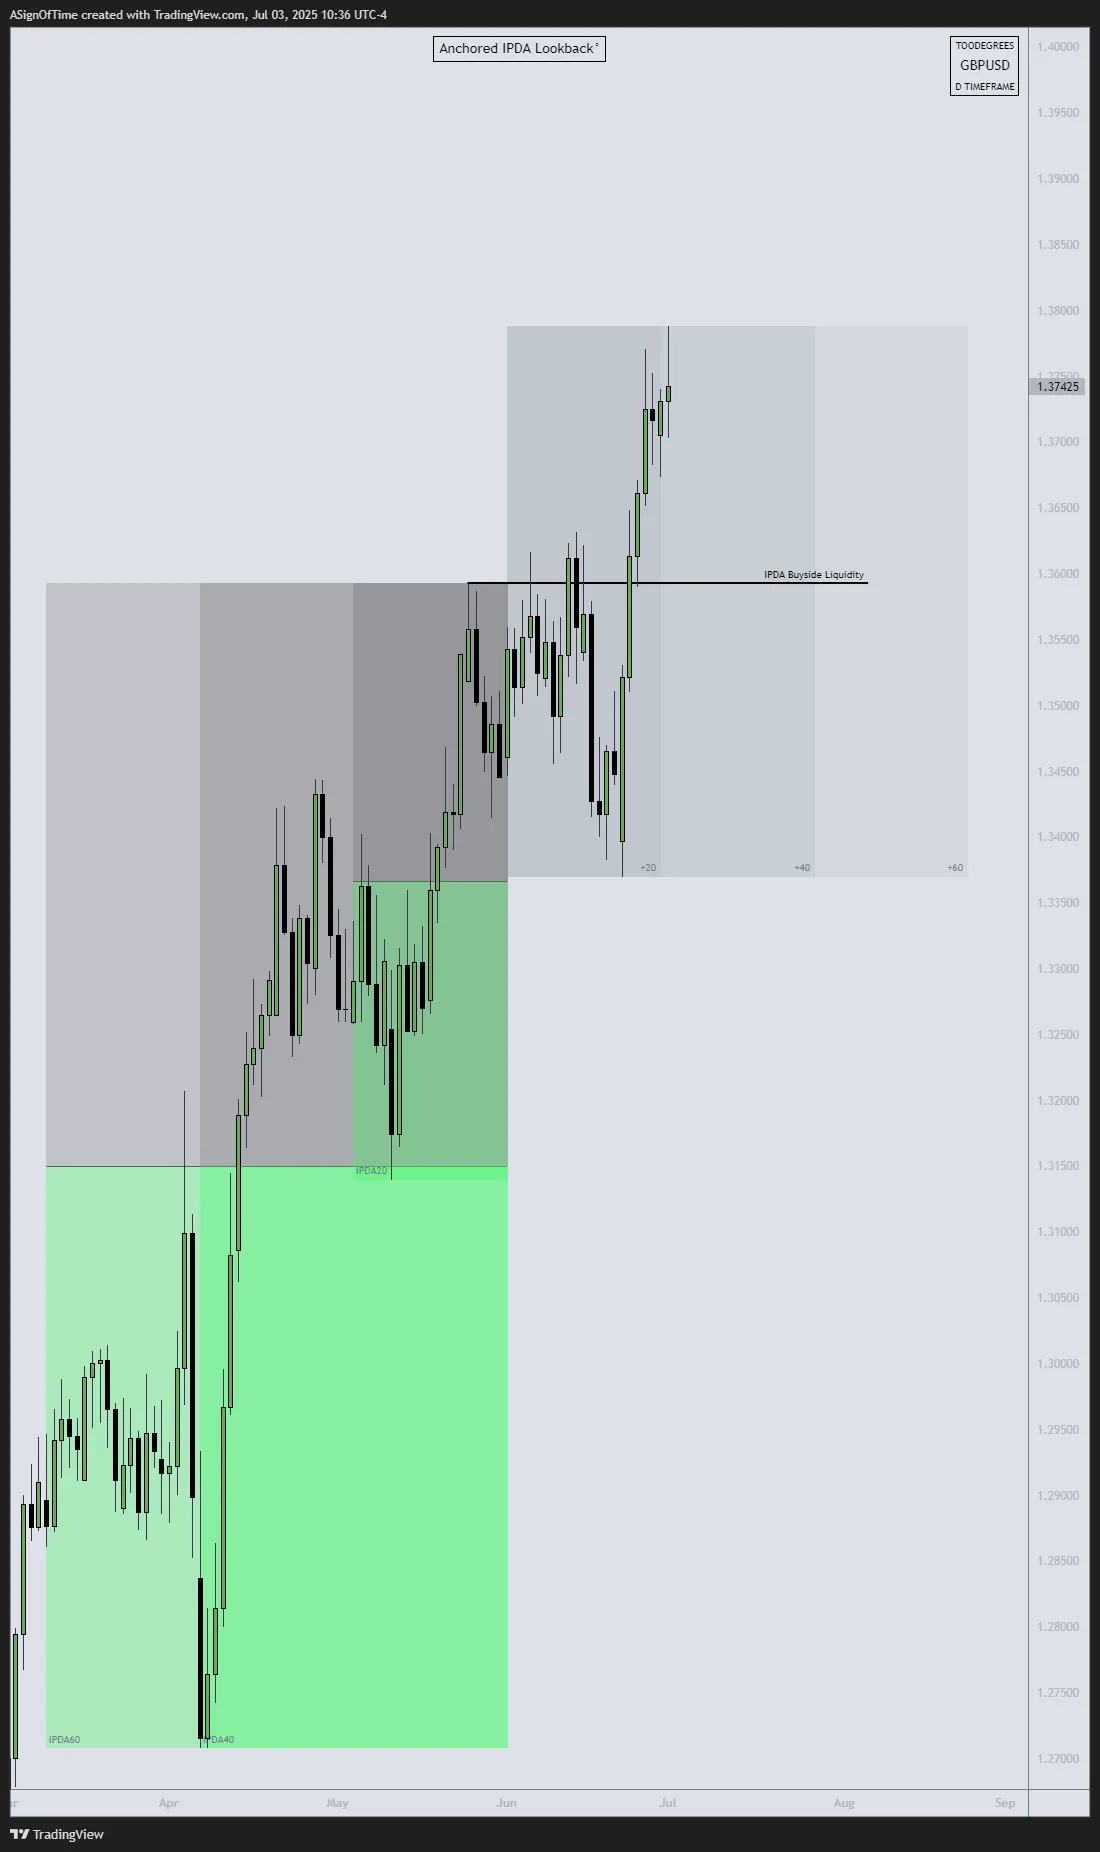
Analyst Insight
In June, all three FX instruments cleared their IPDA 20-Day Liquidity pools. The Euro led the charge, surging furthest beyond its IPDA Lookback liquidity — cementing its role as the relative-strength leader. That broad-based bid confirms that despite any Bearish SMT divergence, the dominant orderflow remains firmly behind foreign currencies and against the dollar overall.
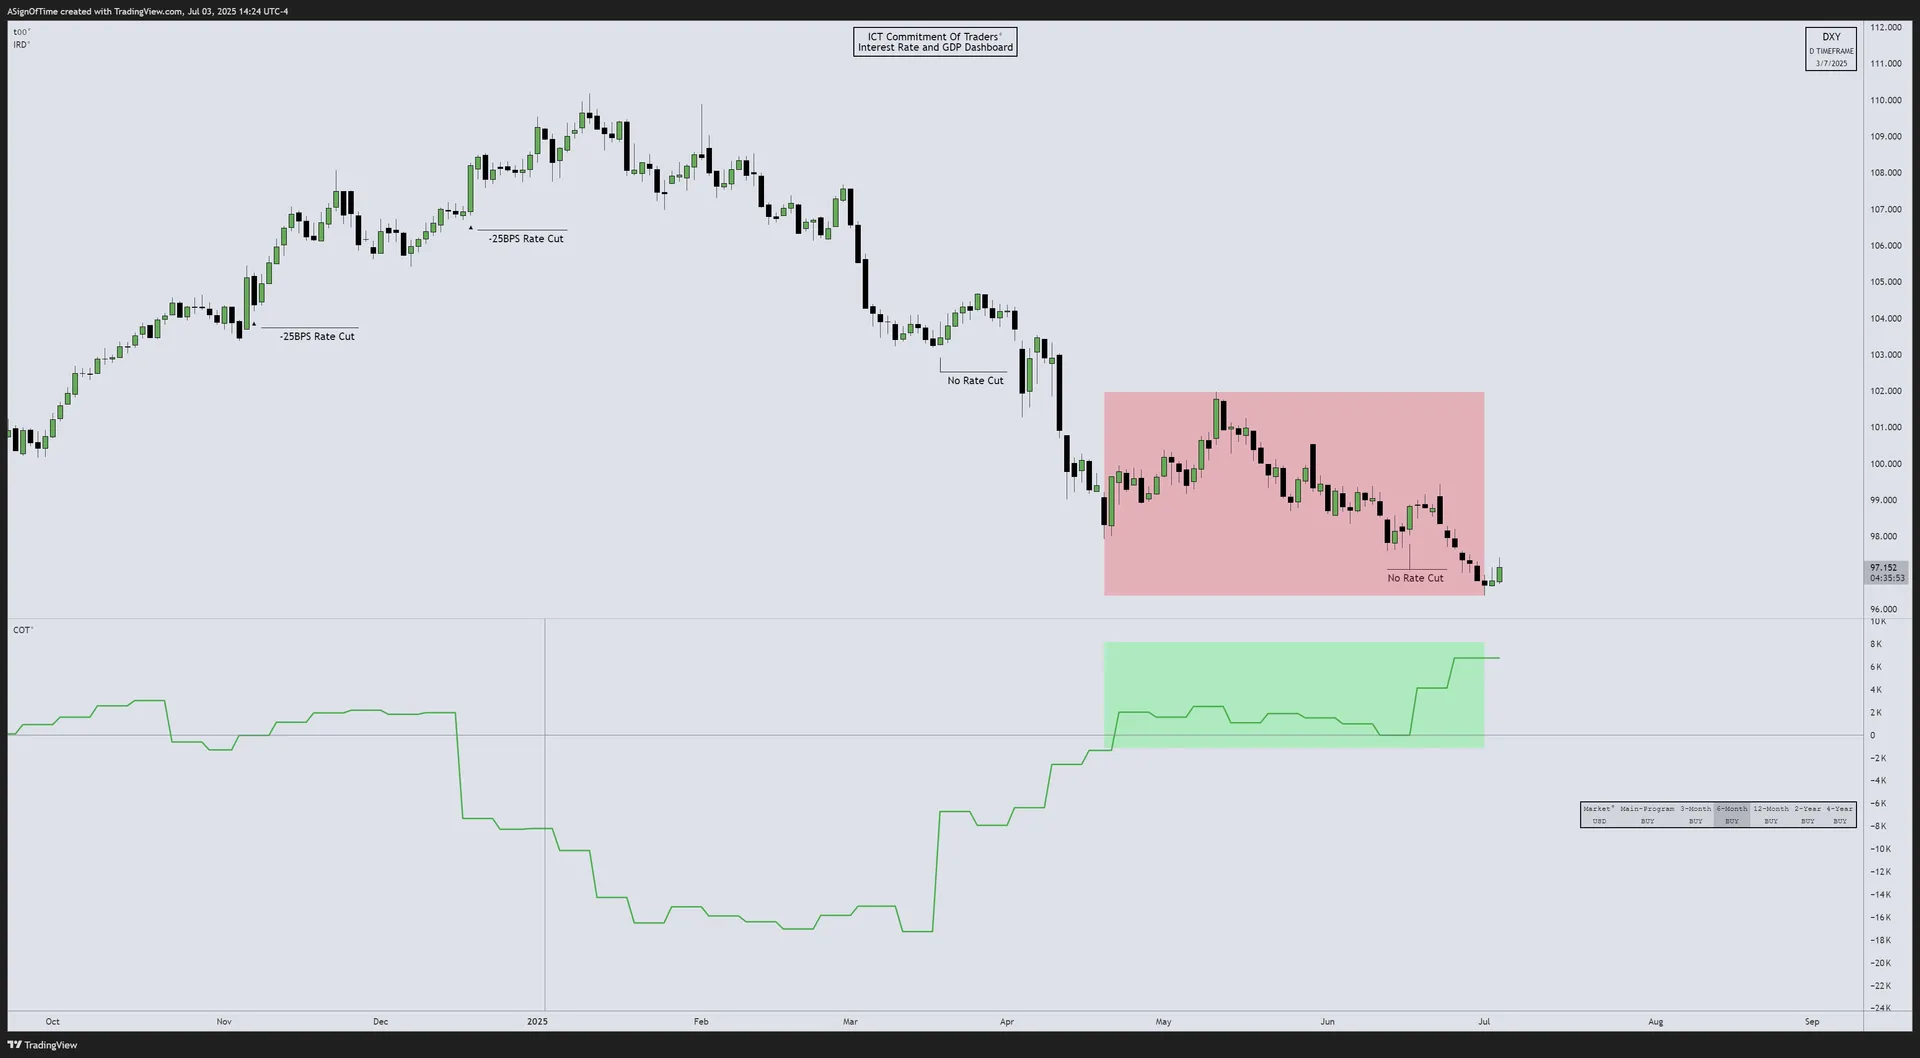
DXY Commitment of Traders
Commercials have materially increased their net long positions in DXY futures — from slightly negative in May to roughly +7,500 contracts by early July. Non-commercial traders unwound longs during this period, suggesting smart money is positioning for a stronger U.S. dollar over the medium term.
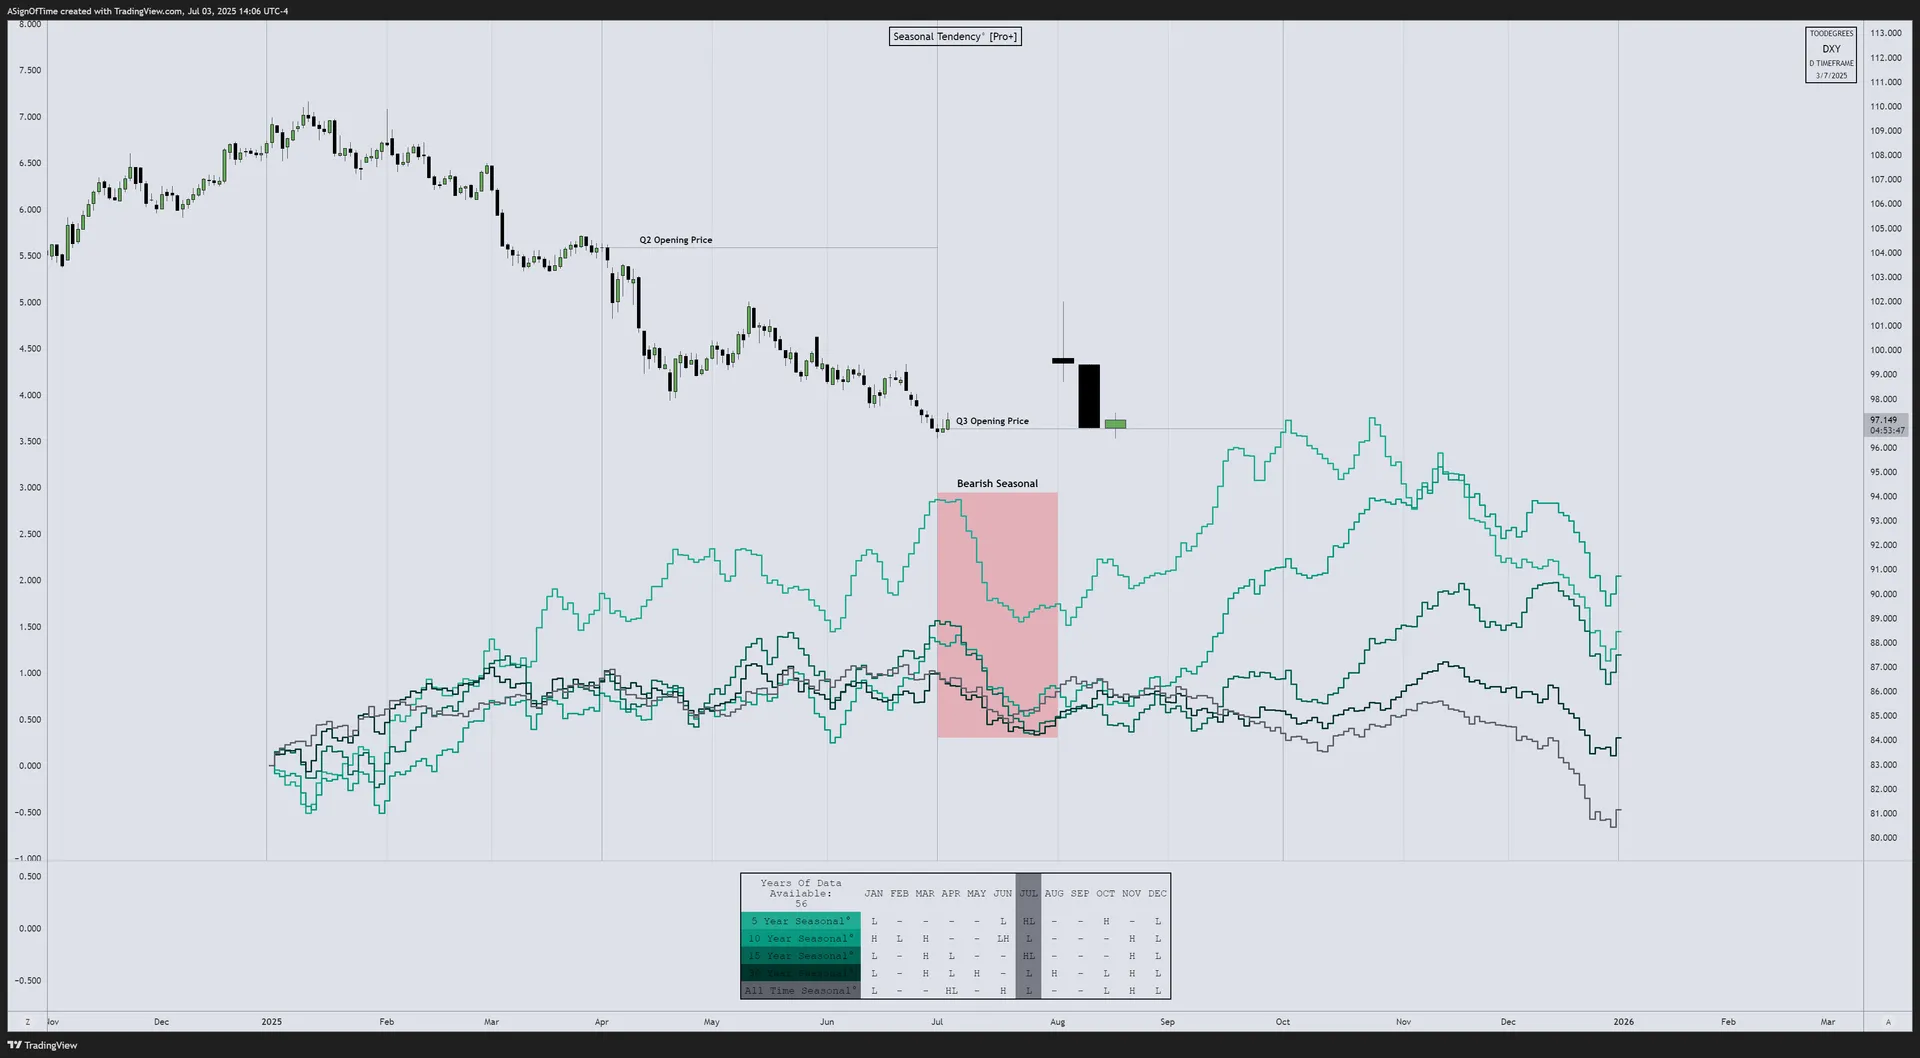
DXY Seasonality Analysis
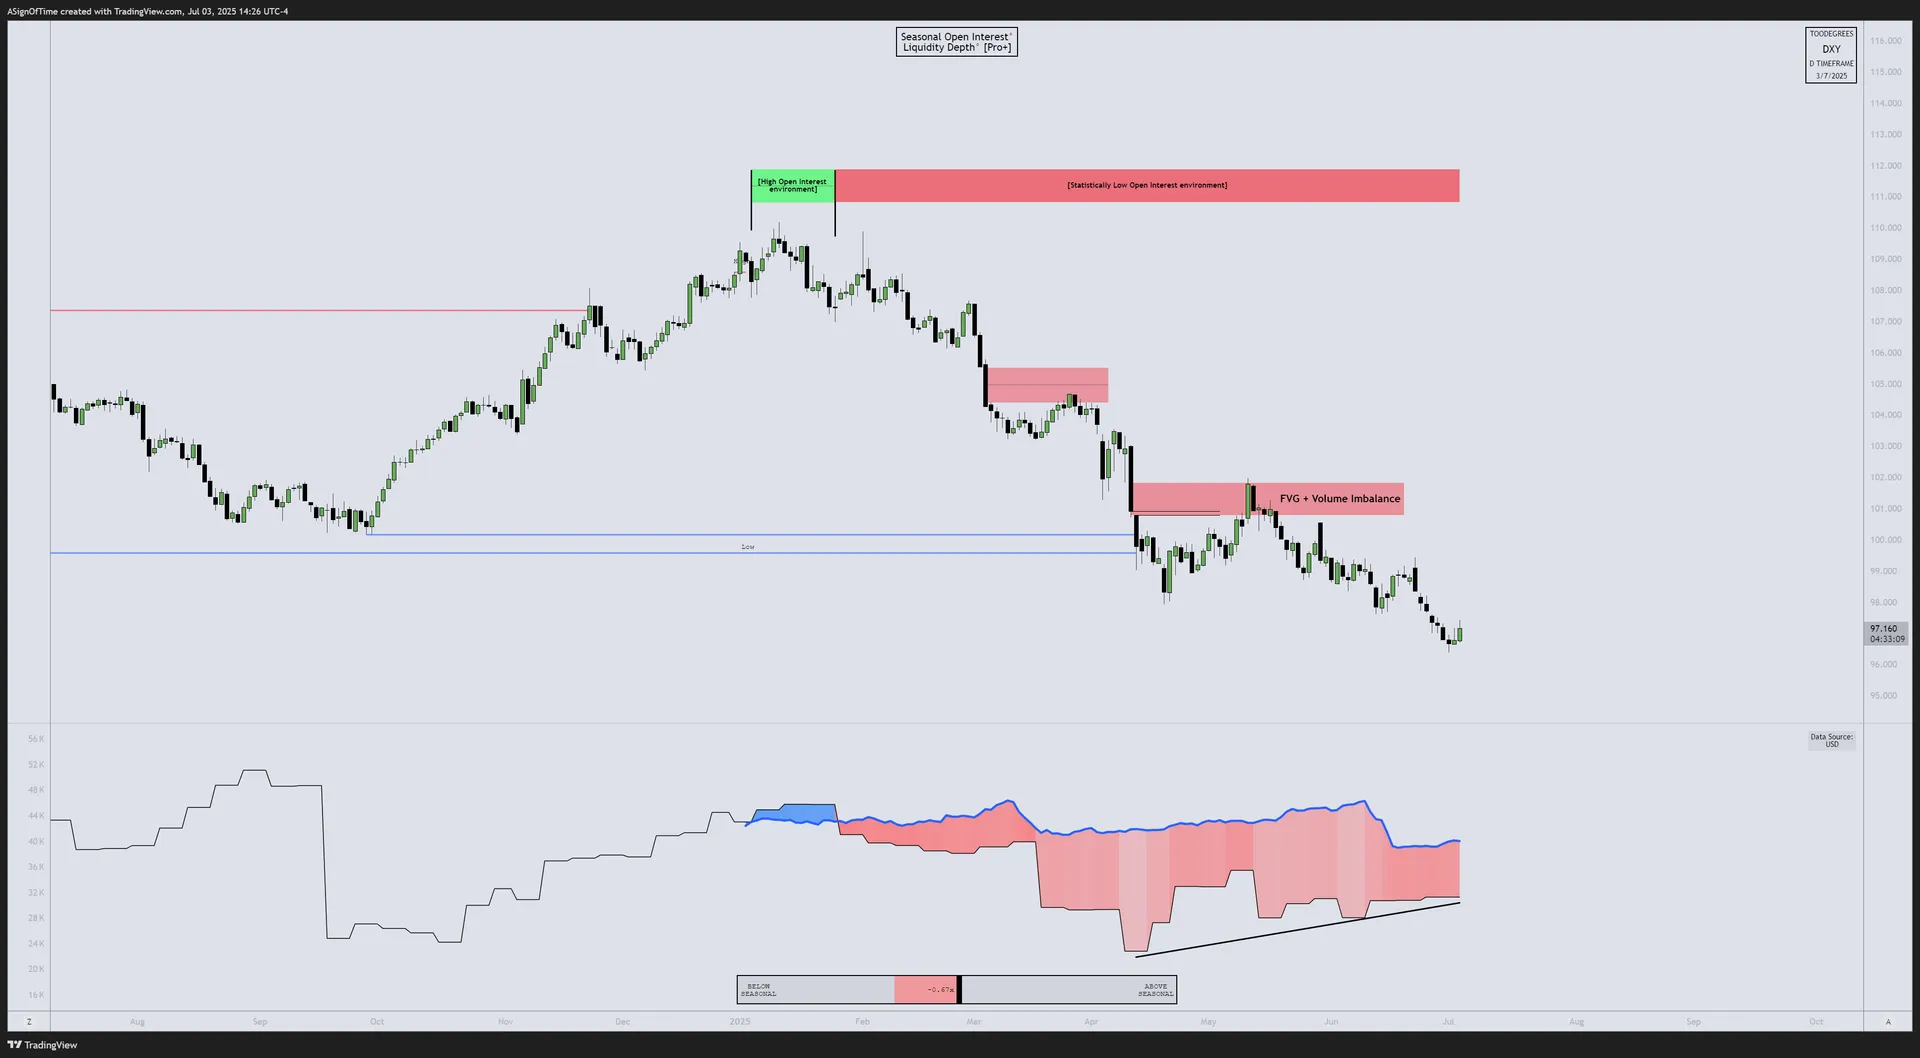
DXY Open Interest
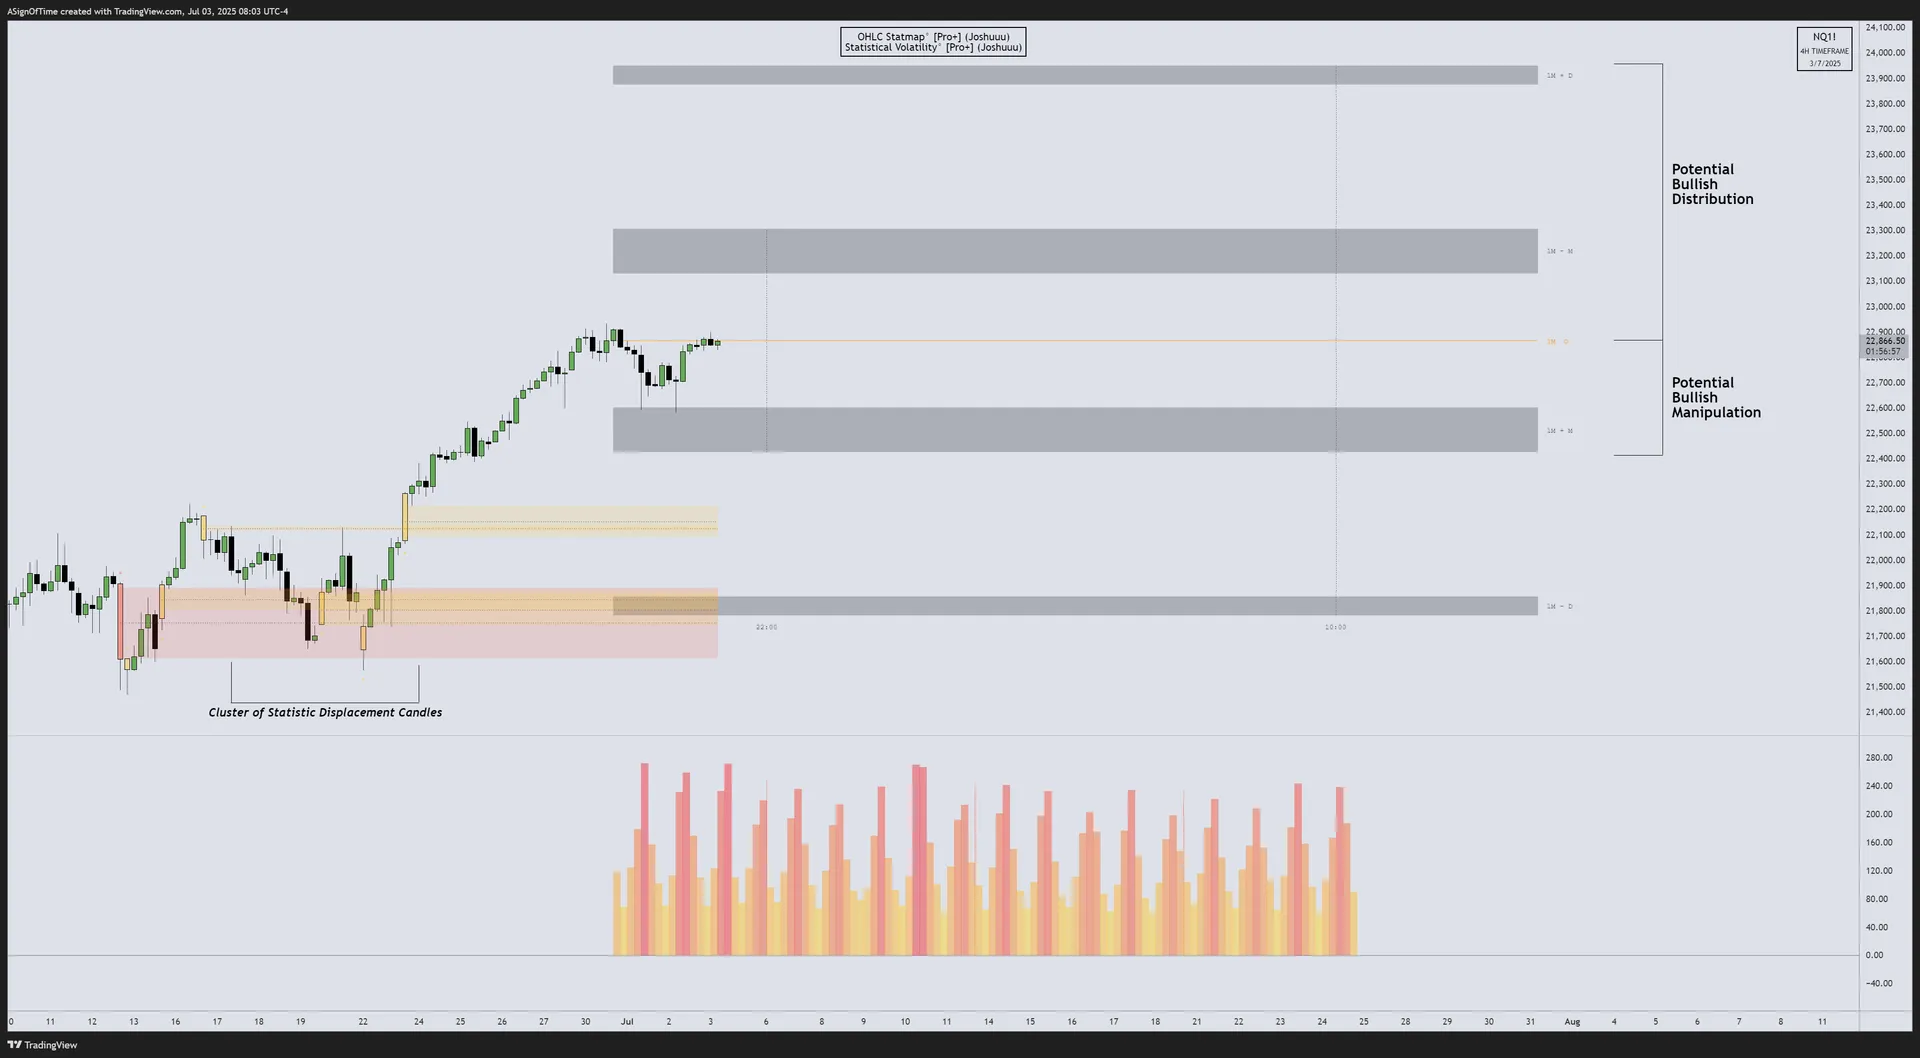
DXY Technical Analysis — OHLC Statistical Mapping
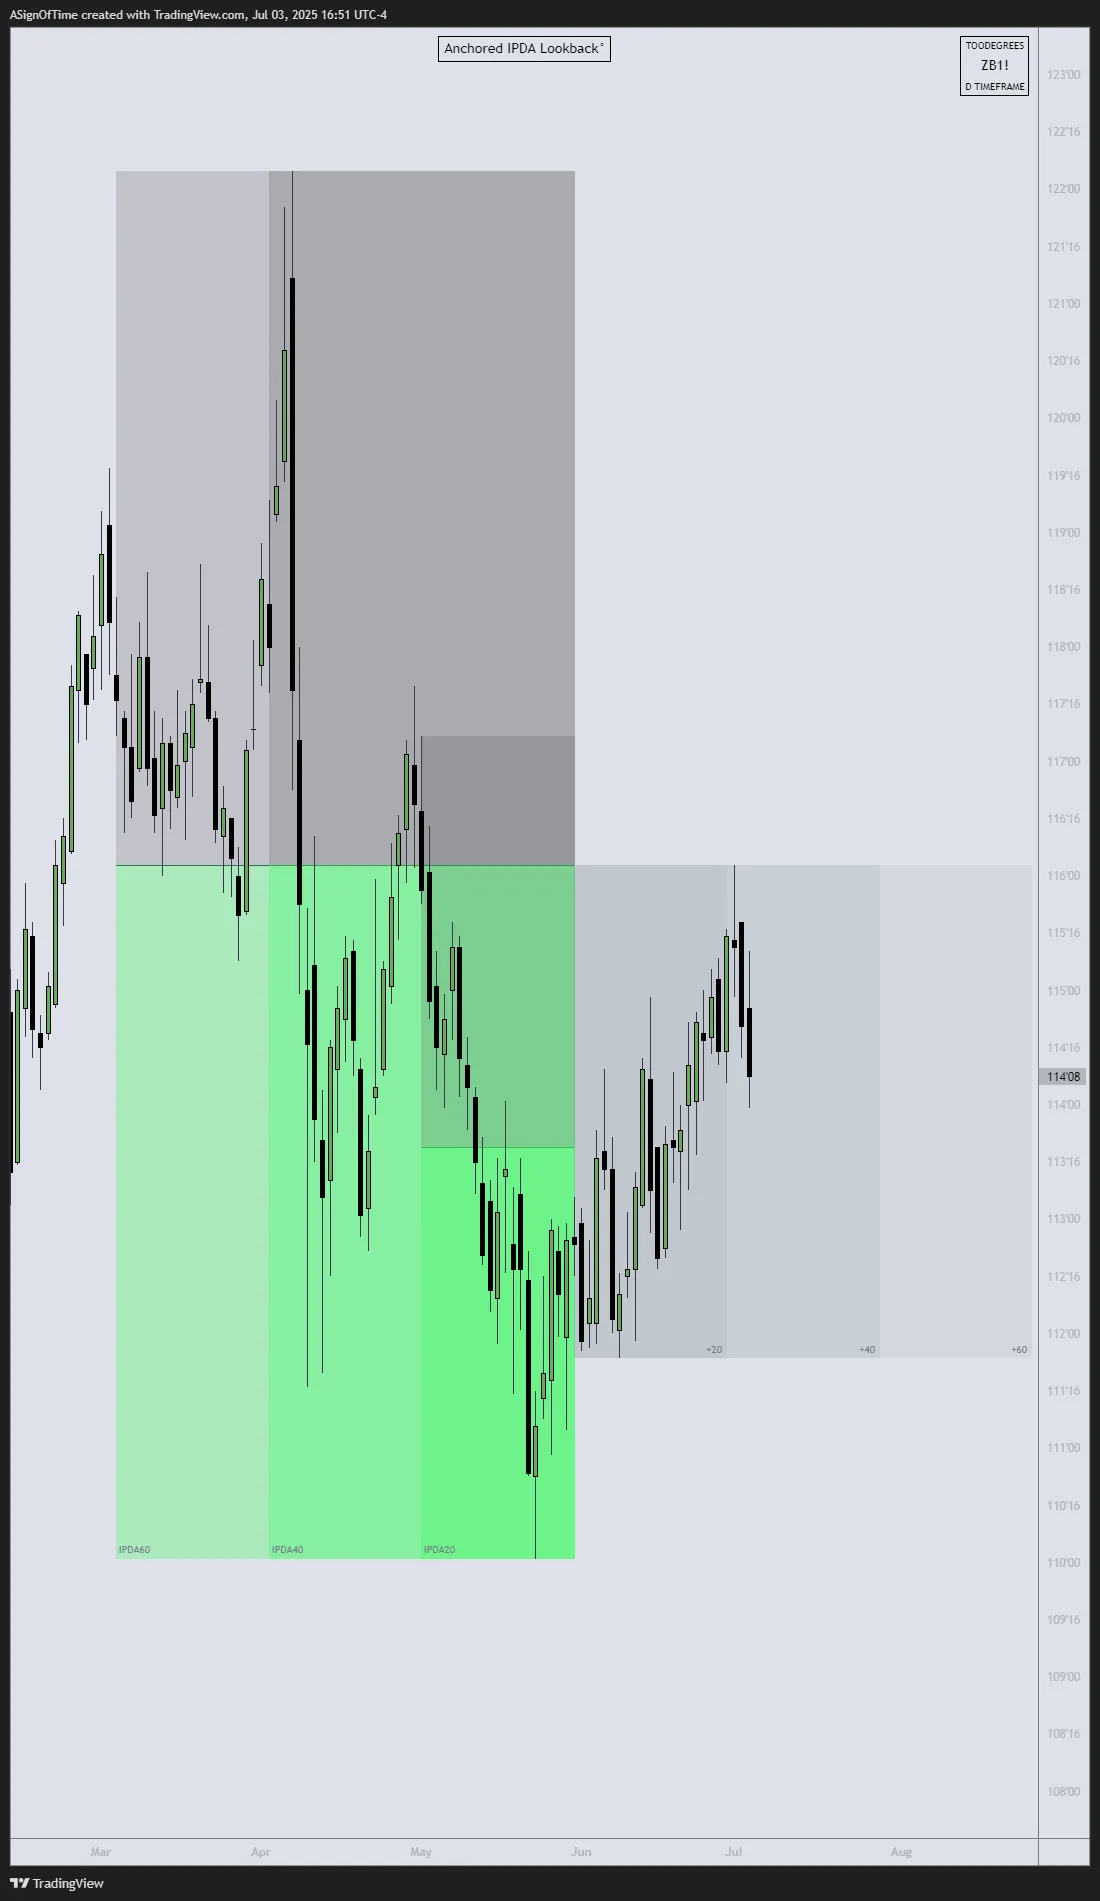
Multi-Asset Bond Futures — June Anchored
IPDA Lookback anchored at June across three US Bond Futures: ZB (30-Year T-Bond), ZN (10-Year T-Note), and ZF (5-Year T-Note).
[30-YEAR T-BOND $ZB]
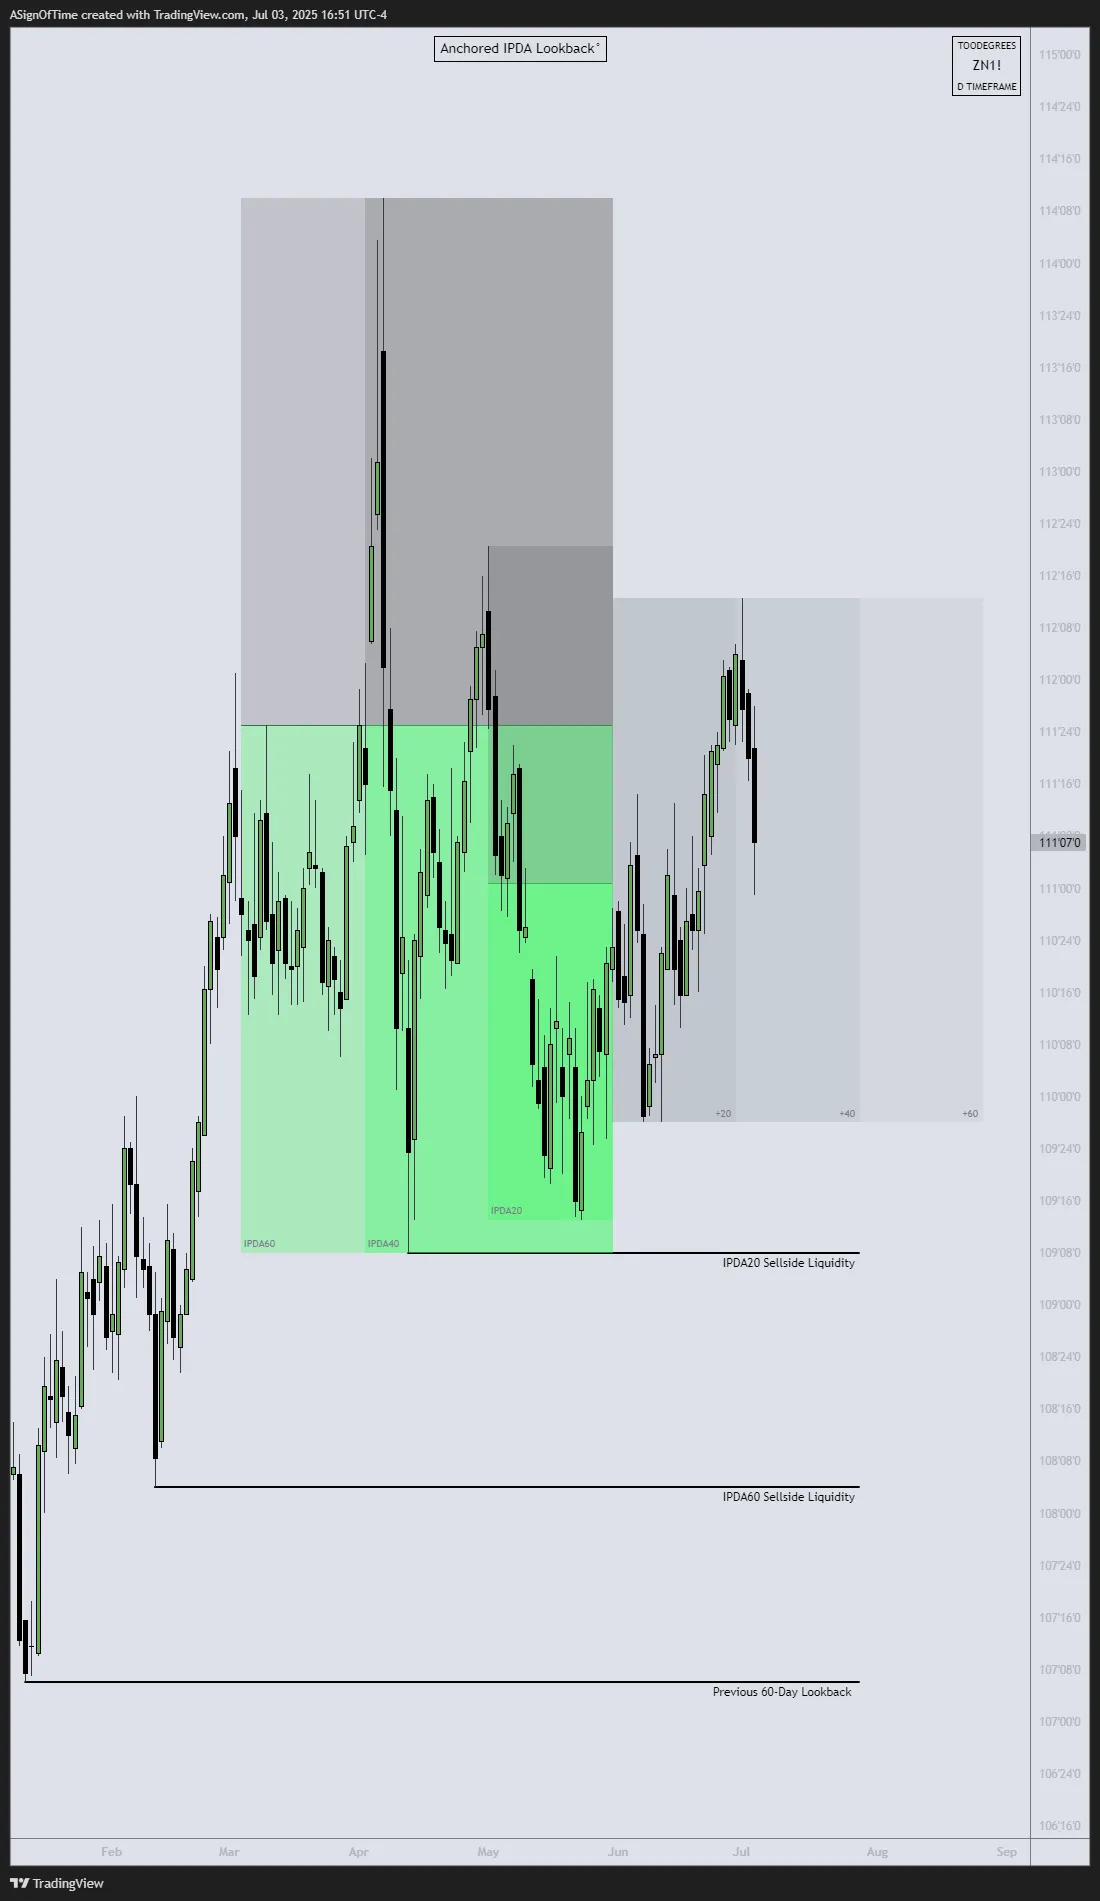
[10-YEAR T-NOTE $ZN]
[5-YEAR T-NOTE $ZF]
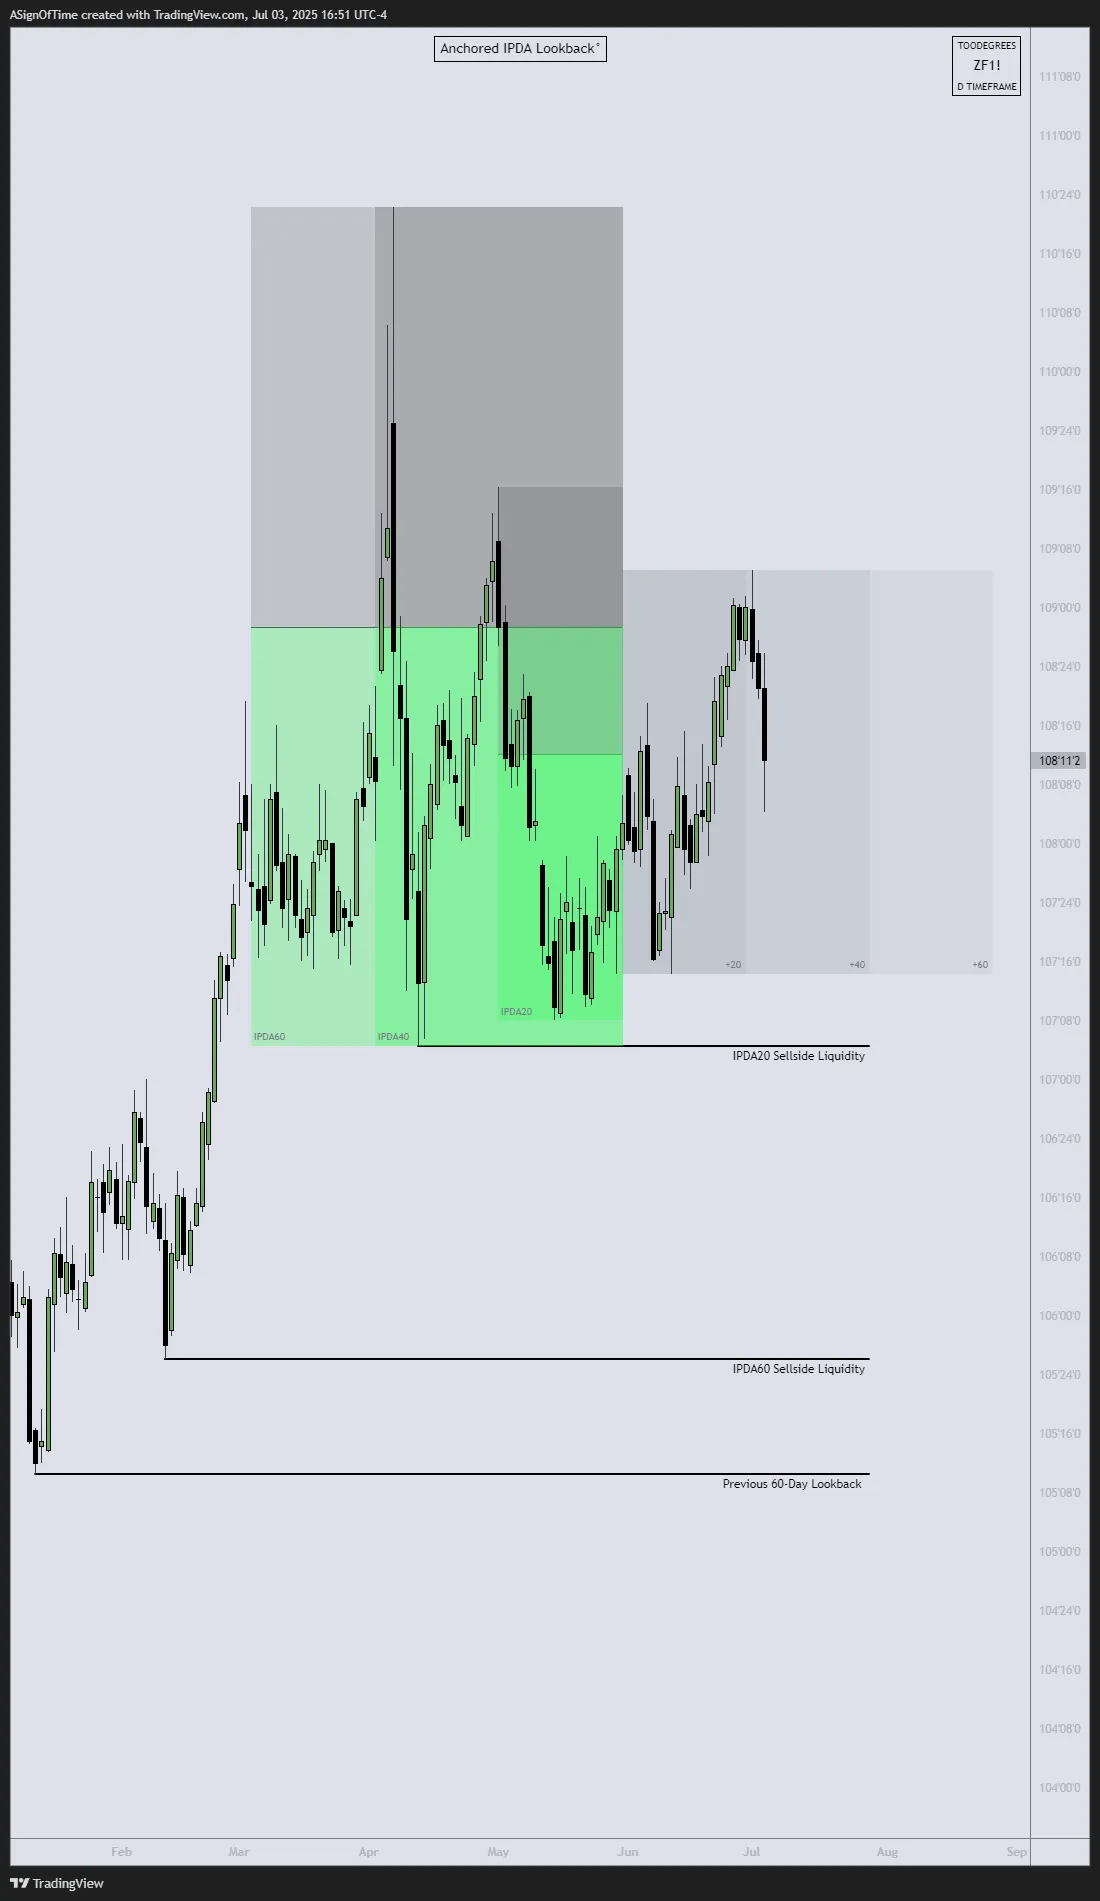
Analyst Insight
ZF (5-year) and ZN (10-year) traded within but not beyond their June-anchored 60-day buyside liquidity pools, indicating controlled range-bound activity. ZB (30-year) remains the weakest, failing to reclaim its range after a deeper June sell-off. Institutional demand is concentrated in shorter maturities, while the long bond lacks conviction at key liquidity levels.
Yield Curve — US Treasuries
In early July 2025, the 2-year Treasury is at 3.80%, 10-year at 4.34%, 30-year at 4.86%. The curve remains upward-sloping but flattening pressure persists, suggesting growing caution about growth and Fed policy direction. This upward-sloping curve signals growth optimism, though the narrowing spread reflects increasing uncertainty.
Inter-Market Dynamics Summary
| Metric | NQ | DXY | T-Bonds |
|---|---|---|---|
| Orderflow | Bullish → Bullish | Bearish → Bearish | Bullish → Bearish |
| Seasonality | Bullish → Bullish | Sideways → Sideways | Sideways → Sideways |
| Open Interest | Declining (Q2 expiry) | Rising | Mixed |
| COT Report | Commercial Long | Net Long Building | Mixed |
| Interest Rate | — | 4.25%–4.5% | — |
Format: Previous Report → Current Report
Section 4
Additional Resources
Free TradingView Tools
Interest Rate & GDP Dashboard
by toodegrees — Free on TradingView
ICT Anchored IPDA Ranges
by toodegrees — Free on TradingView
ICT Commitment of Traders
by toodegrees — Free on TradingView
Seasonal Open Interest
by toodegrees — Free on TradingView
Community Resources
Toodegrees Library
Access all EOM Reports & premium content
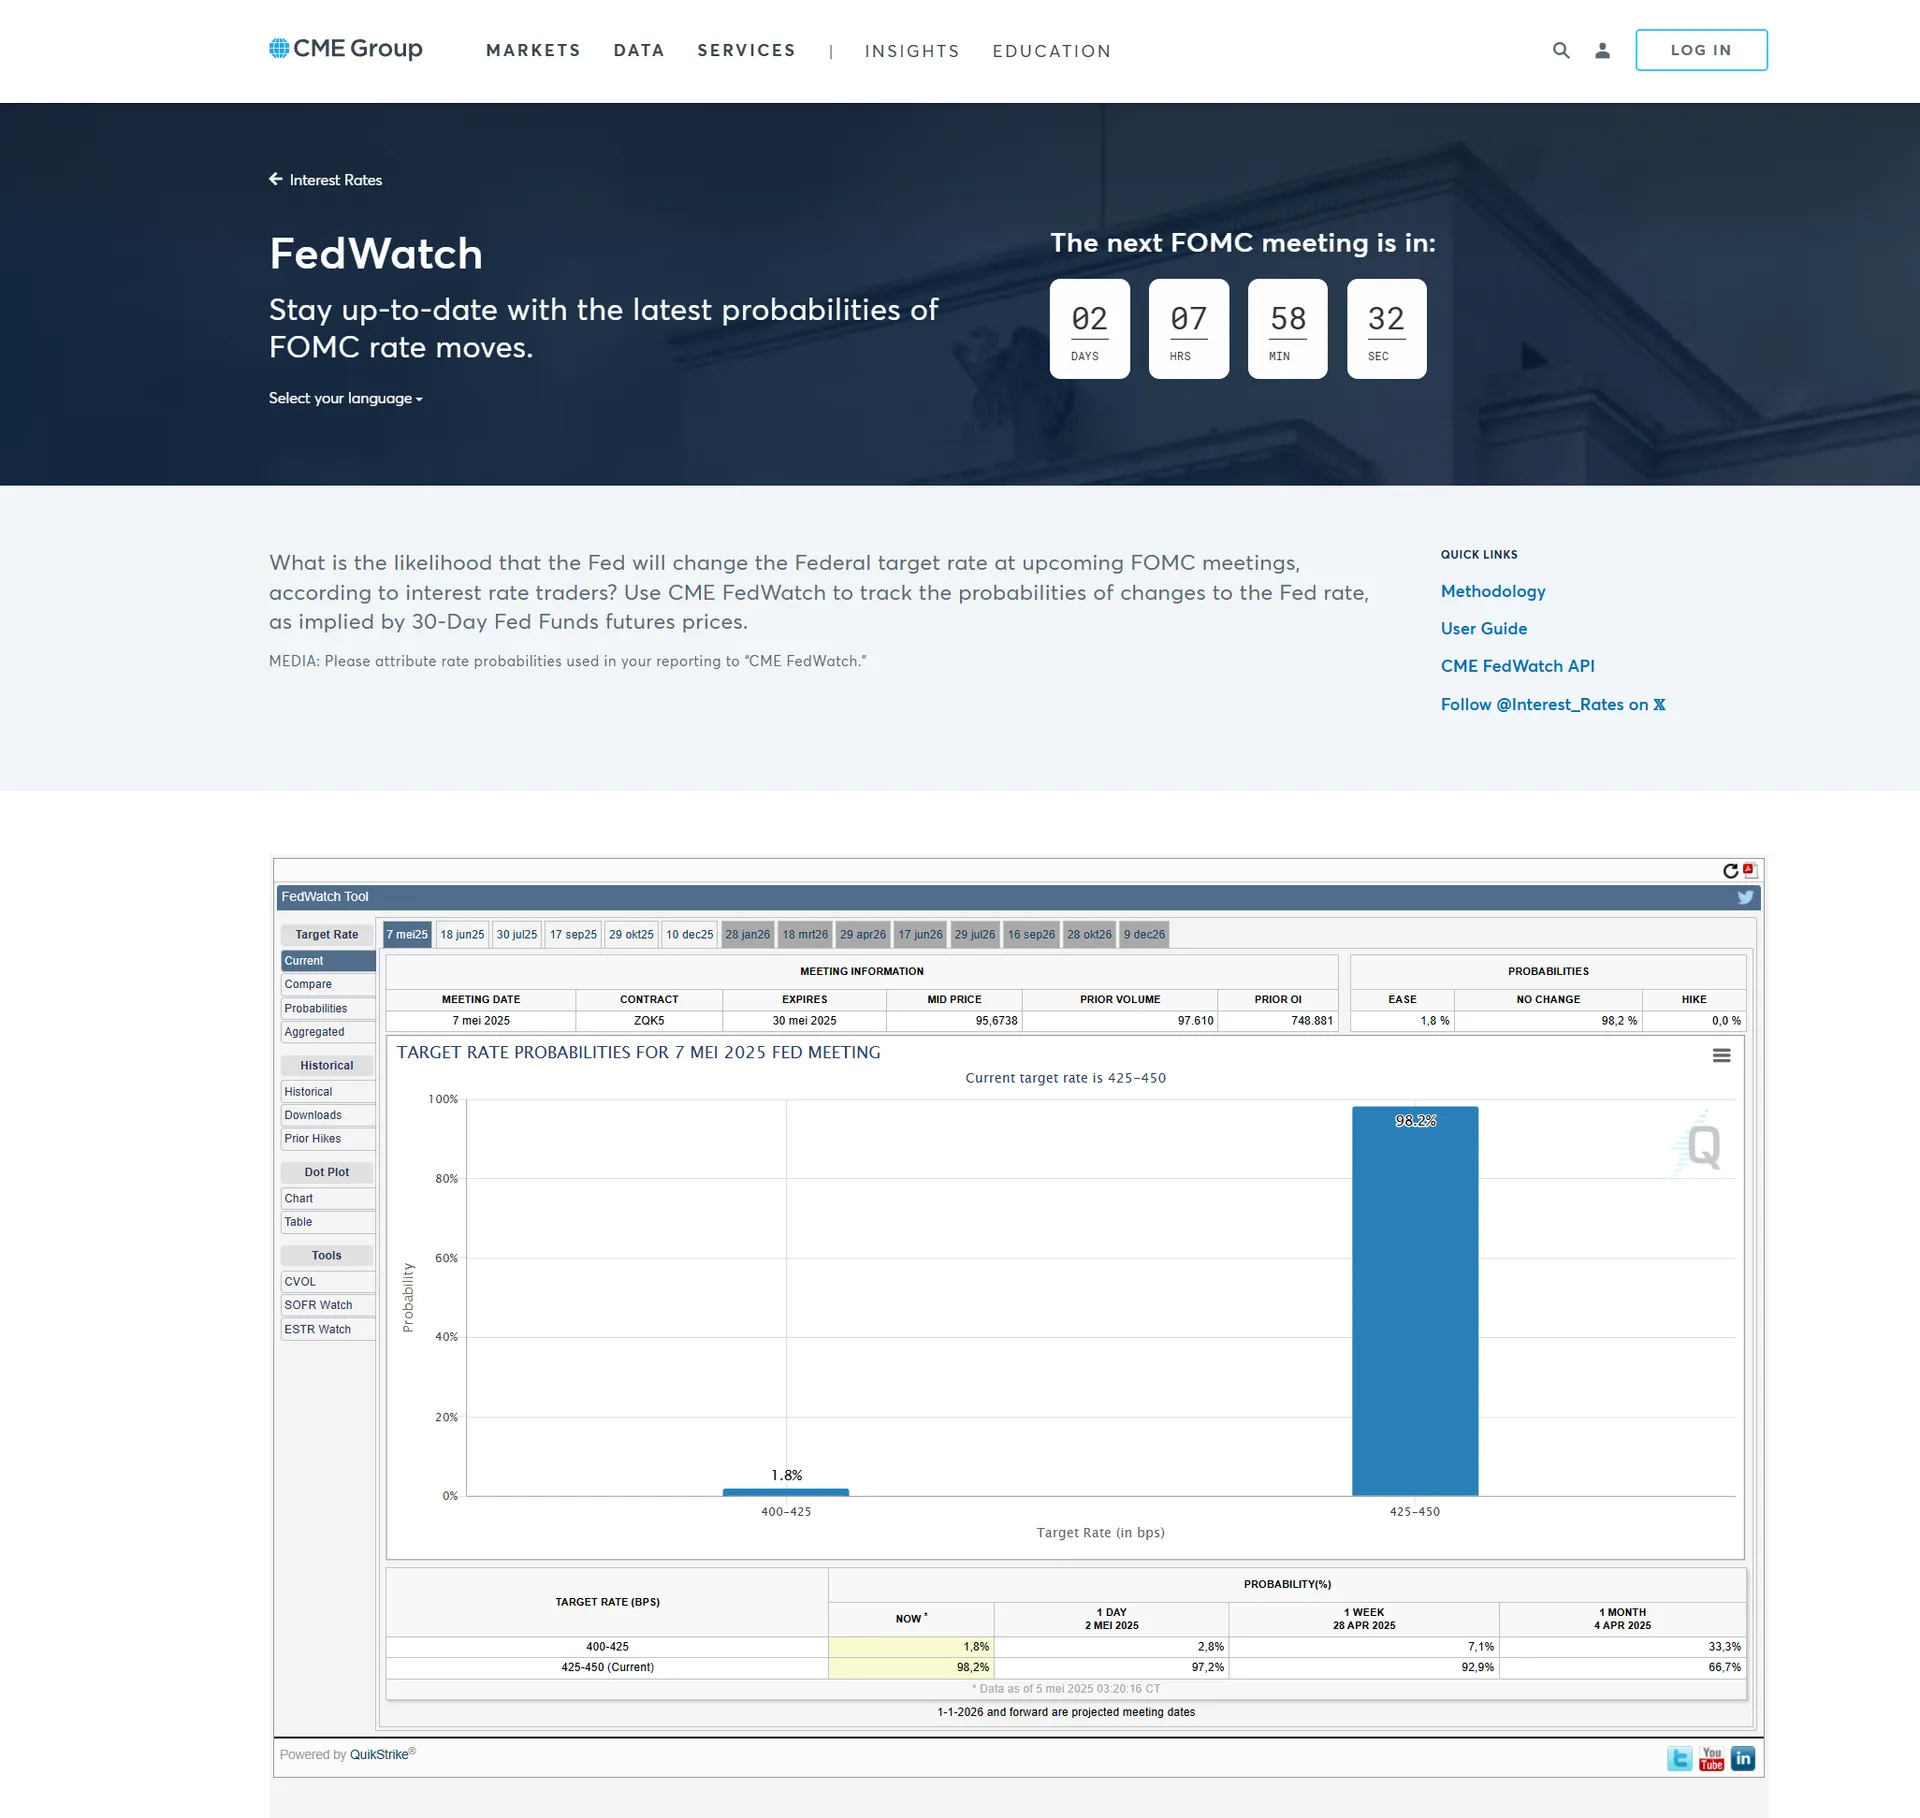
CME FedWatch Tool
Track Federal Reserve rate probability

June EOM Livestream
Full June analysis walkthrough on YouTube
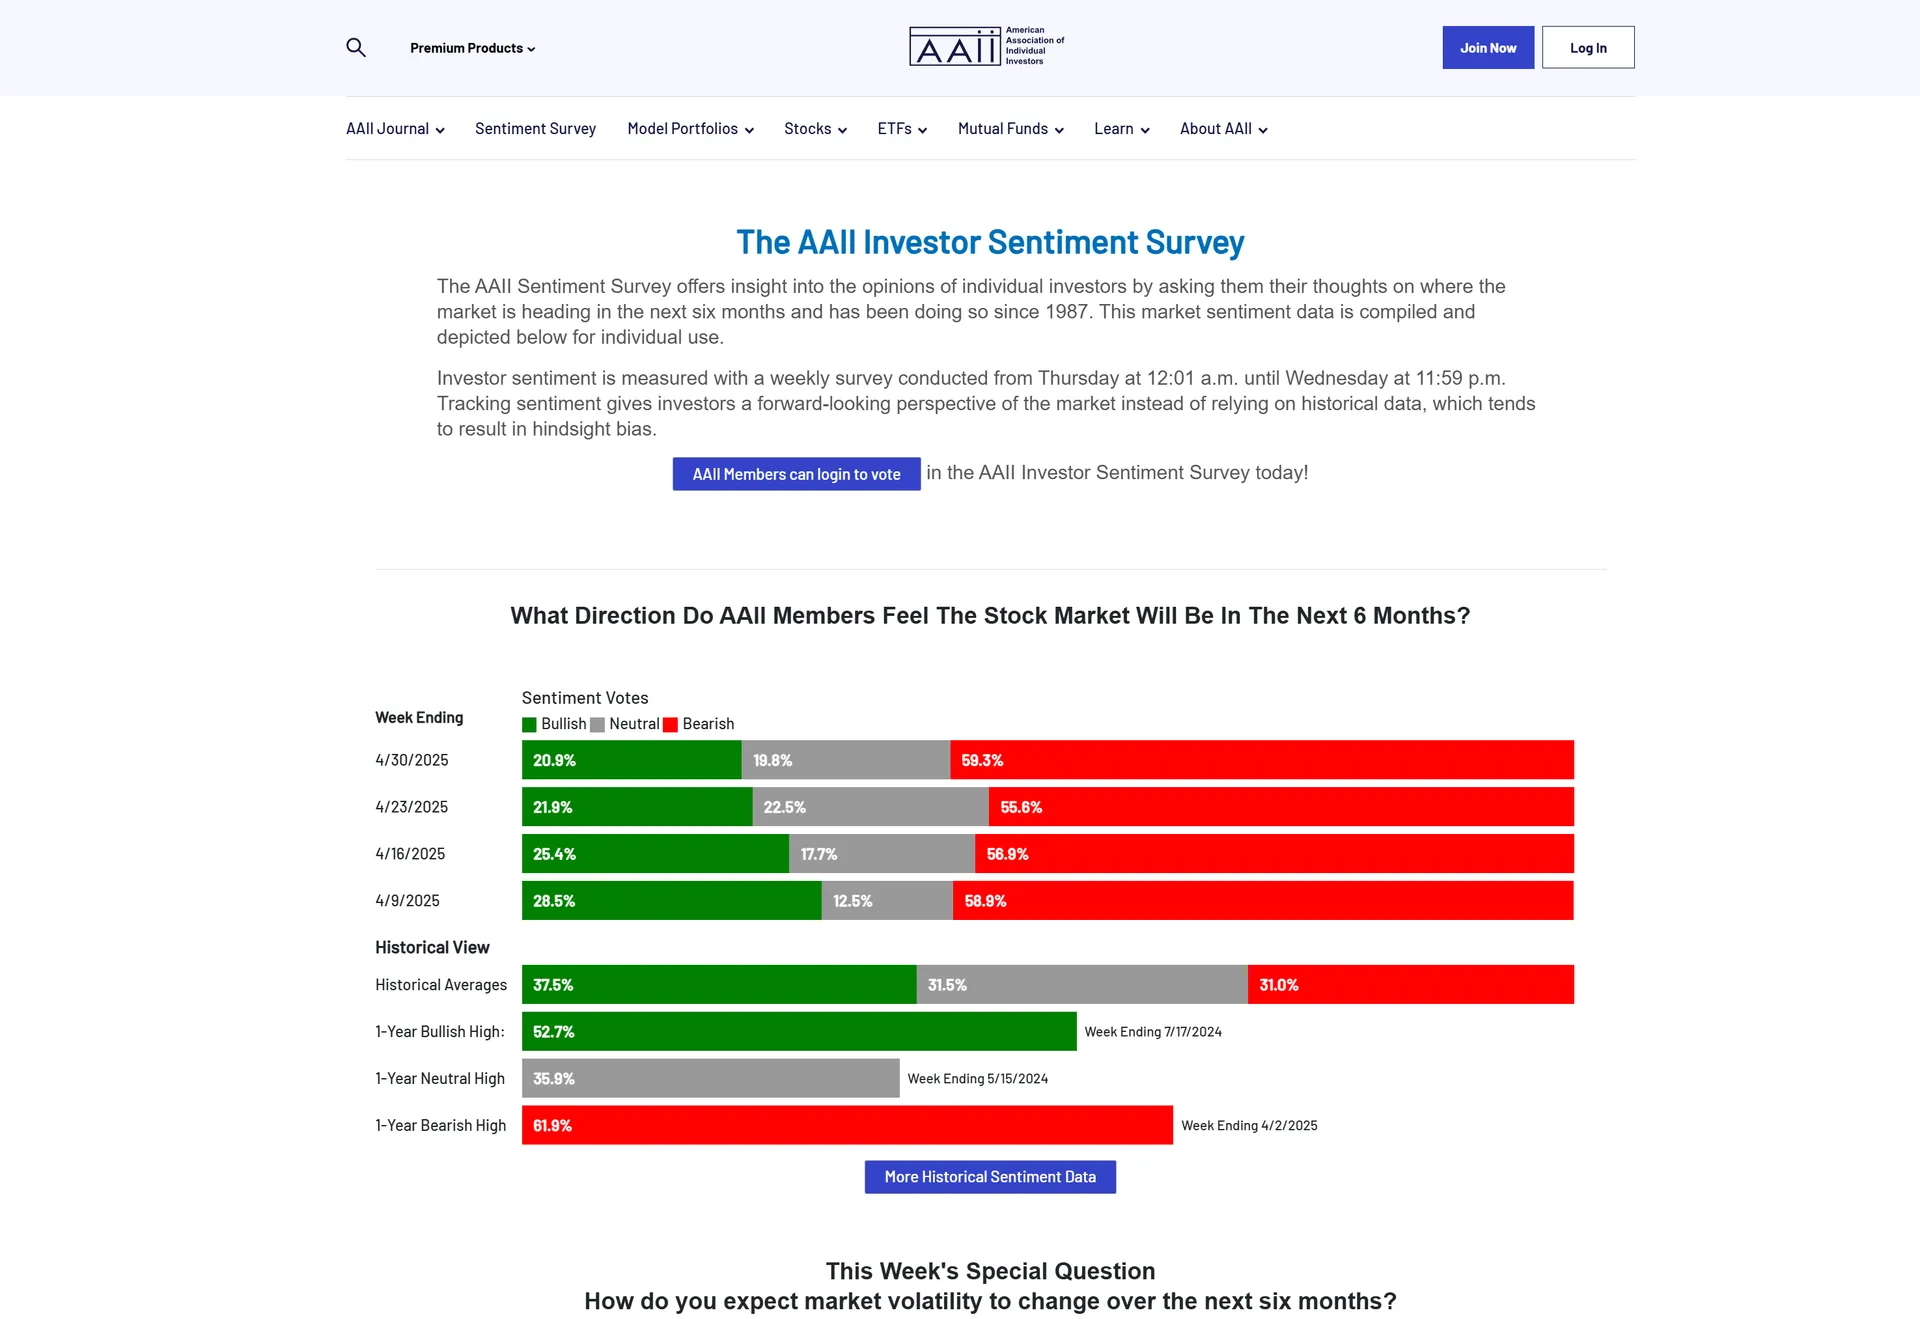
AAII Investor Sentiment Survey
Historical sentiment data & video breakdown
Follow Toodegrees
Section 5
Conclusion — Analysis Recap
June's advance reinforced improving price structure across asset classes. Equity futures hit the yearly highs outlined in the previous report, with NQ and ES leading. The Q2 DXY quarterly candle closed deeply bearish, with commercial COT revealing smart money quietly building long DXY positions — suggesting a counter-trend recovery ahead.
Bond futures remain mixed: shorter-dated instruments held within liquidity zones while the long bond underperformed. The yield curve remains upward-sloping but flattening pressure persists. Seasonal tailwinds are fading into July, removing a key layer of confluence. Overall, June's advance reinforced improving structure, yet mixed positioning and waning seasonal support counsel prudence as markets head into Q3.
Toodegrees Library