May 2025 EOM Report — Inter Market Dynamics

Written by
A Sign Of Time
Head of Education & Toodegrees Analyst
Section 1
Monthly Recap — US Indices
Recent Events
U.S. Stock Market Recovery
After a turbulent April, U.S. equity markets staged a notable rebound in May, driven by easing macroeconomic concerns, resilient corporate earnings, and growing optimism around potential Federal Reserve rate cuts later this year.
The S&P 500 rebounded nearly 4.2%, while the Nasdaq-100 led gains with a 5.8% surge, recovering much of its April losses. The Dow Jones Industrial Average also expanded higher around 3.1%, supported by strength in industrials and healthcare.
Key Drivers Behind the Recovery
Cooling Inflation: Core PCE data and CPI figures showed inflation continuing to decelerate, bolstering hopes that the Fed might begin easing by Q3.
Resilient Earnings Season: Tech giants such as Microsoft, Nvidia, and Alphabet delivered strong earnings, with Nvidia's blowout results lifting overall market sentiment around AI-related growth.
Fed Policy Repricing: After April's rate-hold stance, markets began pricing in a higher probability of rate cuts beginning in September, fueling risk-on appetite across sectors.
Improved Risk Sentiment: Volatility receded (VIX dropped below 16 by late May), and flows returned to risk assets, particularly in growth sectors and small caps.
Stronger-than-expected Jobs Data: While the labor market showed signs of cooling, it remained far from recessionary, supporting a "soft landing" narrative.
Central Bank Policies
Three major central banks had monetary policy announcements in May:
Federal Reserve (FED)
Held the federal funds rate steady at 4.25%–4.50% for the third consecutive meeting, citing uncertainty around inflation and trade policy. Data-dependent stance maintained.
European Central Bank (ECB)
No policy change in May. Main refinancing rate stays at 2.40%. Forward guidance suggests a likely rate cut in June amid softening inflation and weak Eurozone growth.
Bank of England (BoE)
Held the interest rate at 2.25%, maintaining a cautious stance in light of global trade disruptions and domestic inflation uncertainty. No immediate easing signal.
May Results — US Index Futures
May was the strongest month of the year for US Index Futures. Nasdaq 100 Futures ($NQ) gained +9.6%, driven by strong earnings from tech giants and renewed enthusiasm around AI and semiconductor sectors. E-Mini S&P 500 ($ES) increased by +6.2% — marking the best May performance since 1990. E-Mini Dow Jones ($YM) rose +3.9%, led by industrial and healthcare sectors.
Footnote: $NQ = E-Mini Nasdaq 100 Futures · $ES = E-Mini S&P 500 Futures · $YM = E-Mini Dow Jones Futures
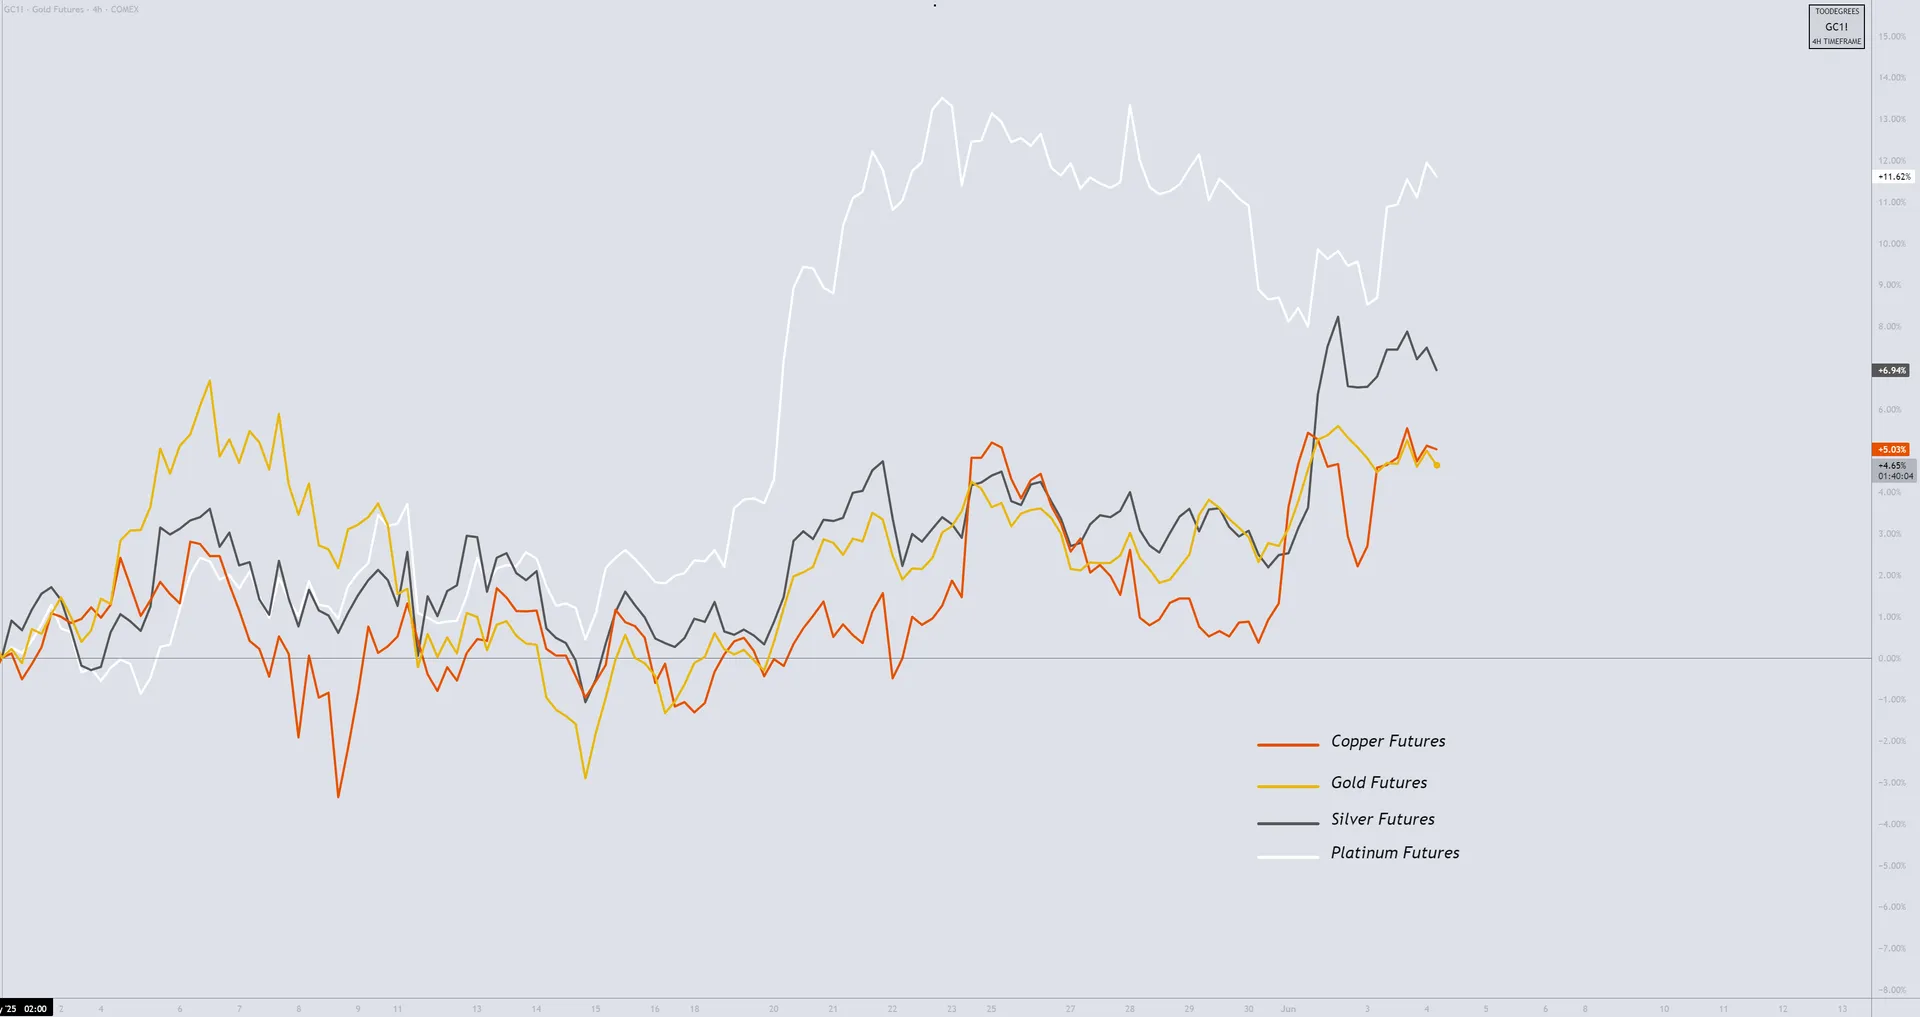
Industry & Sector Trends — Materials
The Materials sector emerged as a quiet, pivotal performer in May, drawing renewed investor interest amid a broader rotation into tangible, supply-constrained assets. A key force behind this resurgence is the AI infrastructure boom, which has elevated demand for industrial metals like copper — essential for data centers, electric grids, and semiconductors. Lithium and rare earth elements are back in focus as EV adoption accelerates globally and battery producers ramp up capacity.
On the geopolitical front, rising tensions and trade disruptions fueled a push for resource security and domestic supply chains, adding support to U.S.-based miners and processors. Precious metals such as gold and silver also saw increased flows, acting as hedges against volatility during uncertain monetary policy transitions.
Sentiment Analysis
Key Sentiment Drivers
Markets rebounded strongly in May, led by tech and AI stocks, with the S&P 500 and Nasdaq posting their best monthly gains of the year. Strong earnings and a return of risk appetite helped lift sentiment across sectors. Fears of a sweeping 20% tariff faded after the U.S. paused escalation plans, easing pressure on equities and signaling a more measured trade approach.
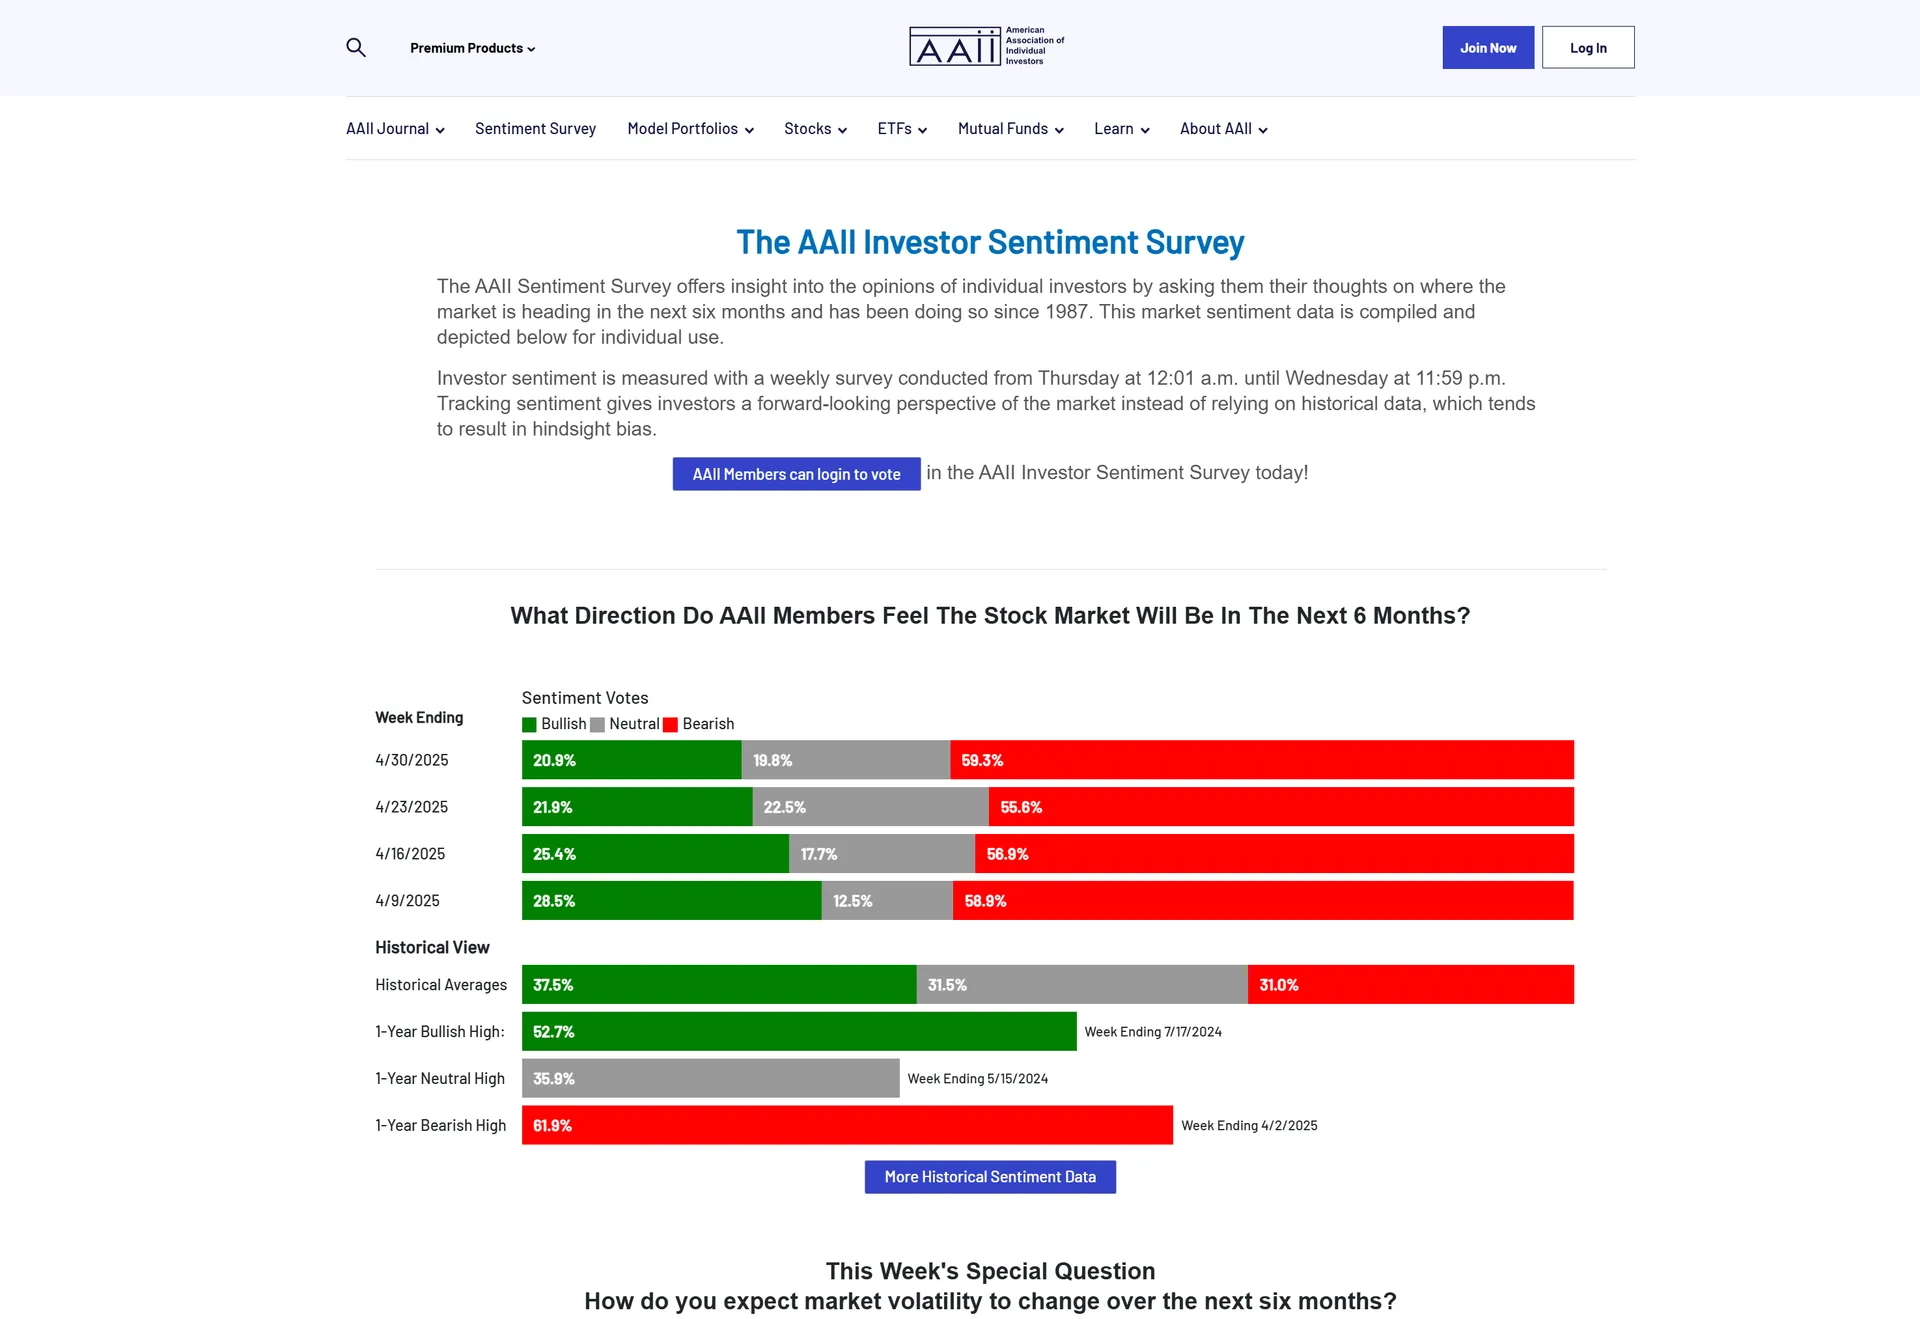
AAII Investor Sentiment Survey
On May 29th 2025, bullish sentiment stood at 32.9% — below the historical average but a notable improvement from April's 20.9%. Bearish sentiment decreased to 48.8% (down from 59.3% in April), reflecting a meaningfully less pessimistic investor outlook.
Fear and Greed Index
On June 4th, the Fear and Greed Index registered a value of 56 — Greed. This is a significant recovery from the previous report's value of 48 — Neutral, confirming the return of risk appetite across markets.
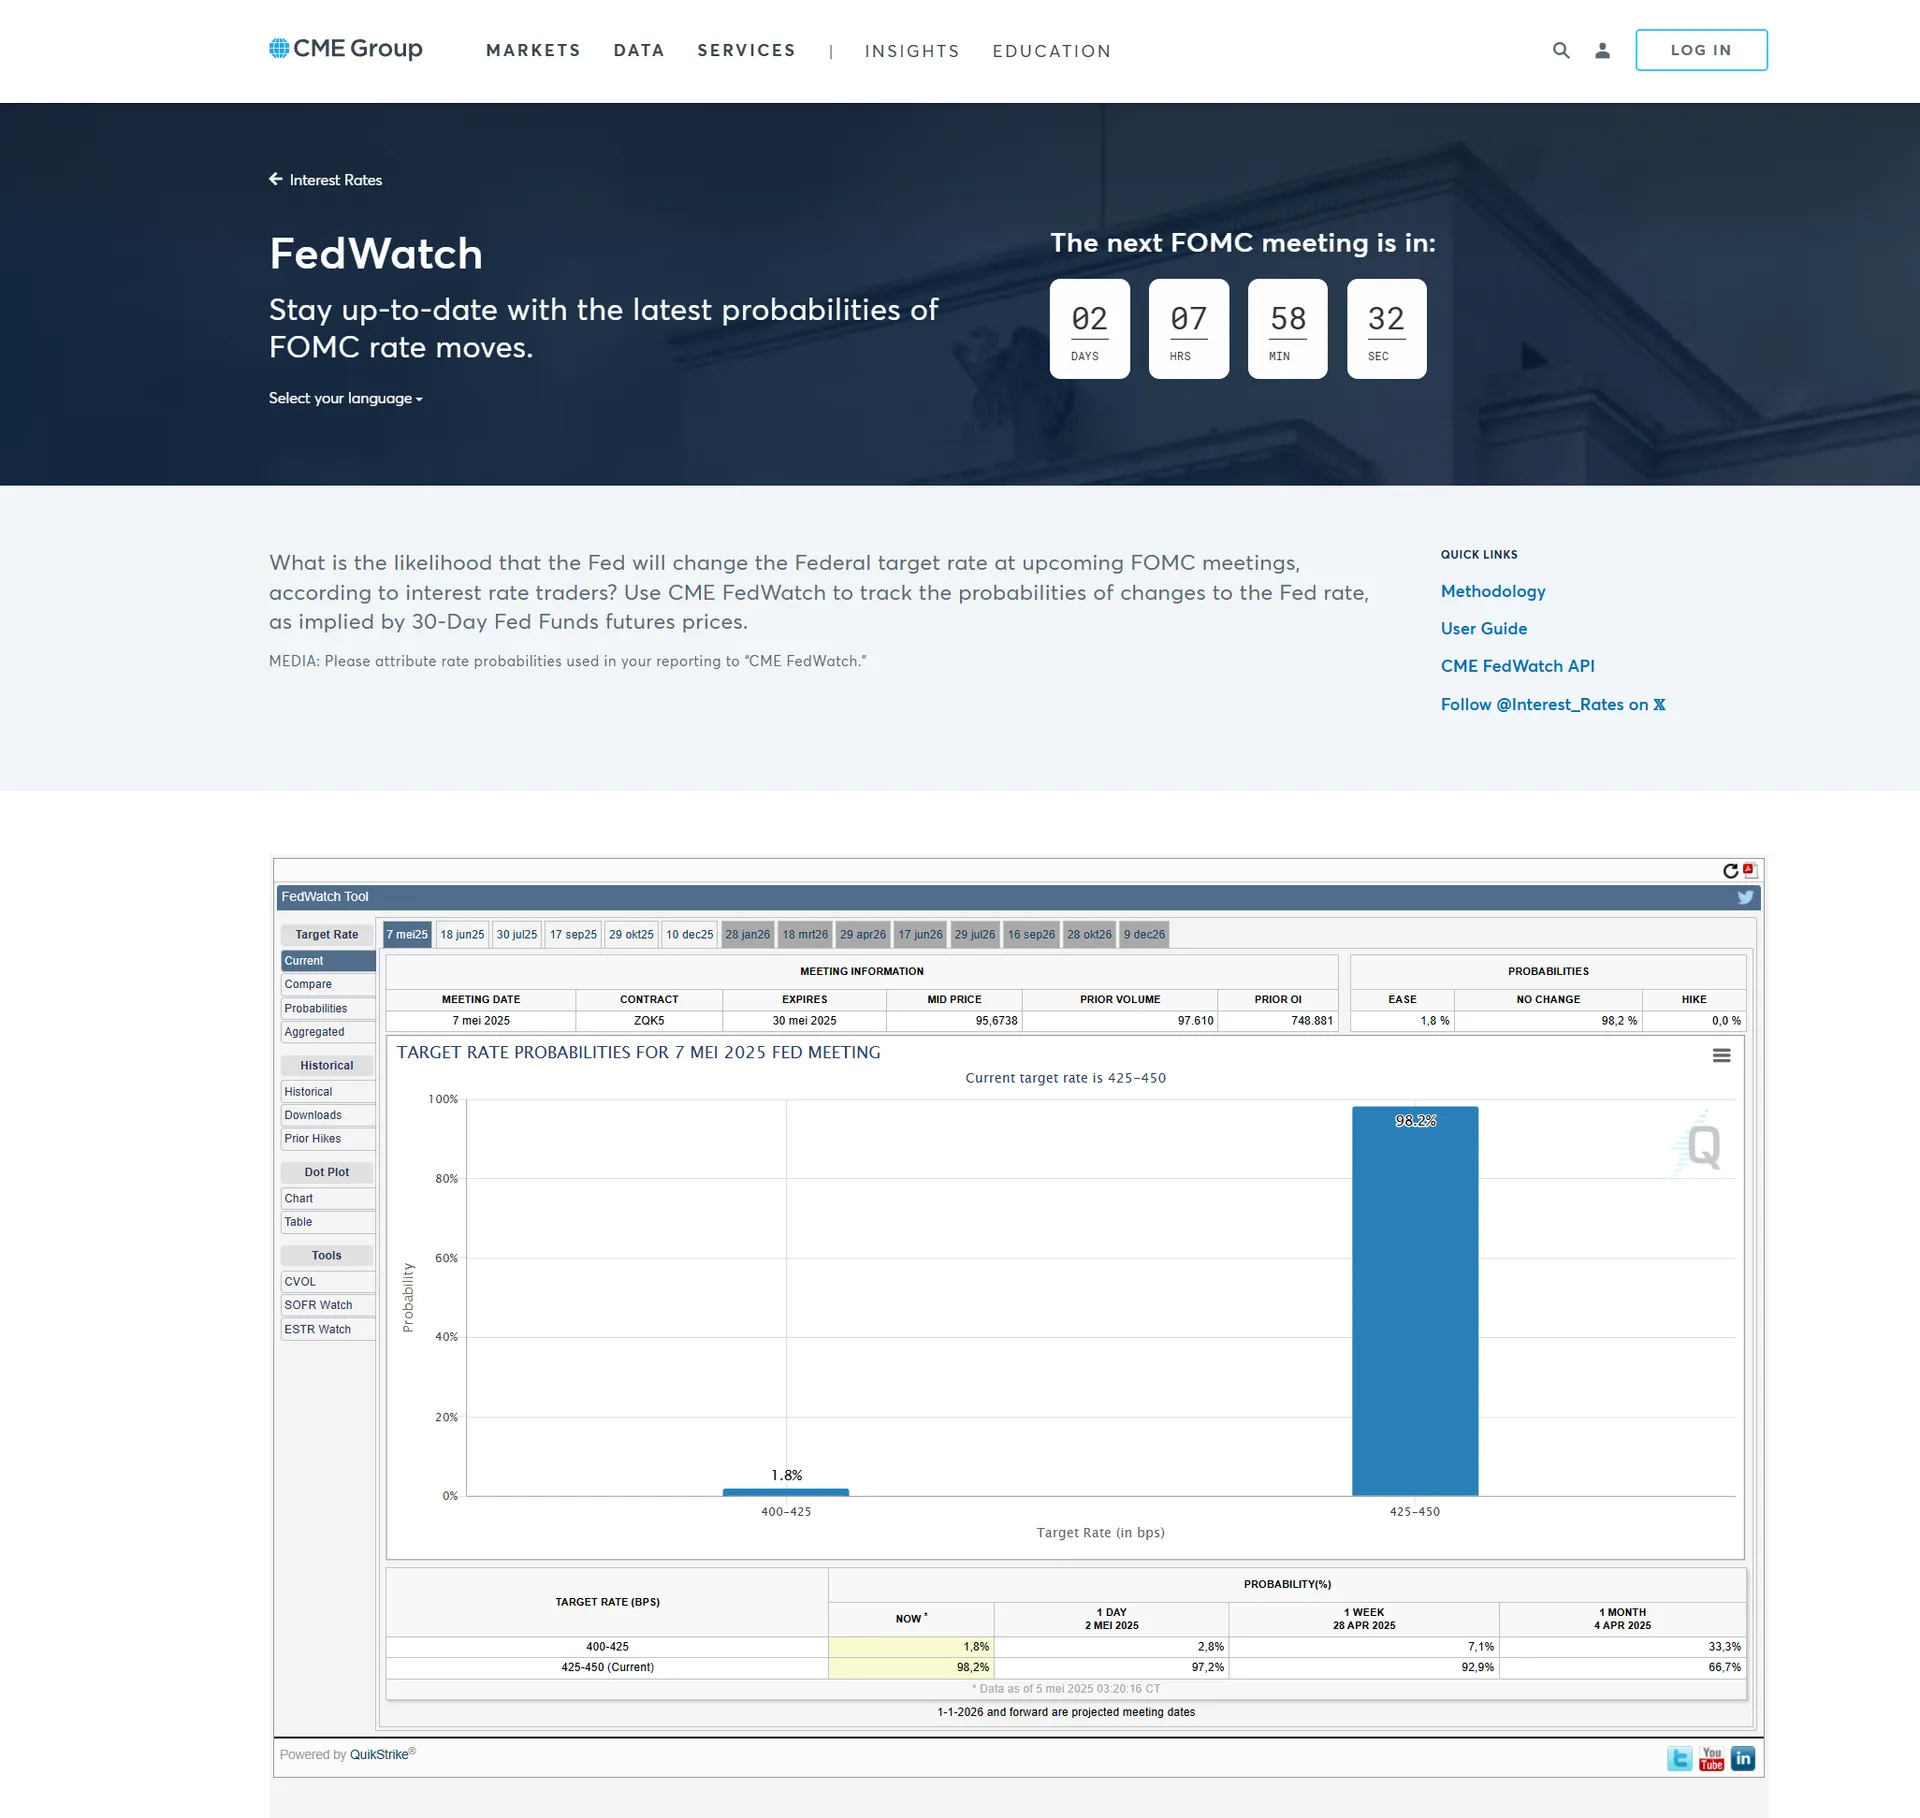
FedWatch Tool — FOMC June
The CME FedWatch Tool indicates a 98.8% probability that the Federal Reserve will maintain the current federal funds rate at 4.25%–4.50% in June. However, market expectations for cuts later in the year are increasing — traders are pricing in approximately a 75% chance of at least three 0.25% cuts by December 2025.
Section 2
Technical Analysis — Nasdaq 100 E-Mini Futures
Multi-Asset Analysis — IPDA Lookback (May 1st Anchored)
The IPDA Lookback tool has been anchored at the start of May. This allows us to view how May moved relative to the 60-day lookback, while also measuring Relative Strength across the three assets. The IPDA Lookback monitors time-based Liquidity Pools and PD Arrays from the last 20, 40, or 60 days.
[E-MINI NASDAQ 100]
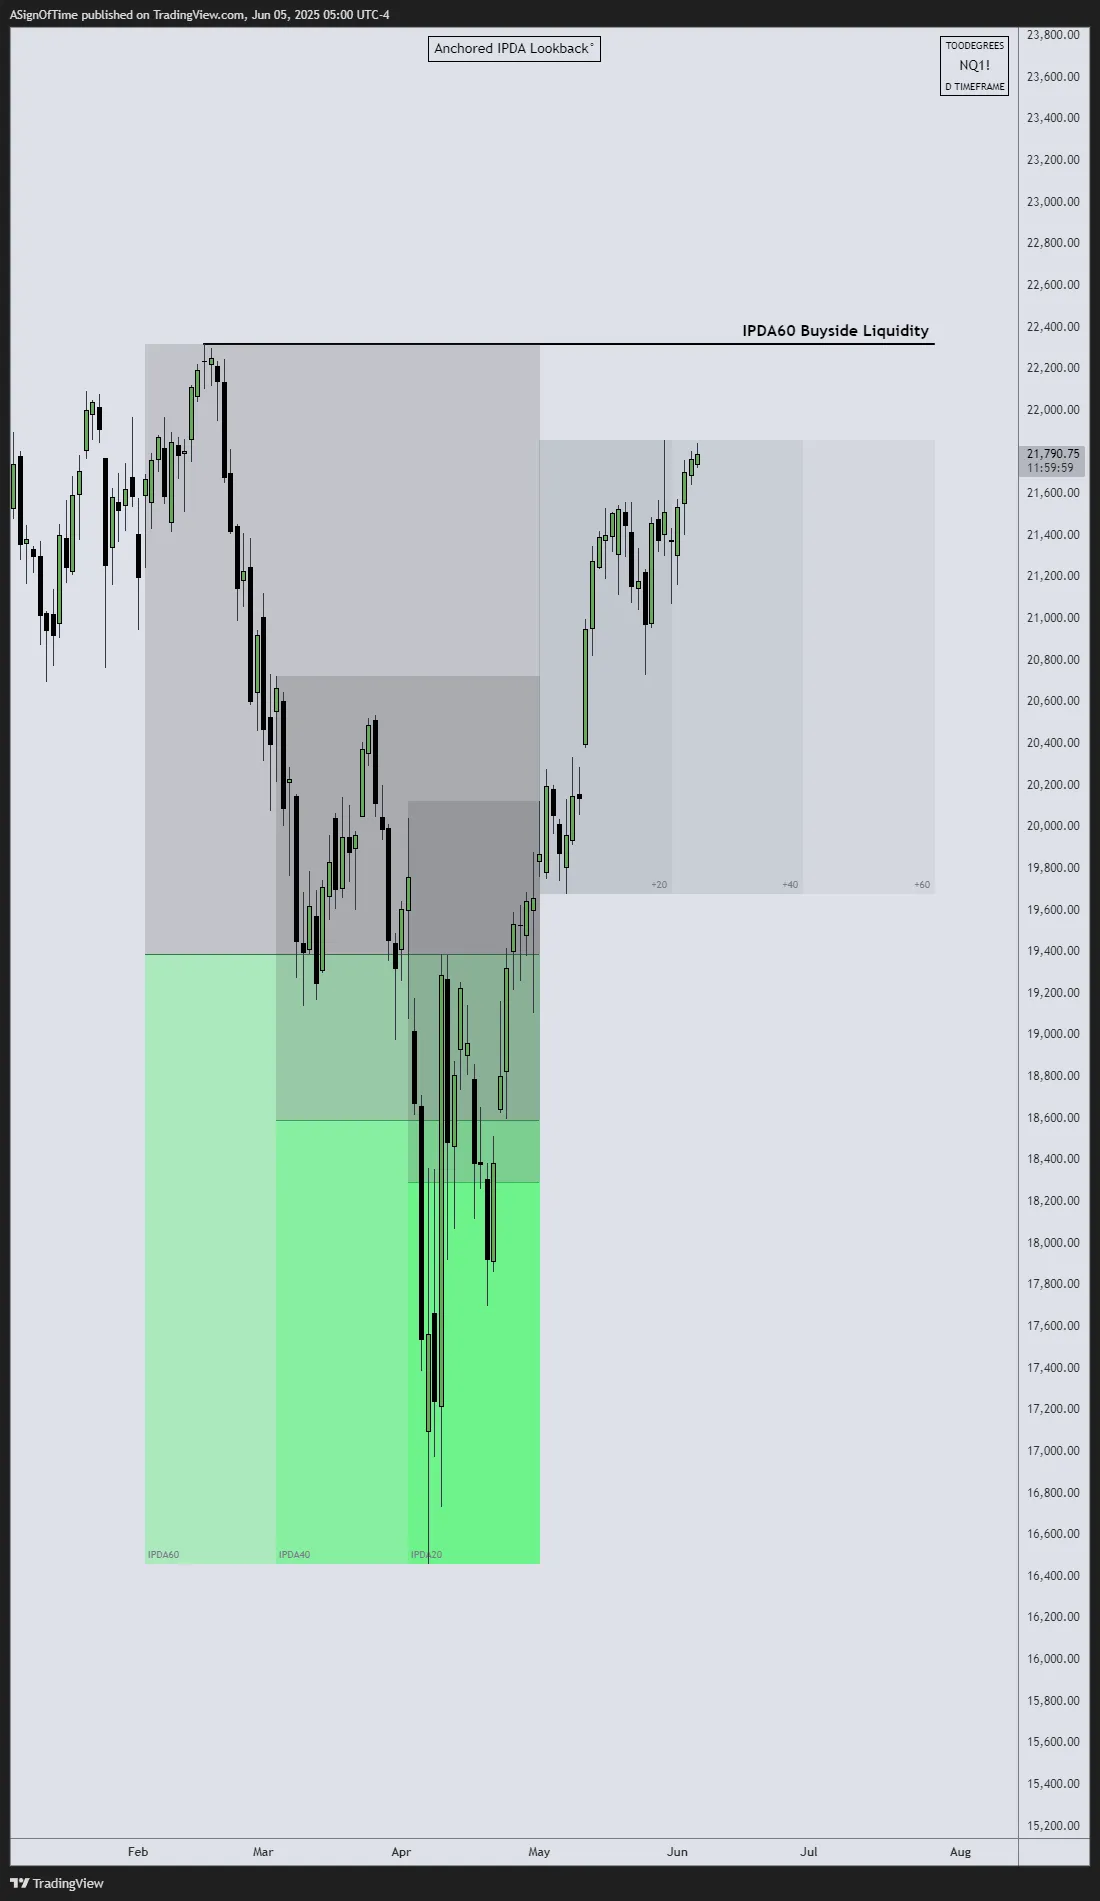
Above 40-Day BSL
[E-MINI S&P 500]
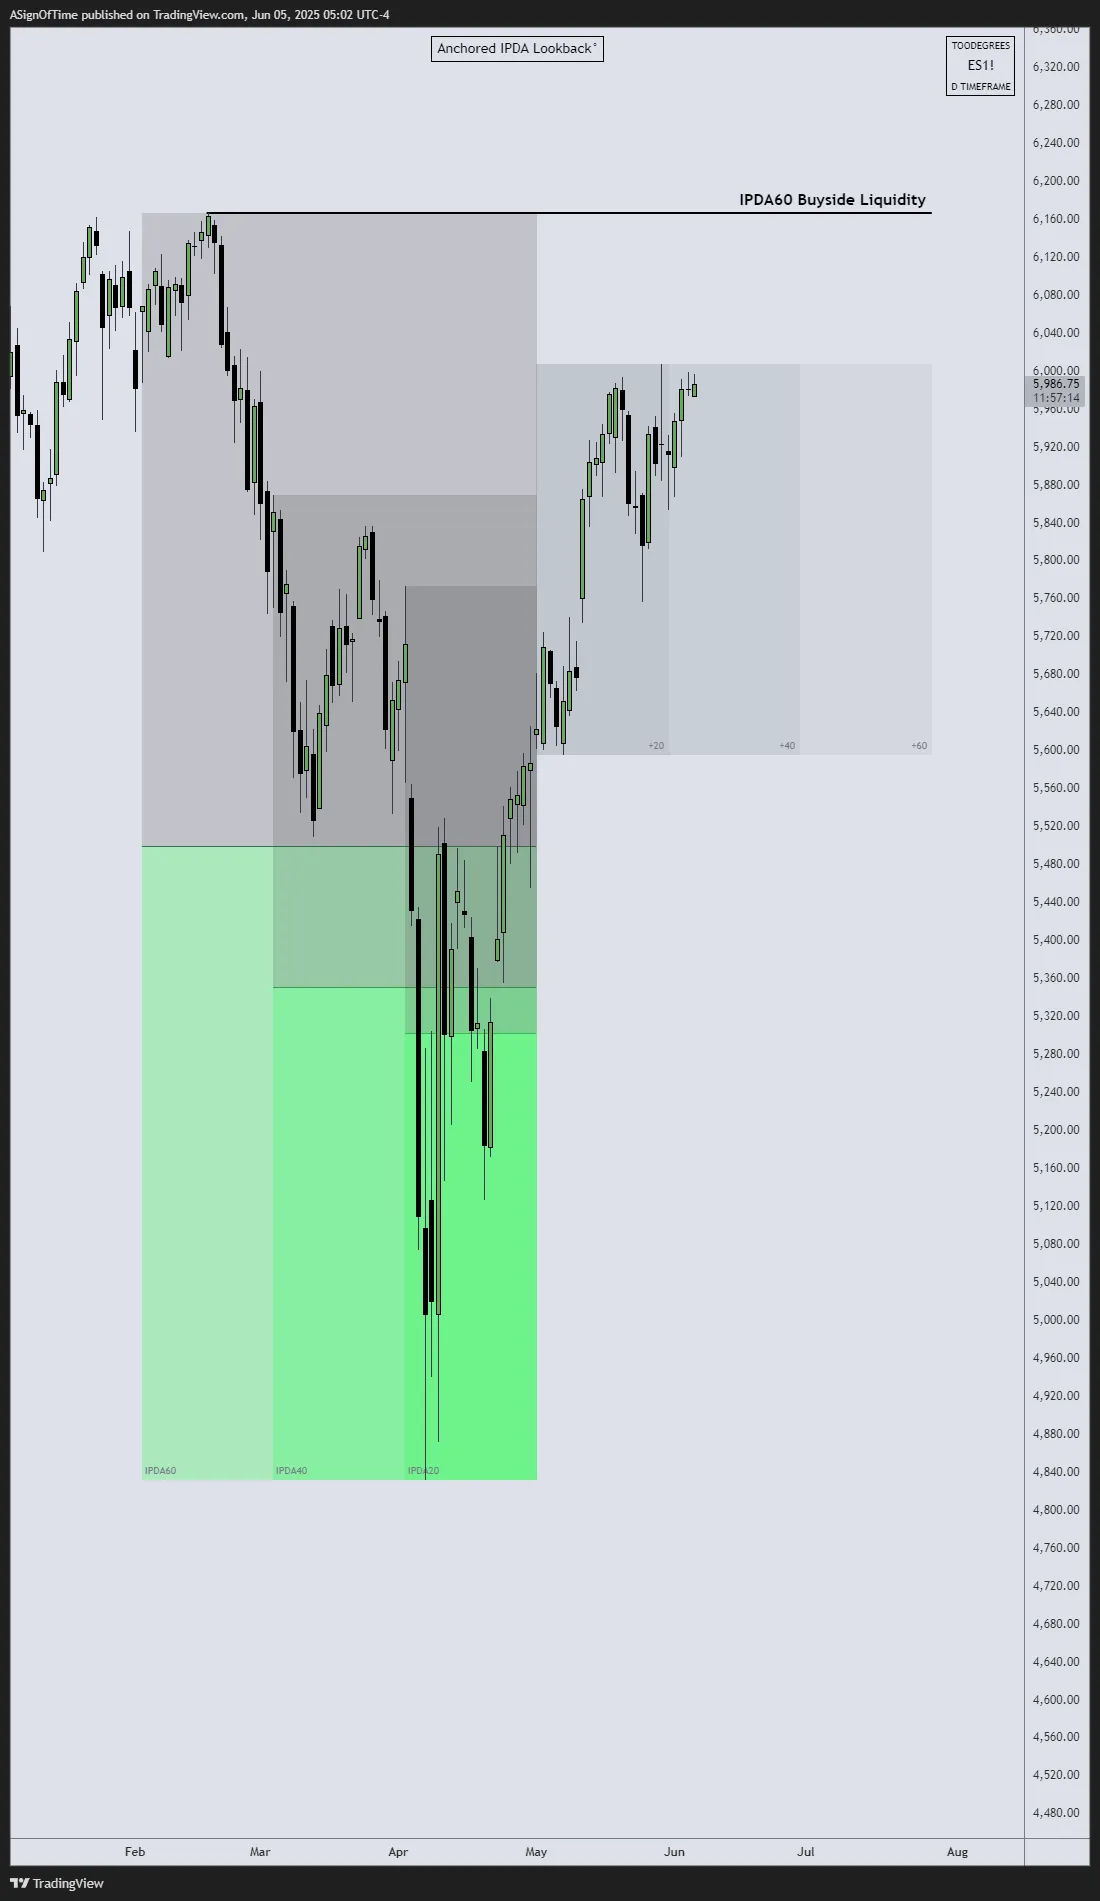
Above 40-Day BSL
[E-MINI DOW JONES]
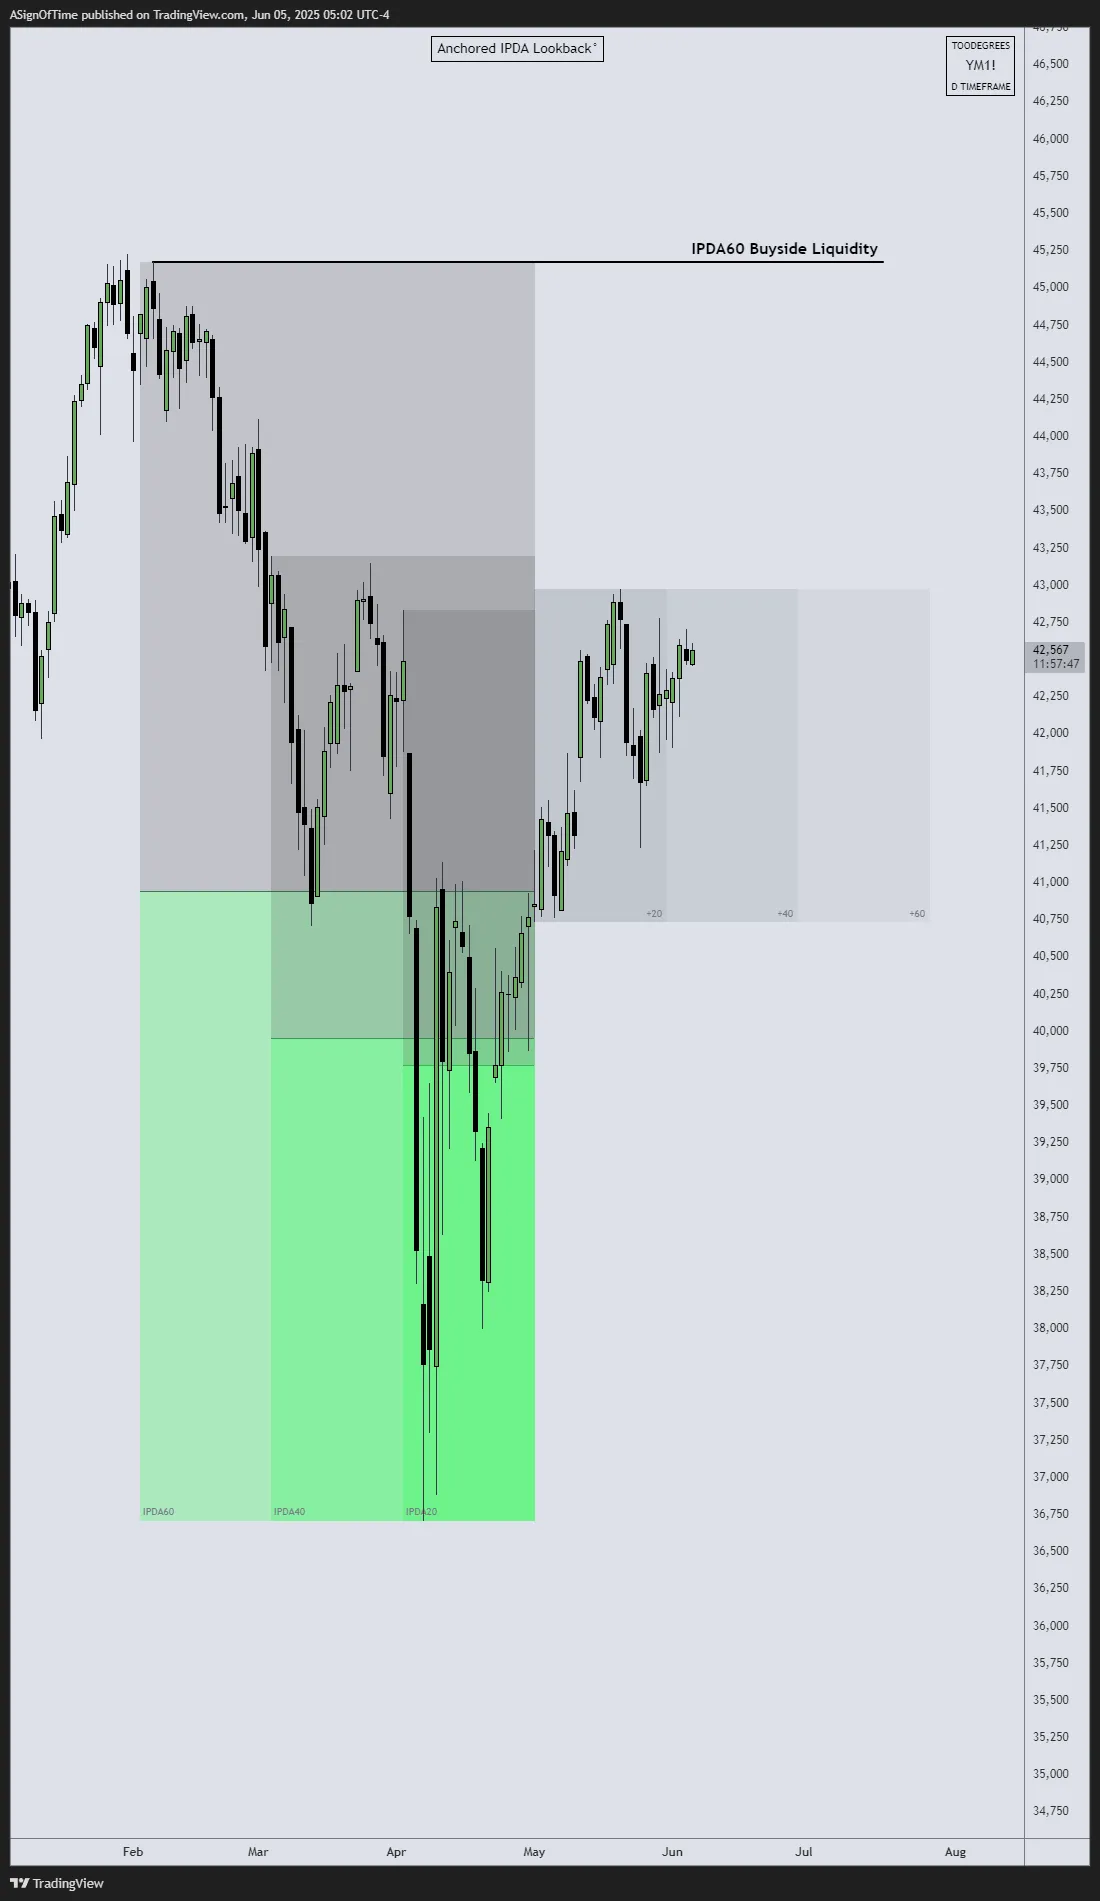
Below 40-Day BSL
Analyst Insight
In May, NQ and ES futures clearly led the charge, showing relative strength over YM. In the previous report we outlined the possibility of indices continuing higher if they closed above the midpoint of the IPDA Data Ranges — and that's exactly what happened. Both NQ and ES closed above the IPDA 40-Day Buyside Liquidity, signaling bullish intent. They're now approaching the 60-Day Buyside Liquidity Pools, which may serve as the next magnet for price. YM futures have lagged, still trading below the 40-Day Buyside Liquidity pool.
Seasonality Analysis — Nasdaq 100
Seasonal tendencies are recurring patterns and trends in markets such as stocks, bonds, currencies, and commodities. These patterns represent certain market trends that typically happen around the same time every year. The seasonal data can be used as a yearly roadmap but does not guarantee future results.
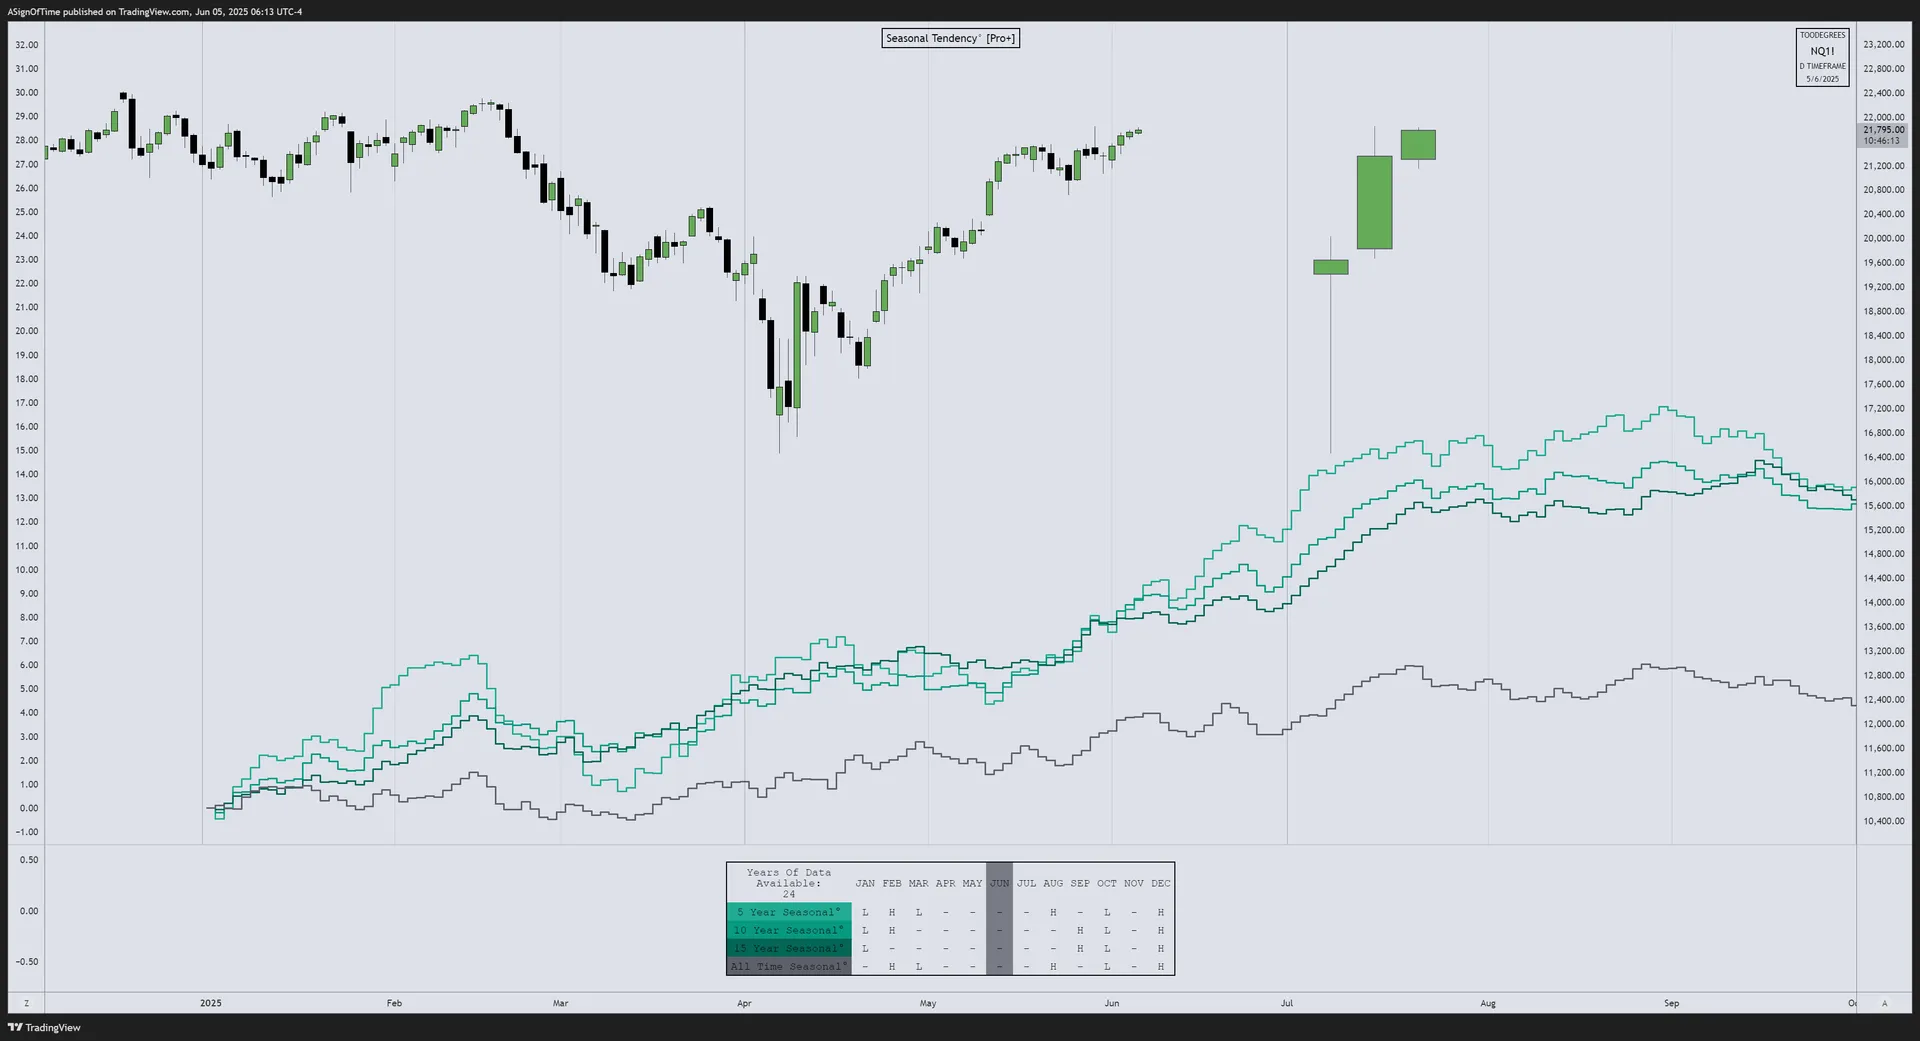
Analyst Insight
Since April's recovery, NQ has been moving in line with the Seasonal Tendency data. NQ respecting the seasonal data adds additional support to the hypothesis built over the past two reports. This seasonal confluence, combined with the bullish price structure and commercial trader positioning, provides a compelling multi-layered confirmation of the ongoing recovery narrative.
Open Interest — Nasdaq 100
Open Interest (OI) is a valuable metric released at the end of each trading day. It represents the number of outstanding futures contracts held by market participants. Comparing current OI to historical seasonal averages helps gauge the strength and conviction behind price moves.
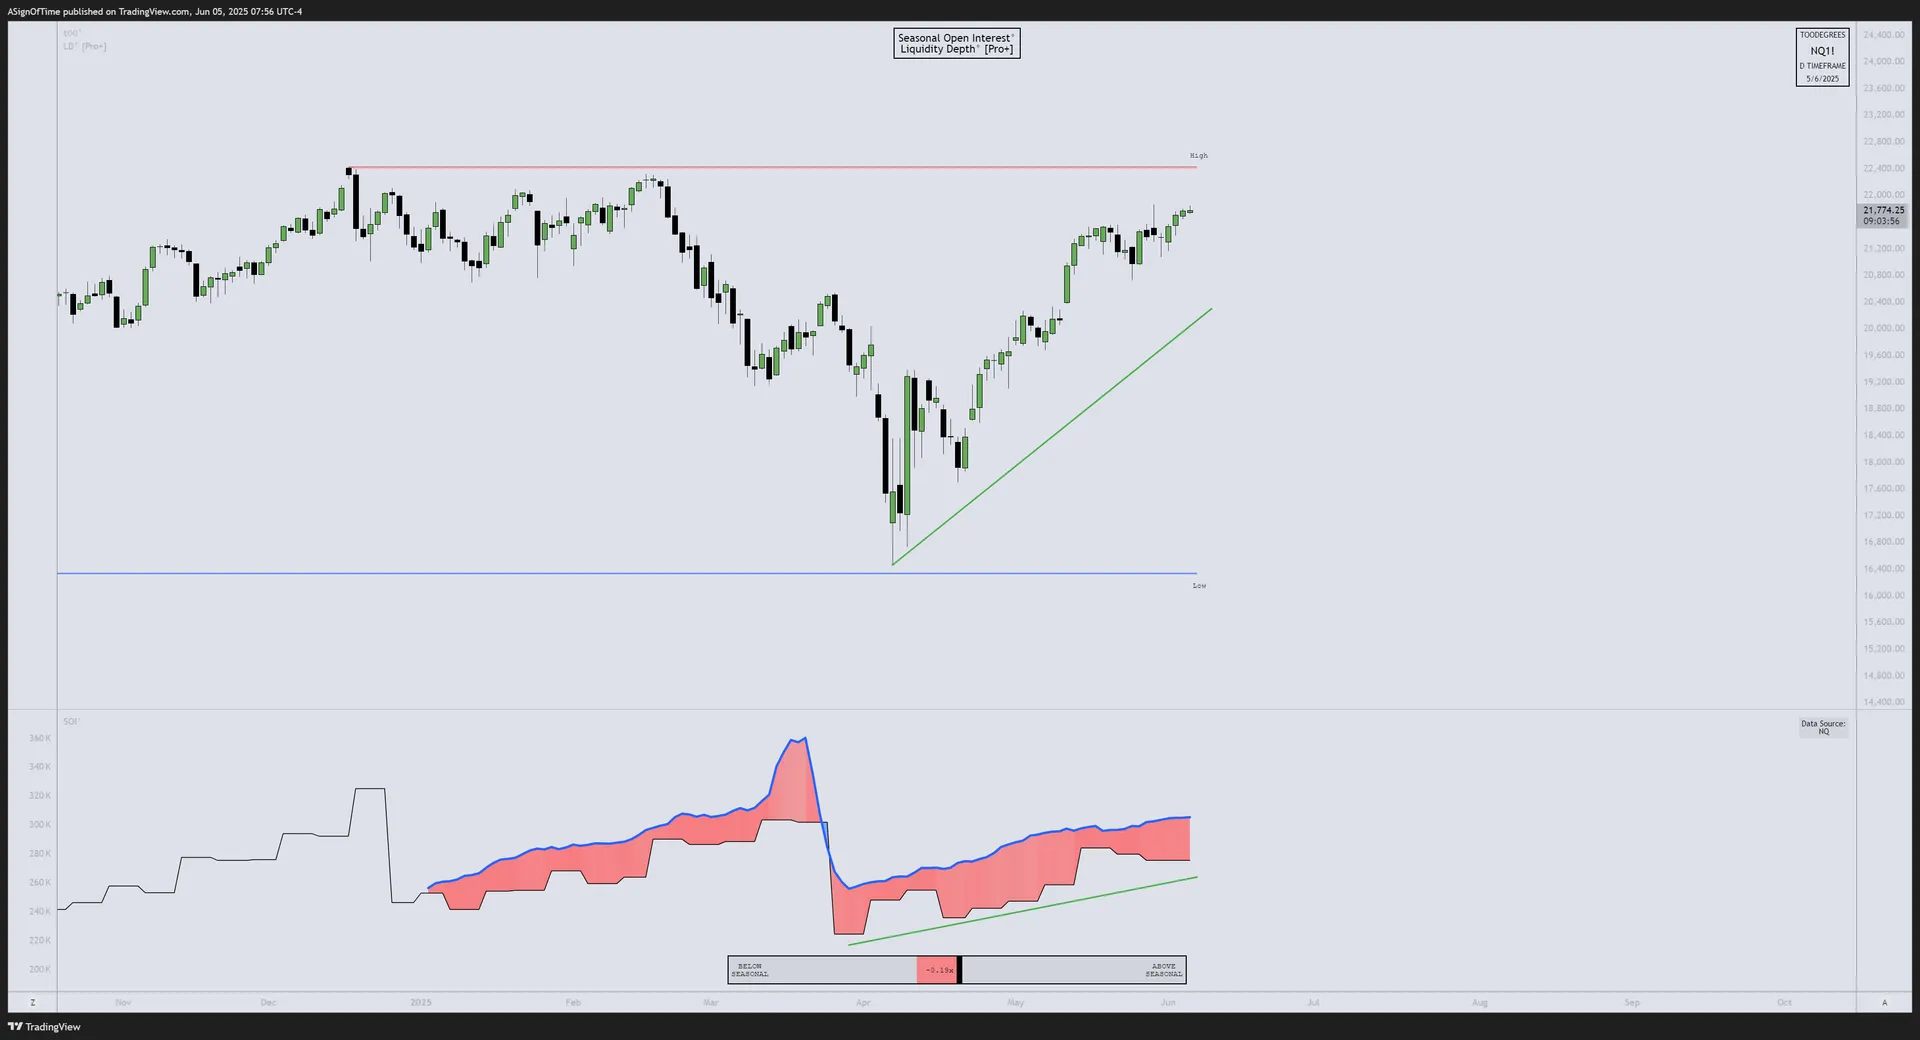
Analyst Insight
Open Interest remains below its seasonal average; however, OI is climbing steadily — indicating there is strength behind the move upwards. This is especially noteworthy because it is also aligned with commercial trader positioning, as outlined in the previous report. Rising OI alongside rising prices = confirmation of bullish participation.
Section 3
Inter-Market Dynamics — Currency Markets
May Results — Currency Markets
In May, the U.S. Dollar Index (DXY) fell by approximately -1.7%, continuing its 2025 downtrend as rate cut expectations and trade concerns weighed on sentiment. Meanwhile, EUR/USD edged up +0.4% and GBP/USD gained +1.7% on the back of resilient UK data and broad dollar weakness.
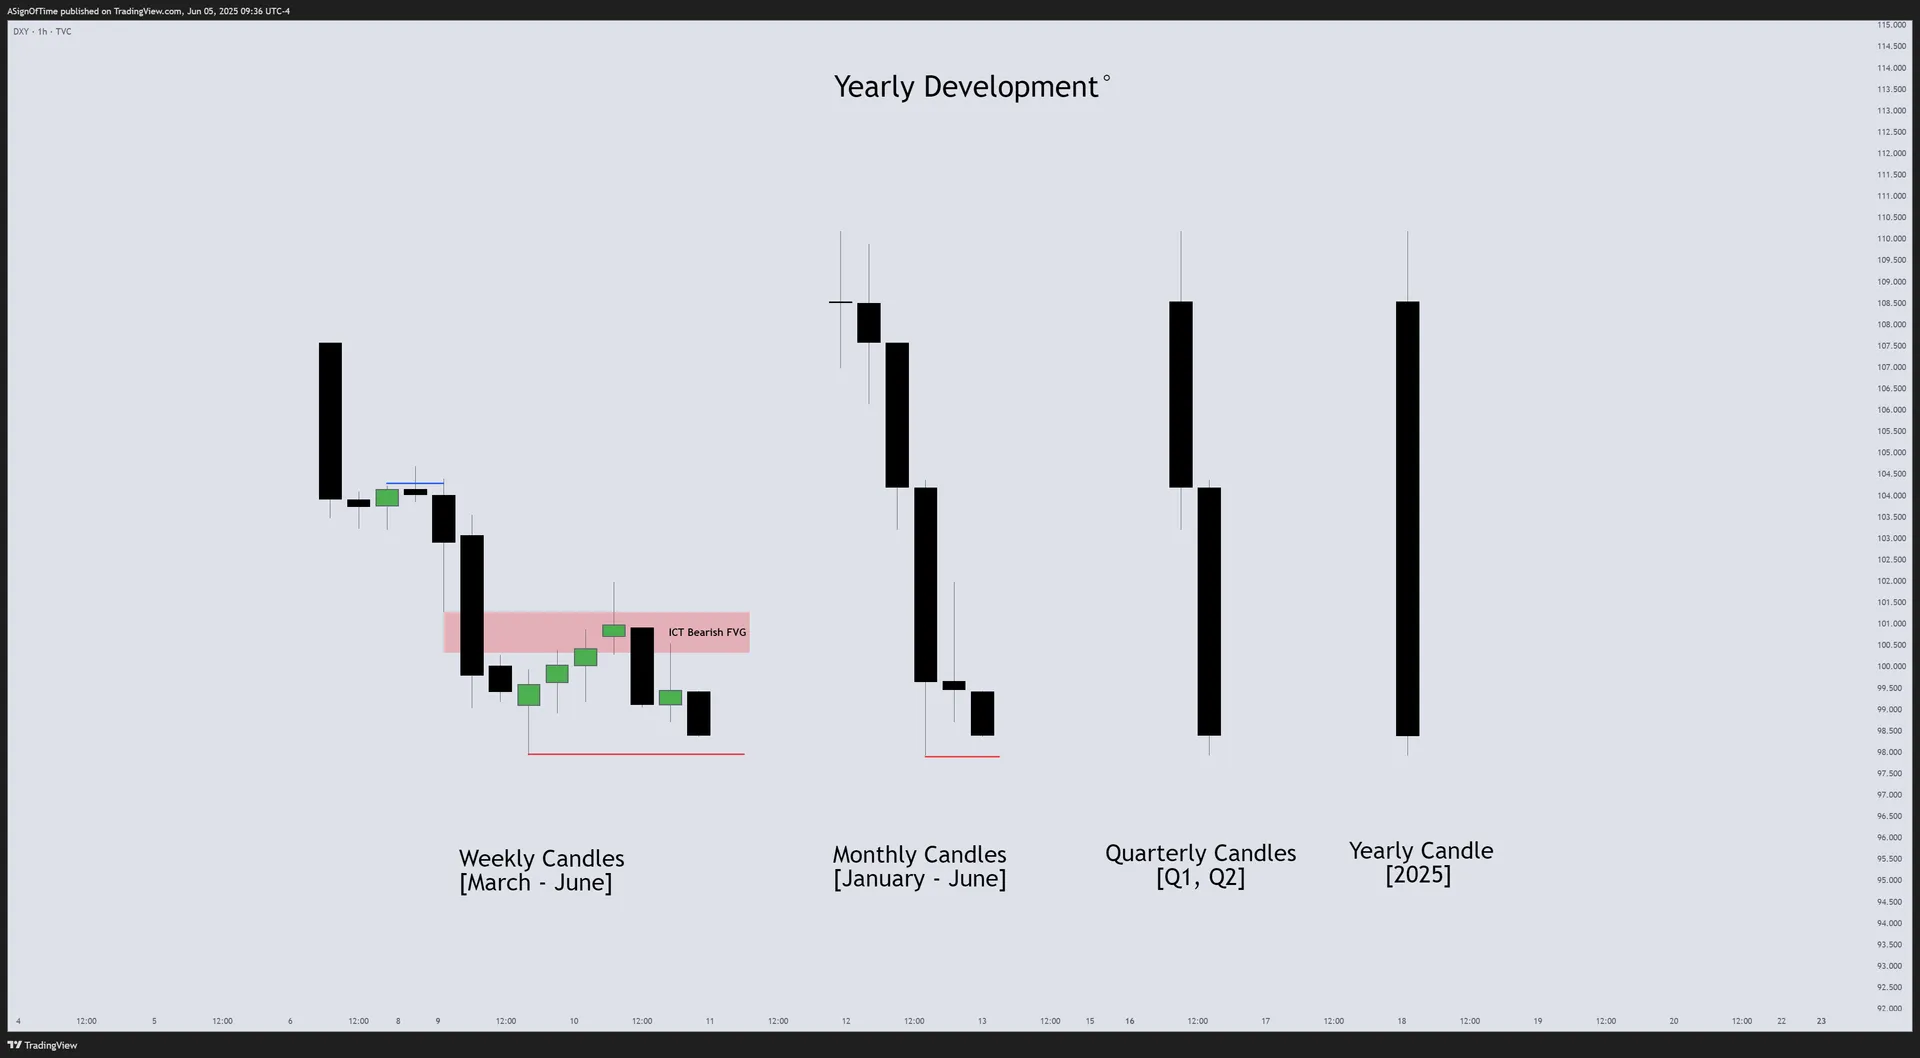
DXY Monthly Recap — HTF Power of Three Dashboard
The US Dollar index saw an almost immediate decline as soon as April opened, after retracing into the Bearish Fair Value Gap. In the previous report we outlined how the DXY created a Bearish FVG during March, which was the main Point of Interest. As of now, the first month in Q2 has also closed lower, confirming the continuation of the downtrend from Q1.
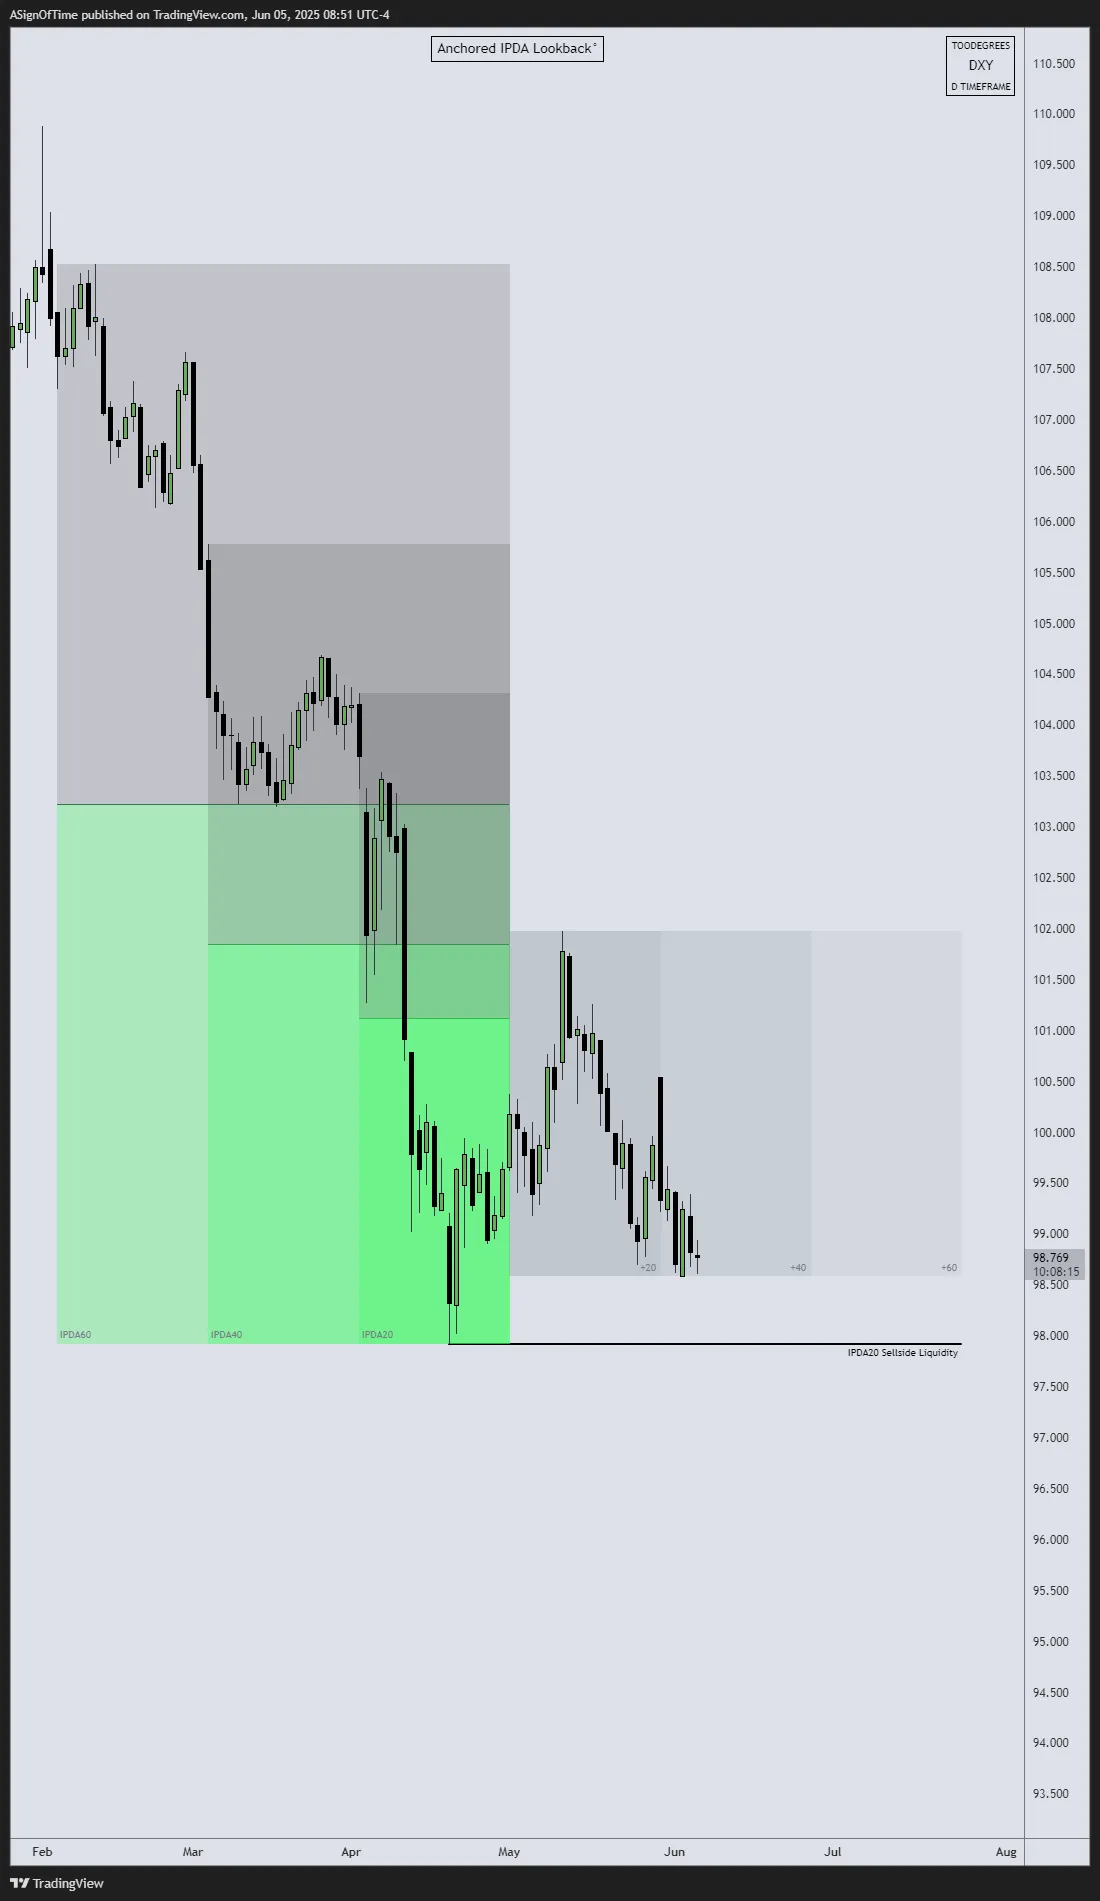
Multi-Asset Analysis — Currency IPDA (May Anchored)
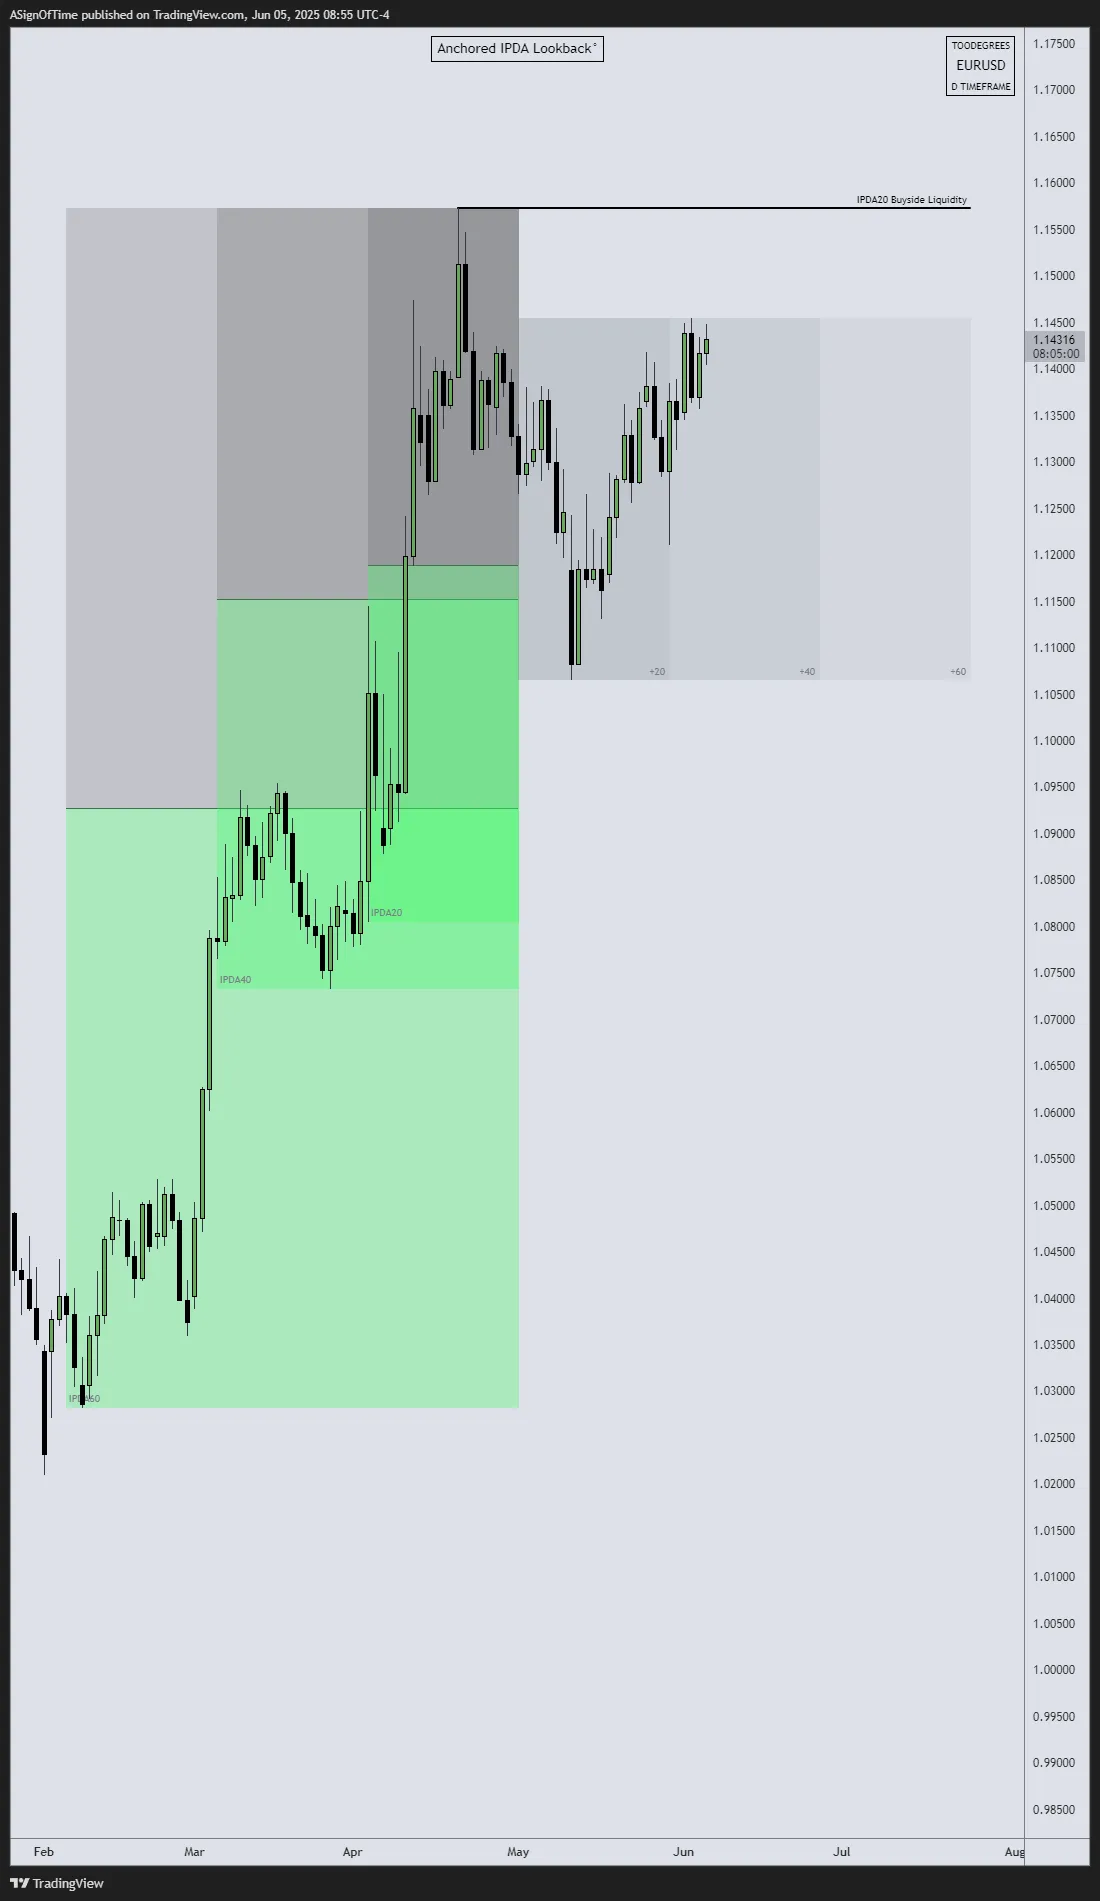
IPDA Lookback anchored at the start of May 1st, 2025 — allowing us to measure Relative Strength across DXY, EUR/USD, and GBP/USD relative to the 60-day lookback period.
[US Dollar Index]
[EUR/USD]
[GBP/USD]
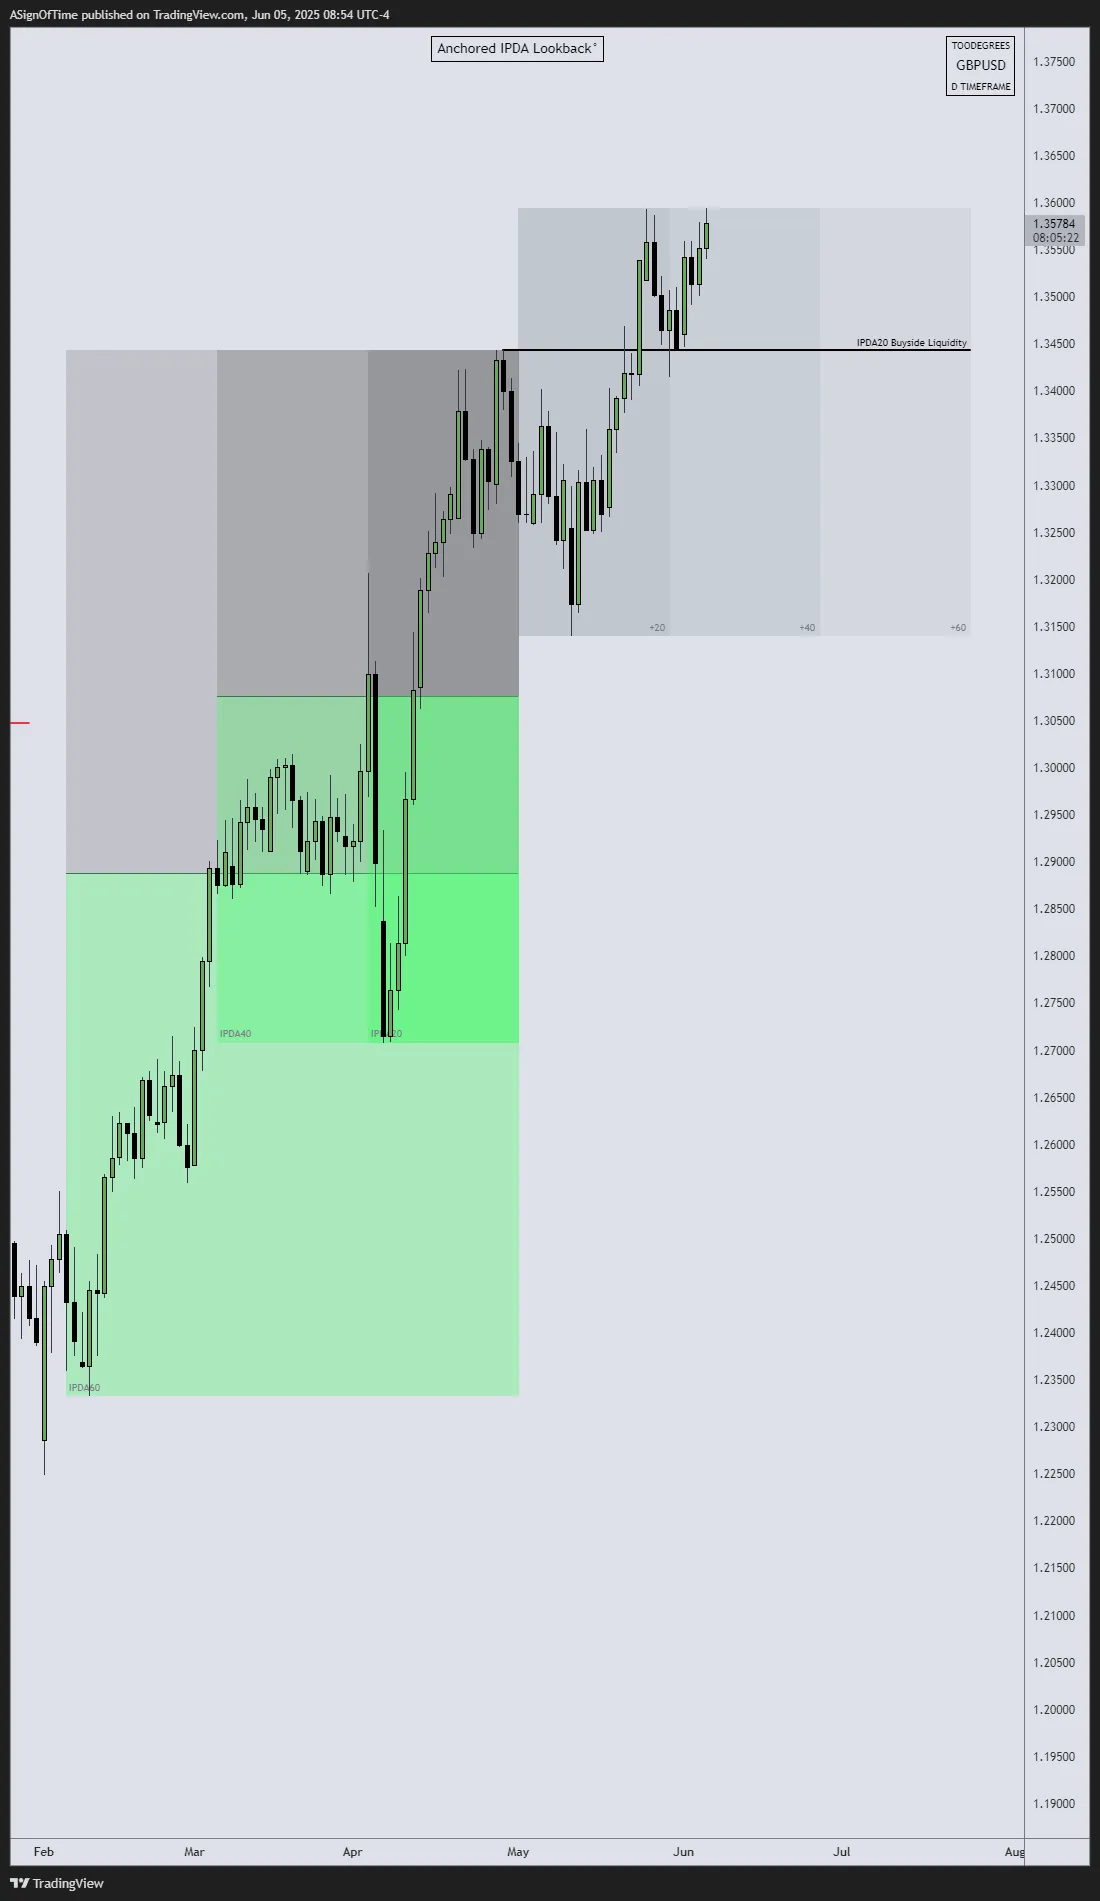
Analyst Insight
DXY and EUR/USD have yet to take out their 20-Day Buyside Liquidity pools, while GBP/USD has already expanded beyond it — establishing itself as the relative strength leader. This creates an SMT divergence: GBP takes out the prior high while EUR fails to do so. However, from a technical standpoint, this divergence doesn't necessarily signal a reversal — the broader orderflow still supports foreign currency strength, which takes precedence over short-term divergence signals.
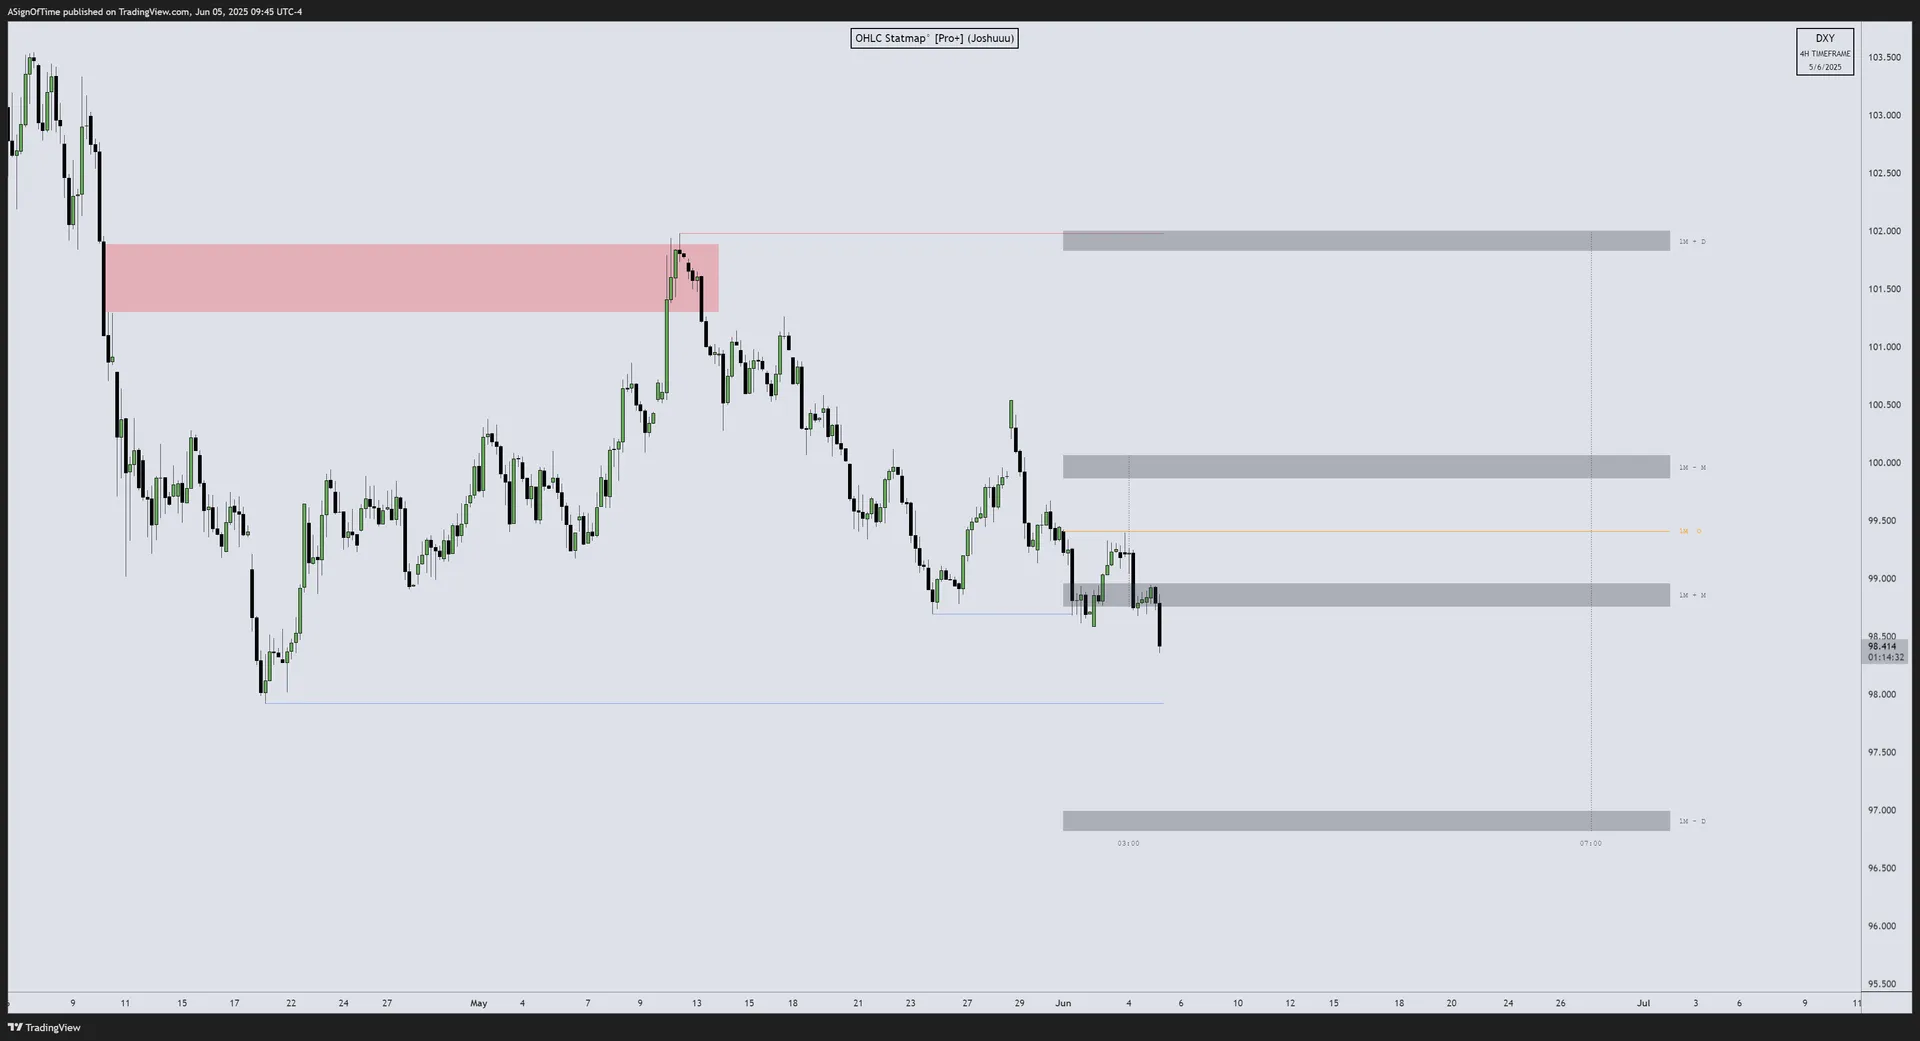
Technical Analysis — DXY with OHLC Statistical Mapping
On this DXY chart, the StatMap is plotted using the 1-Month Timeframe with a combined calculation method (Both Median and Mean). The DXY opened in June and immediately began to move lower. It revisited the June Opening Price once and sharply rejected it.
Meanwhile, the Liquidity Depth indicator highlights the previous month's liquidity pools. The May Sellside Liquidity Pool remains well within the range of the Statistical Distribution, providing a defined downside draw for current price action.
Commitment of Traders — US Dollar Index
The COT Report (CFTC, weekly) provides insight into the positioning of Commercial Traders, Large Traders, and Small Speculators. It reveals the hedging program of commercial participants who tend to position opposite to the prevailing trend as they hedge their underlying exposure.
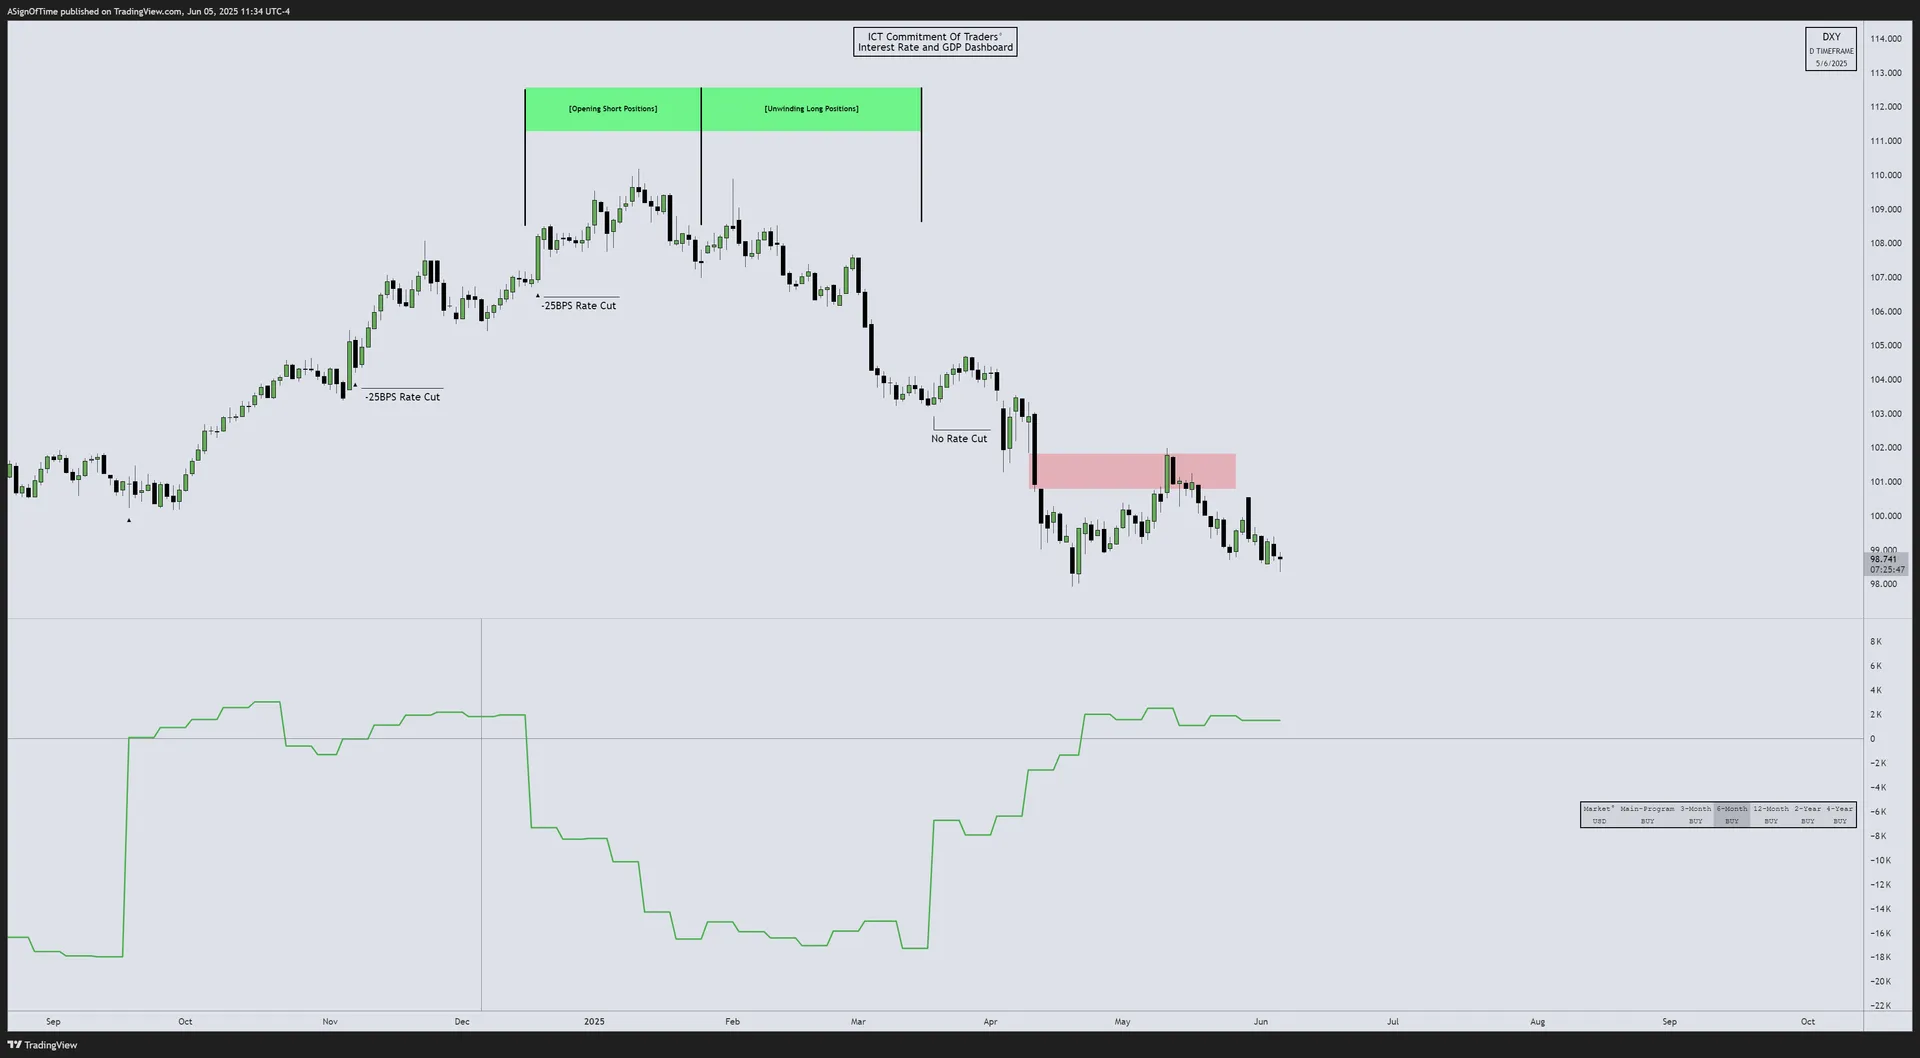
Analyst Insight
Throughout May, the COT data for DXY showed a neutral stance — commercial and non-commercial traders largely holding steady, suggesting a cautious tone as participants await clearer macro signals. Early in the month, a divergence between price and COT positioning hinted at a short-term retracement higher (into the outlined FVG) — which played out. Now, the dollar is trading in a relative discount while the Euro appears extended into premium. Flat positioning indicates no strong directional conviction from larger players.
Open Interest — US Dollar Index
Open Interest for the DXY futures provides insight into the total number of outstanding contracts. Comparing current OI to the seasonal average reveals whether market participants are increasing or reducing overall exposure, and whether the current move has conviction.
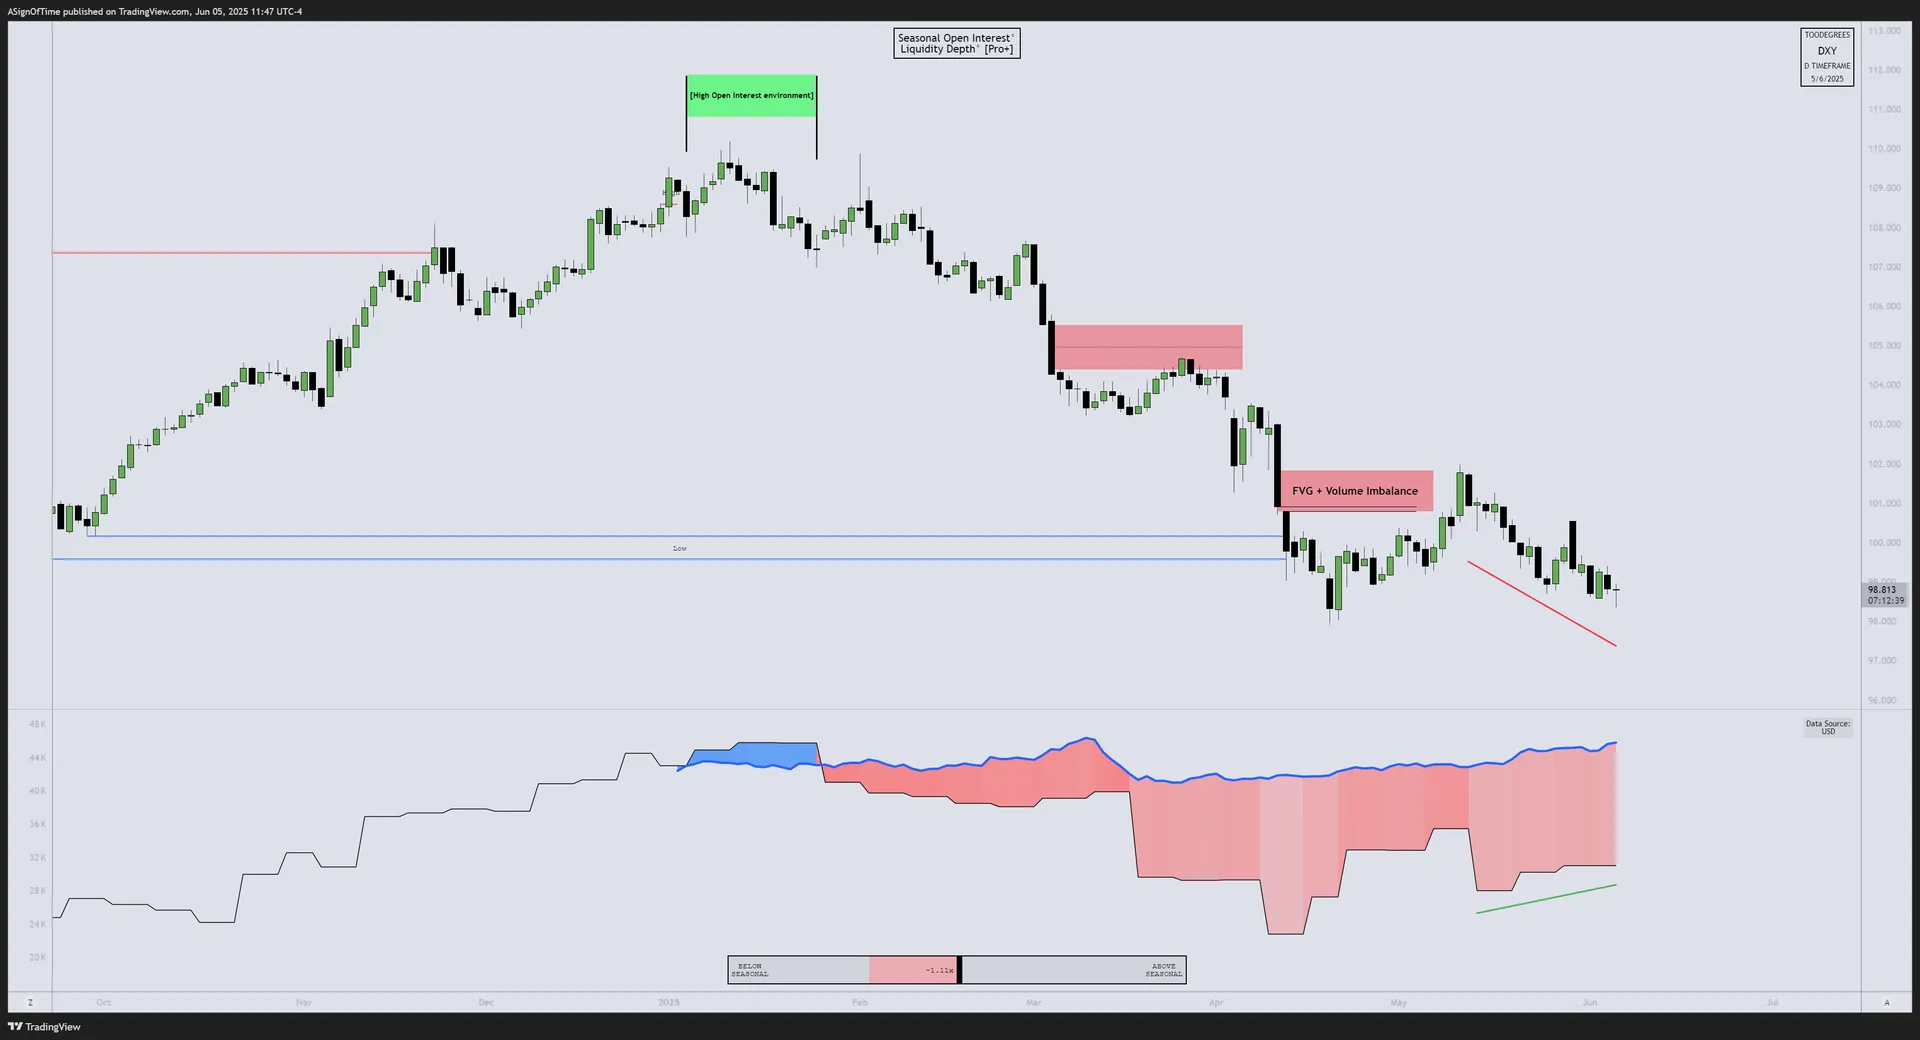
Analyst Insight
Since May 15, Open Interest in DXY futures has been rising even as prices continued to decline. Traditionally, this pattern indicates strength behind the move — suggesting fresh short positions are entering the market. However, given that commercial positioning has remained flat, it implies the downmove isn't being driven by commercial traders, but rather by speculators or short-term participants. This may reduce the move's credibility from a longer-term perspective.
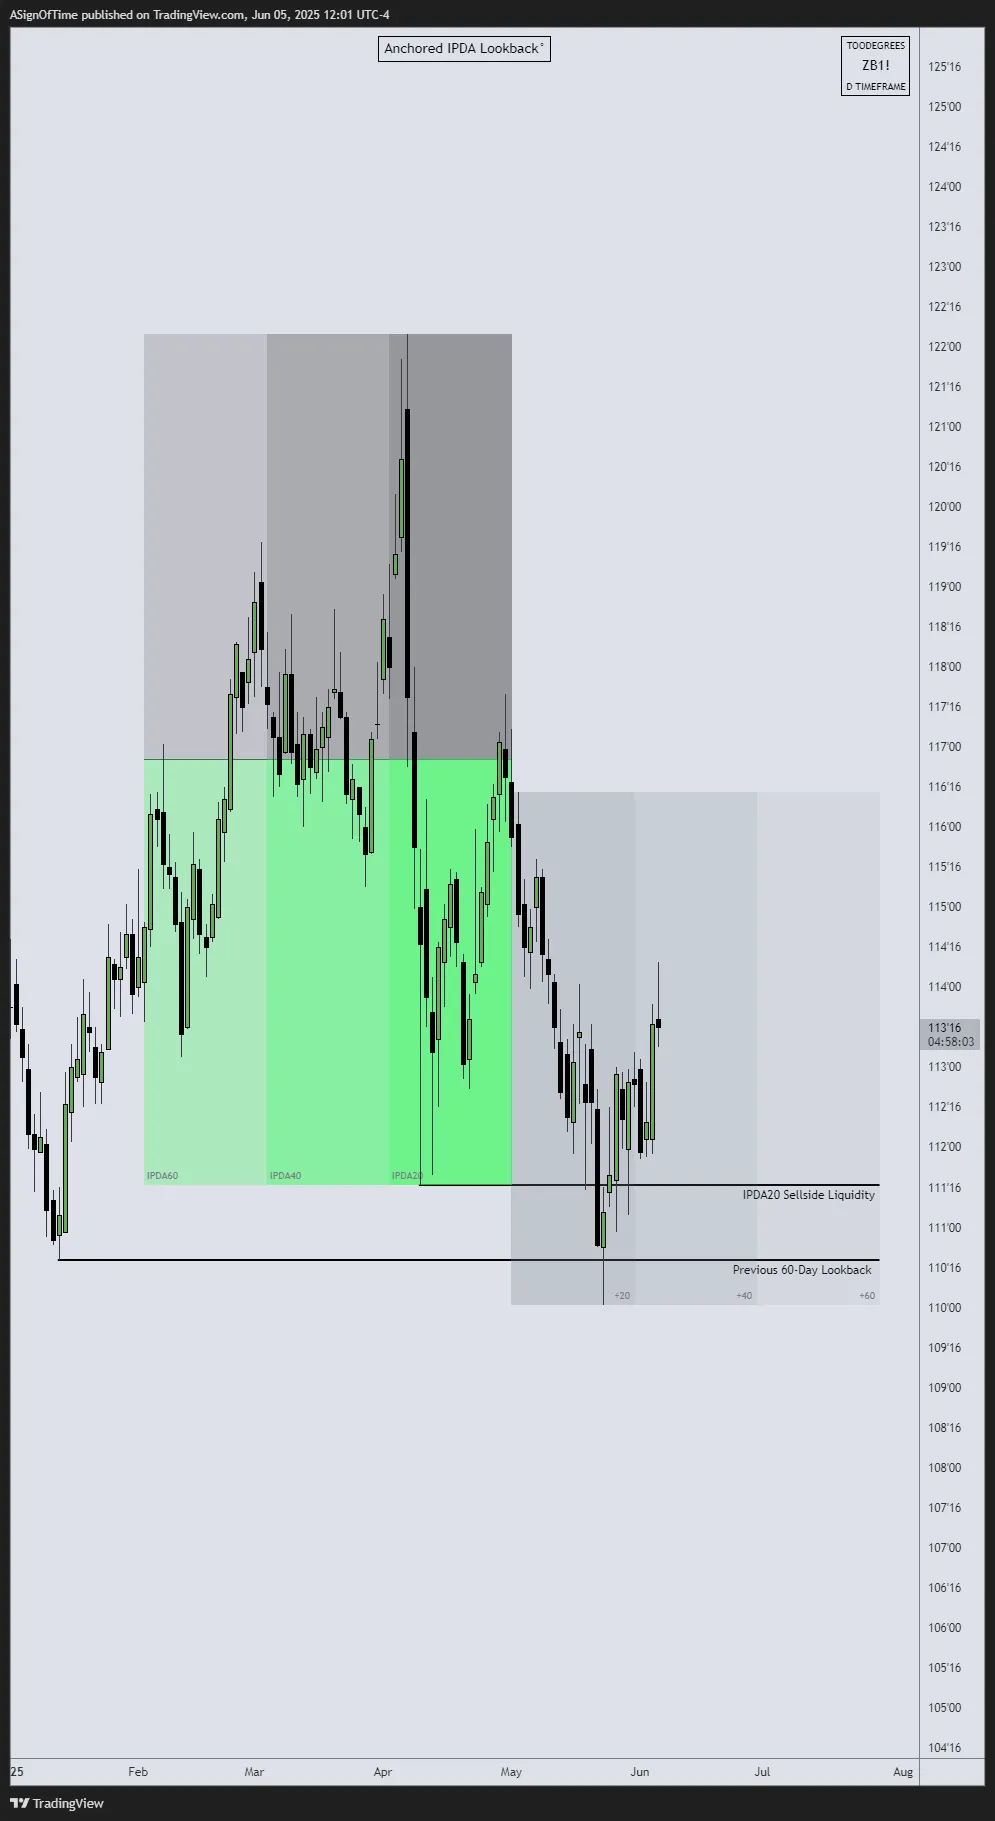
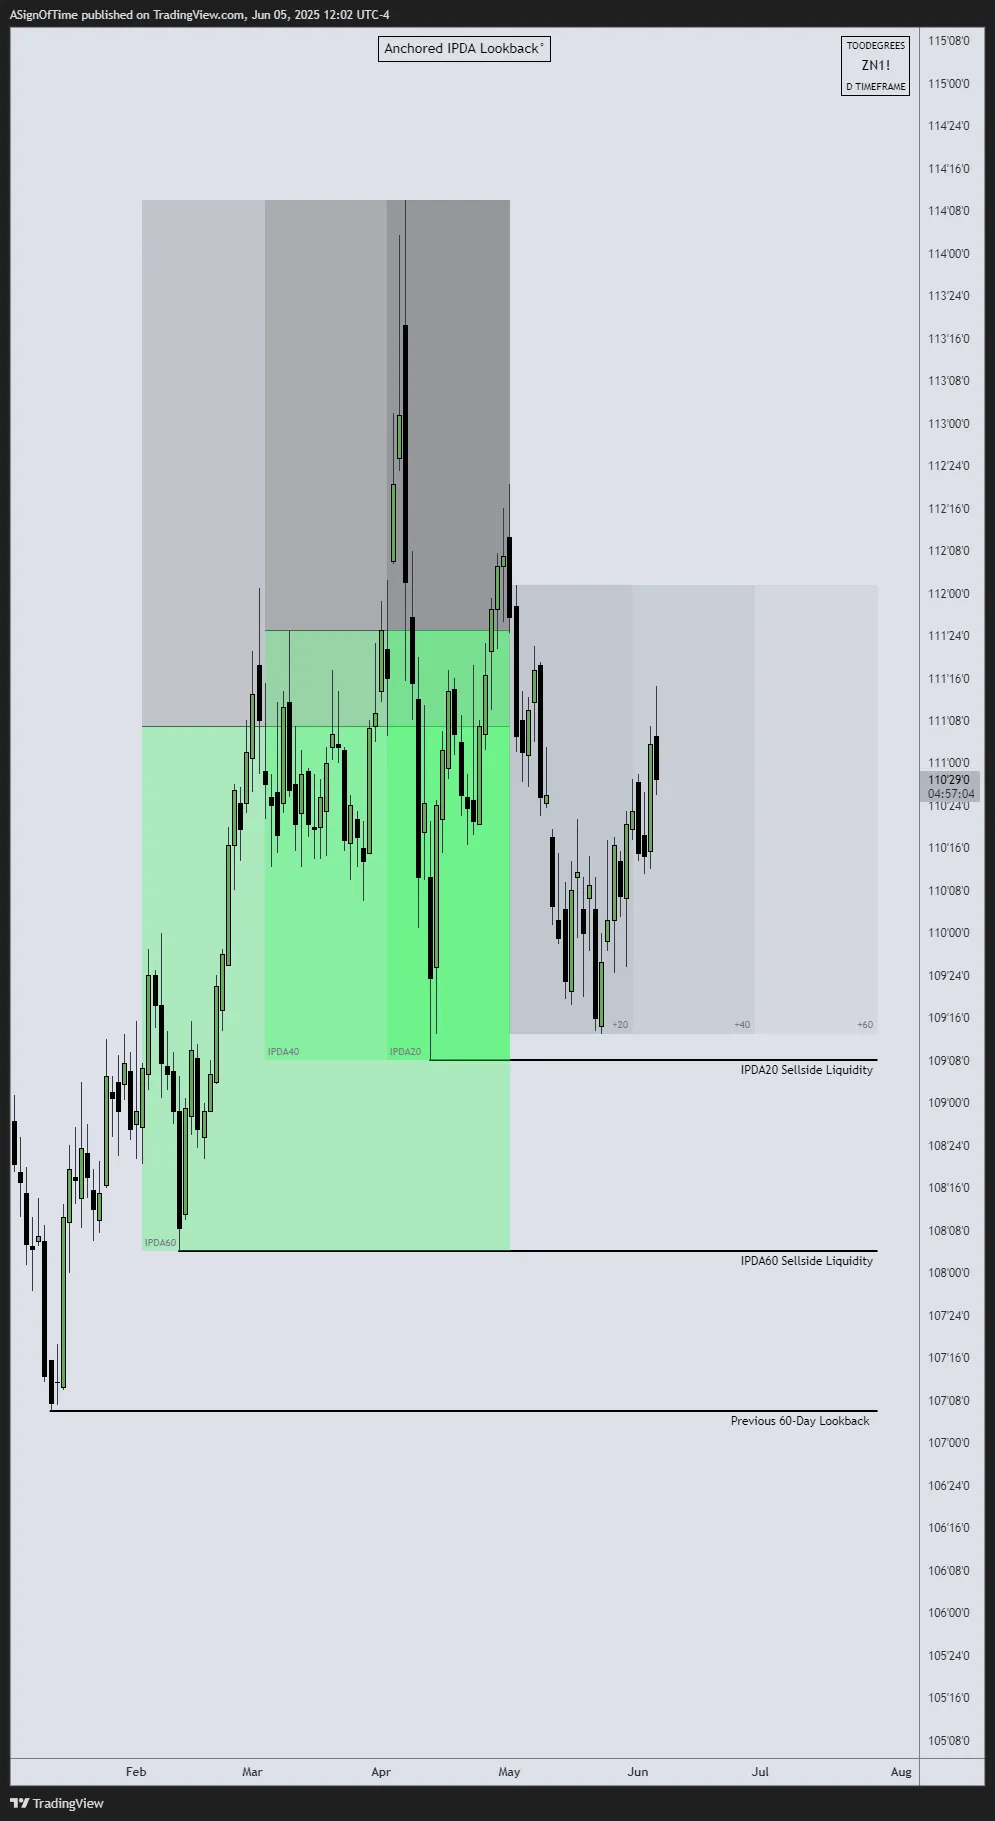
Multi-Asset Analysis — Bond Futures (May Anchored)
IPDA Lookback anchored at May 1st, 2025 across three US Bond Futures: 30-Year T-Bond ($ZB), 10-Year T-Note ($ZN), and 5-Year T-Note ($ZF).
[30-YEAR T-BOND $ZB]
[10-YEAR T-NOTE $ZN]
[5-YEAR T-NOTE $ZF]
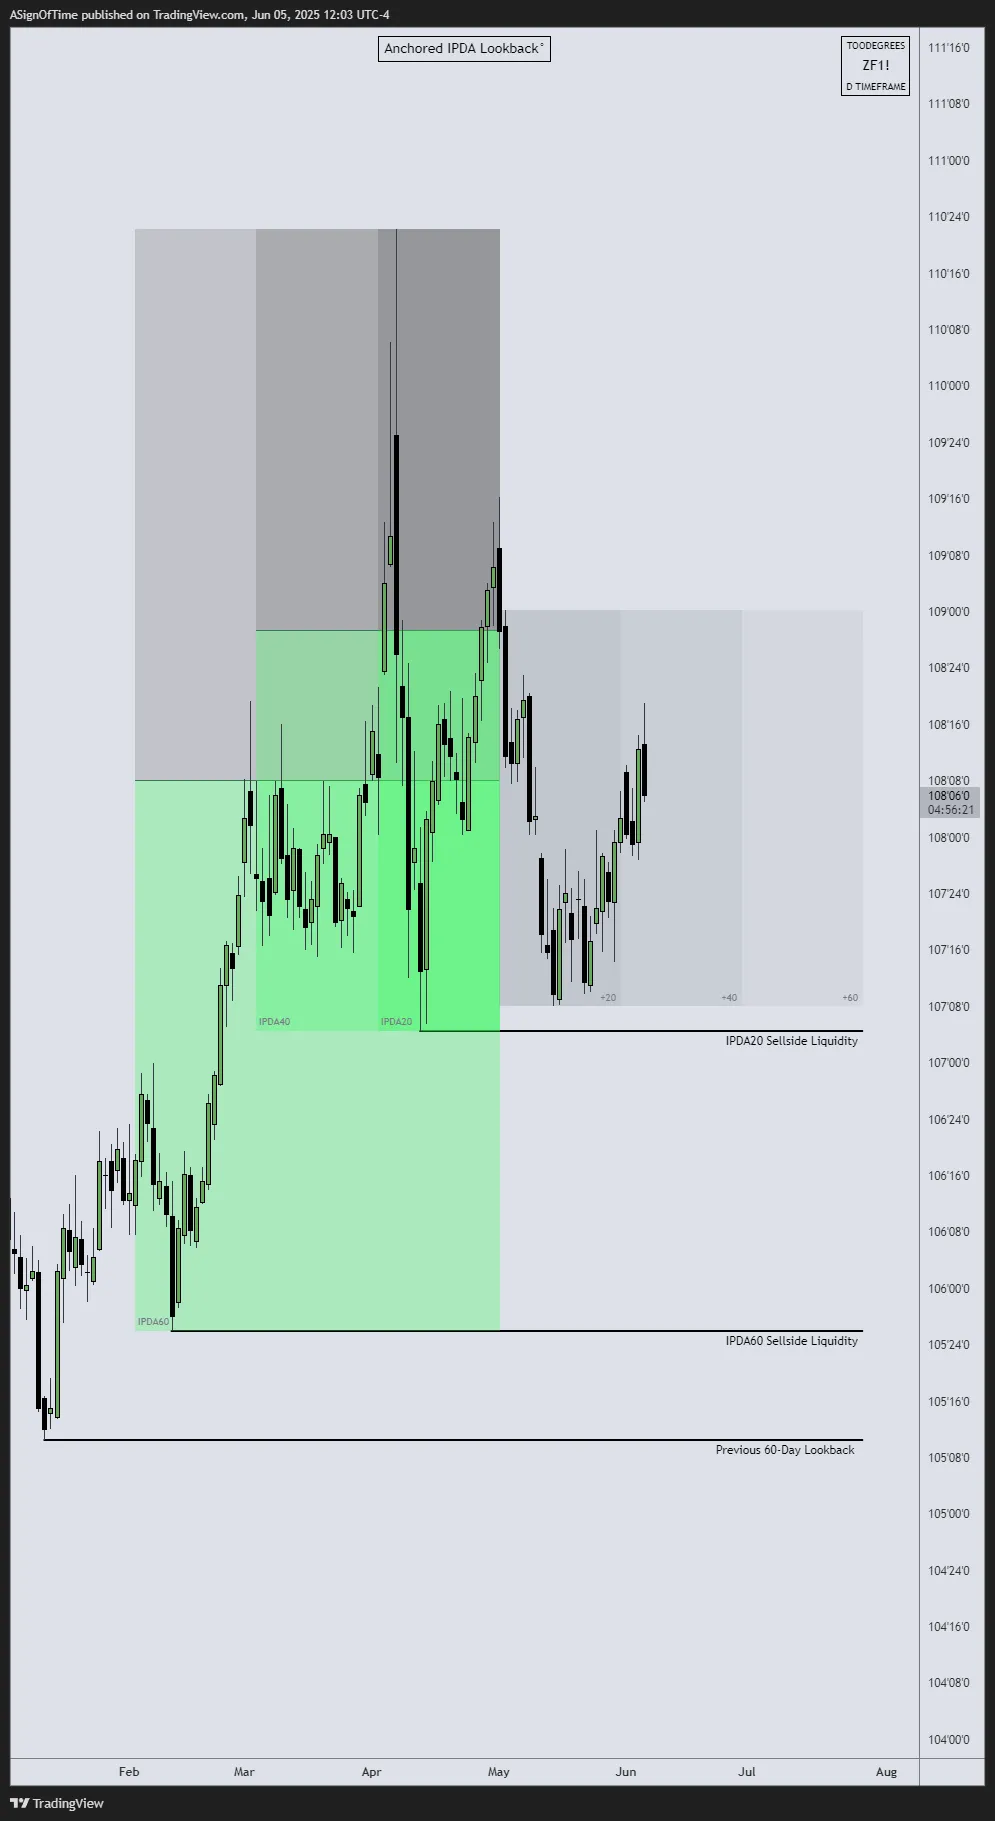
Analyst Insight
In May, U.S. Treasury bond futures trended lower across the curve — ZB (30-Year), ZN (10-Year), and ZF (5-Year) all posting modest declines. ZB traded below previously outlined sellside liquidity pools, signaling deeper distribution, while ZN and ZF remained range-bound. This makes ZF the strength leader and ZB the weakest. The selling was orderly, suggesting markets are in repositioning mode rather than panic — adjusting to a more drawn-out rate cut timeline.
Yield Curve — US Treasuries
The Yield Curve of U.S. government bonds provides insight into how returns vary based on the length of time investors hold Treasury securities. In early June 2025, the yield curve is starting to shift back to normal — with longer-term interest rates (10-year and 30-year) now higher than short-term rates (2-year).
The 2-year Treasury yield stands at 3.89%, while the 10-year is at 4.41%. This difference shows investors are becoming more optimistic about the long-run economy. However, the rise in longer-term yields also signals some concern around inflation and government debt — so while things are improving, investors are still being careful.
Source: ustreasuryyieldcurve.com
Inter-Market Dynamics Summary
| Metric | NQ | DXY | T-Bonds |
|---|---|---|---|
| Orderflow | Bullish → Bullish | Bearish → Bearish | Bullish → Bearish |
| Seasonality | Bullish → Bullish | Bullish → Sideways | Bullish → Sideways |
| Open Interest | Rising → Rising | Flat → Rising | Flat → Rising |
| Market Condition | Trending | Trending | Trending |
| COT Report | Net-Short → Net Long | Net-Short | Net-Short |
| Interest Rate | — | 4.25%–4.5% | — |
Format: Previous Report → Current Report
Section 4
Additional Resources
Free TradingView Tools
Interest Rate & GDP Dashboard
by toodegrees — Free on TradingView
ICT Anchored IPDA Ranges
by toodegrees — Free on TradingView
ICT Commitment of Traders
by toodegrees — Free on TradingView
Seasonal Open Interest
by toodegrees — Free on TradingView
HTF Power of Three°
Toodegrees Help Center — Pro Indicator
OHLC Statistical Mapping°
Toodegrees Help Center — Pro Indicator
CME FedWatch Tool
Track Federal Reserve rate expectations
Community Resources
Toodegrees Library
Access all EOM Reports & premium content
CME FedWatch Tool
Track Federal Reserve rate probability

May EOM Livestream
Full May analysis walkthrough on YouTube
AAII Investor Sentiment Survey
Historical sentiment data & video breakdown
Follow Toodegrees
Section 5
Conclusion — Analysis Recap
May was defined by a broad-based recovery in risk assets, led by strength in technology and AI-driven equities. The S&P 500 and Nasdaq posted strong monthly gains, closing above key liquidity thresholds, while the Dow lagged behind — highlighting relative weakness in value and industrial names.
In the currency markets, the U.S. Dollar continued its decline, in line with 5-year seasonal tendencies, though without strong commercial confirmation. GBP/USD emerged as the relative strength leader, breaking above key highs, while EUR/USD followed but lagged — creating an SMT divergence that remains technically valid but unsupported by broader orderflow.
Bond futures pulled back across the curve, with ZB breaking below sellside liquidity, while ZN and ZF held within their respective ranges. The yield curve steepened modestly, reflecting easing recession fears and a repricing of growth and inflation expectations.
COT and Open Interest data revealed cautious re-engagement by participants, though the absence of strong commercial positioning leaves some directional uncertainty. Seasonal alignment begins to fade in June, removing a key layer of confluence.
Overall, May marked a return of momentum, but with signs of imbalance across asset classes. Markets are headed into June with improving structures and a narrative that continues to favor the bulls — for now.

Toodegrees Library