October 2025 EOM Report — Inter Market Dynamics

Written by
A Sign Of Time
Head of Education & Toodegrees Analyst

Section 1
Monthly Recap — US Indices
Welcome to the October End-of-Month Market Recap, covering October's price action across U.S. equity futures, FX pairs, and Treasury bonds. Equity markets navigated a complex landscape of election uncertainty, earnings season, and shifting Fed expectations, while the Dollar Index maintained strength amid global uncertainty.
Recent Events — U.S. Presidential Election Approaches
October was dominated by the lead-up to the November 5th U.S. Presidential Election, with polls tightening and markets positioning for potential policy shifts. Corporate earnings season delivered mixed results — mega-cap tech posted strong AI-driven revenue growth, but forward guidance remained cautious amid economic uncertainty. The Fed maintained its September rate cut trajectory, signaling another 25bp cut in November, though policymakers emphasized data-dependency going forward.
Key Elements
Election Positioning: Markets entered a defensive stance ahead of the election, with elevated hedging activity and reduced conviction trades.
Earnings Mixed: Strong revenue growth offset by cautious guidance — reflecting uncertain macro backdrop despite resilient AI spending.
Fed Path Clear: Another 25bp cut expected in November, but the pace of future cuts remains data-dependent — limiting market certainty.
October Results — US Index Futures
In October, U.S. equity futures showed divergent performance. The Nasdaq-100 ($NQ) declined -1.1%, weighed down by profit-taking in mega-cap tech despite strong earnings. The S&P 500 ($ES) fell -0.9%, reflecting cautious positioning ahead of the election. The Dow Jones ($YM) dropped -1.3%, with value sectors struggling amid economic uncertainty.
$NQ = E-Mini Nasdaq 100 Futures · $ES = E-Mini S&P 500 Futures · $YM = E-Mini Dow Jones Futures
Sentiment Analysis
AAII Investor Sentiment (October 31): Bullish sentiment held at 33.5% — below the long-term average of 37.5%. Bearish ticked up to 39.1%, reflecting election anxiety. Fear & Greed Index (October 31): 45 — Fear. Elevated VIX and put skew suggest defensive positioning, but post-election clarity could trigger volatility compression and a relief rally if uncertainty resolves favorably.
Section 2
Technical Analysis — Nasdaq 100
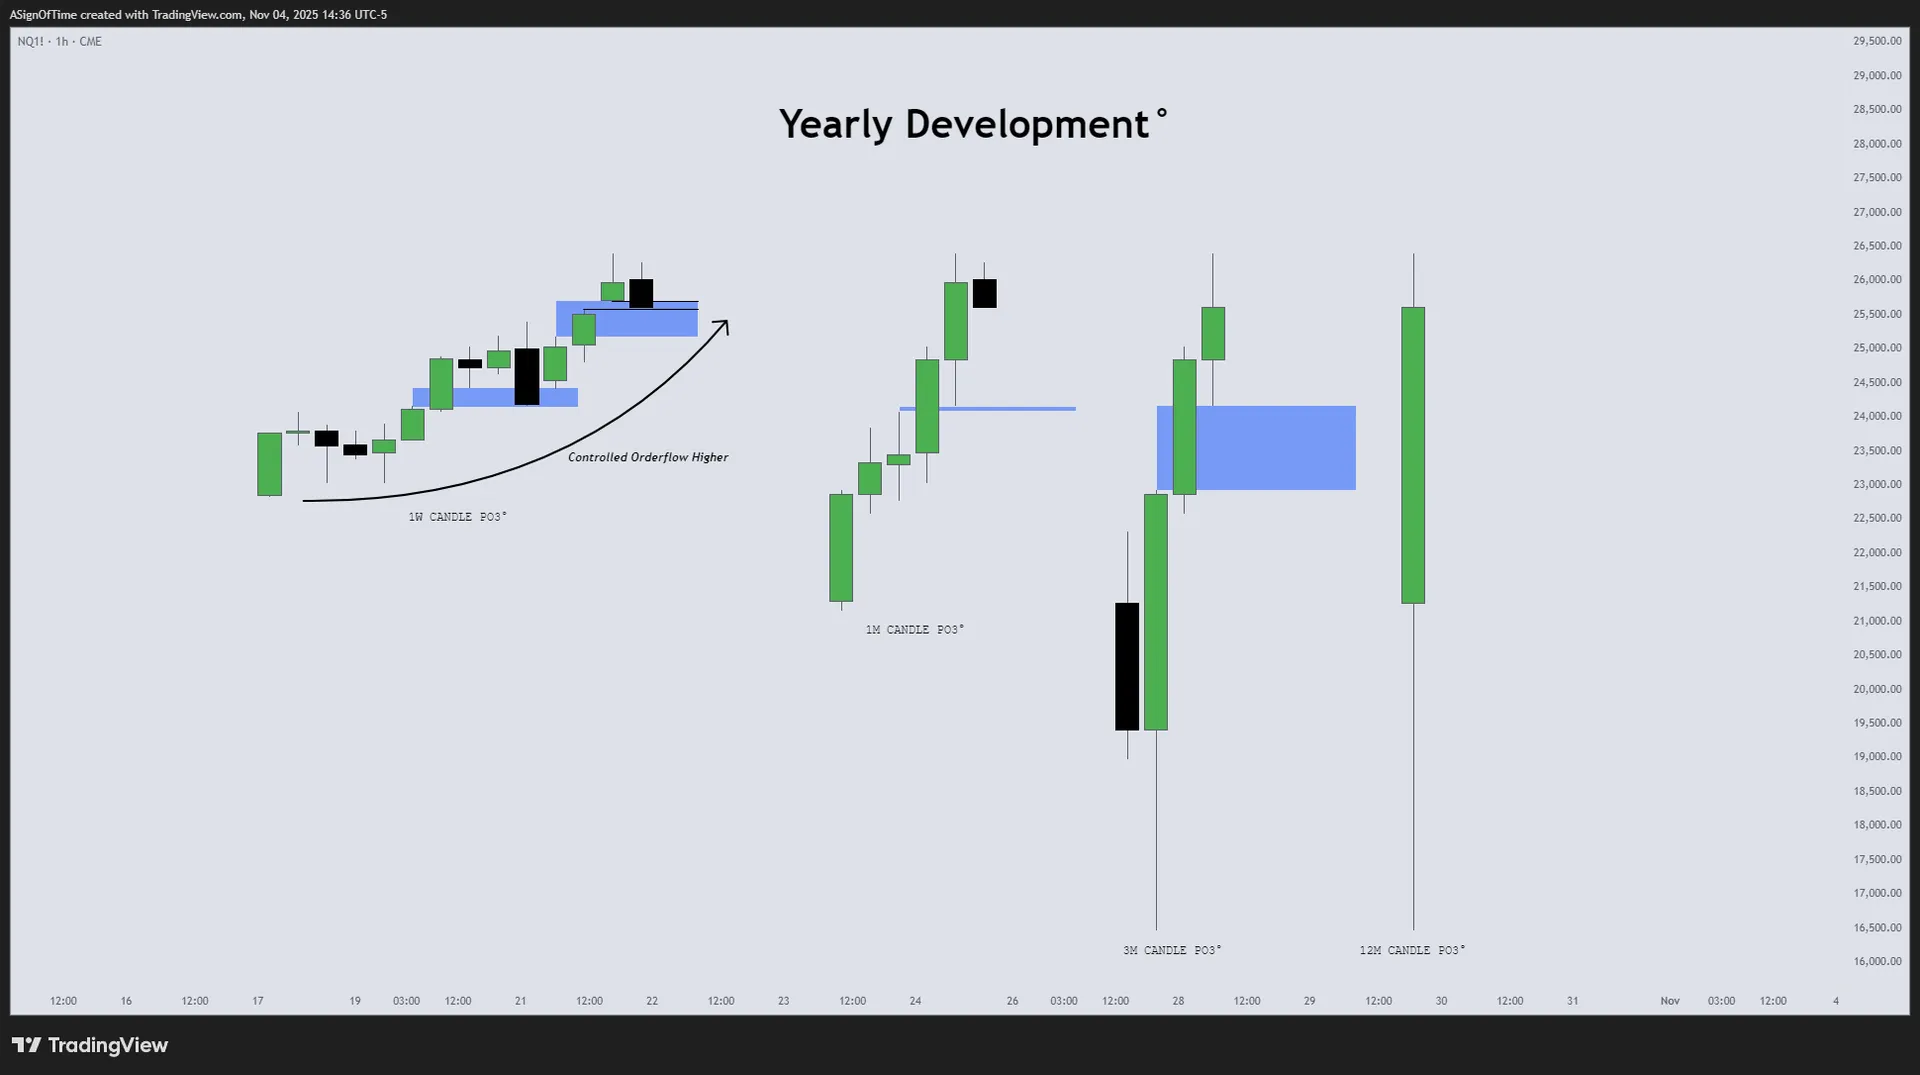
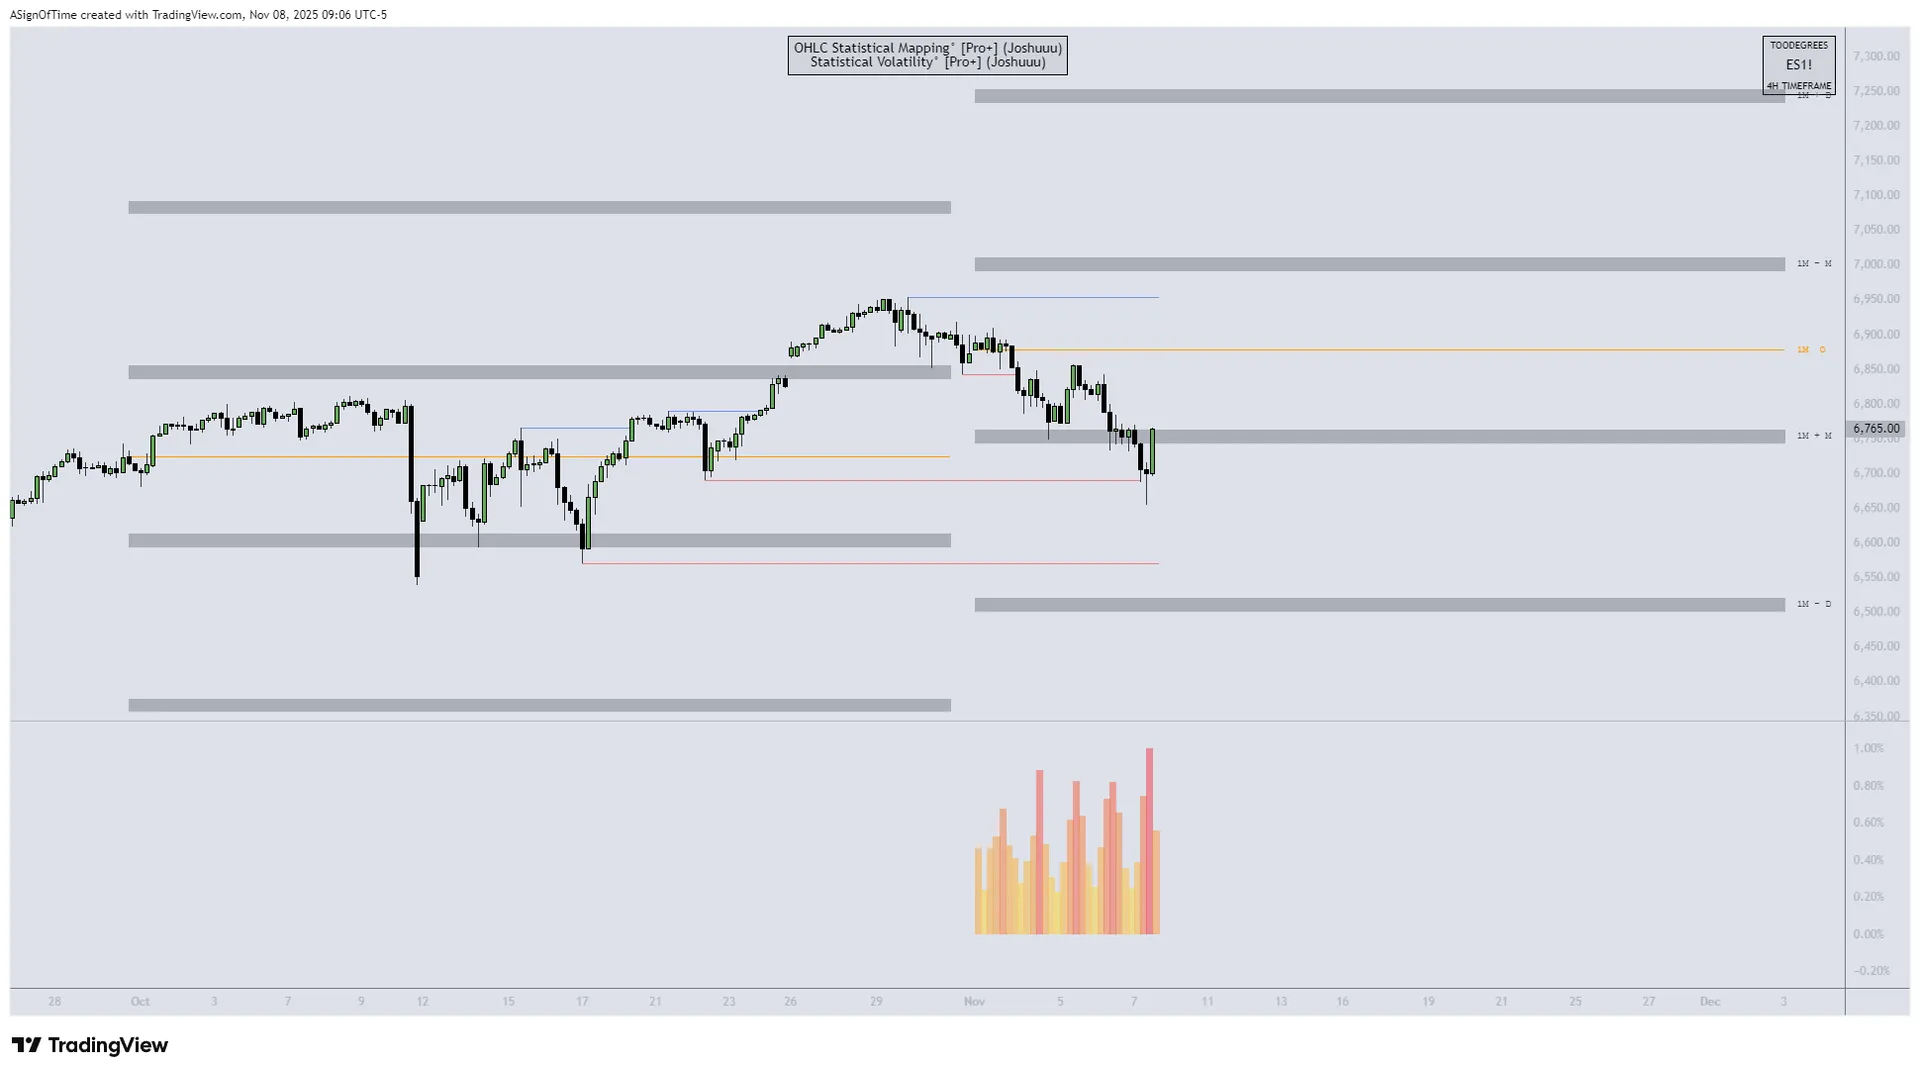
NQ Monthly Recap — HTF Power of Three Dashboard
October saw NQ consolidate within the range established by Q3's volatility. After September's Fed-cut rally attempt, October retraced into monthly equilibrium, with neither bulls nor bears able to assert sustained control. Election uncertainty kept participation muted — a pattern that historically resolves with sharp directional moves once political outcomes clarify.
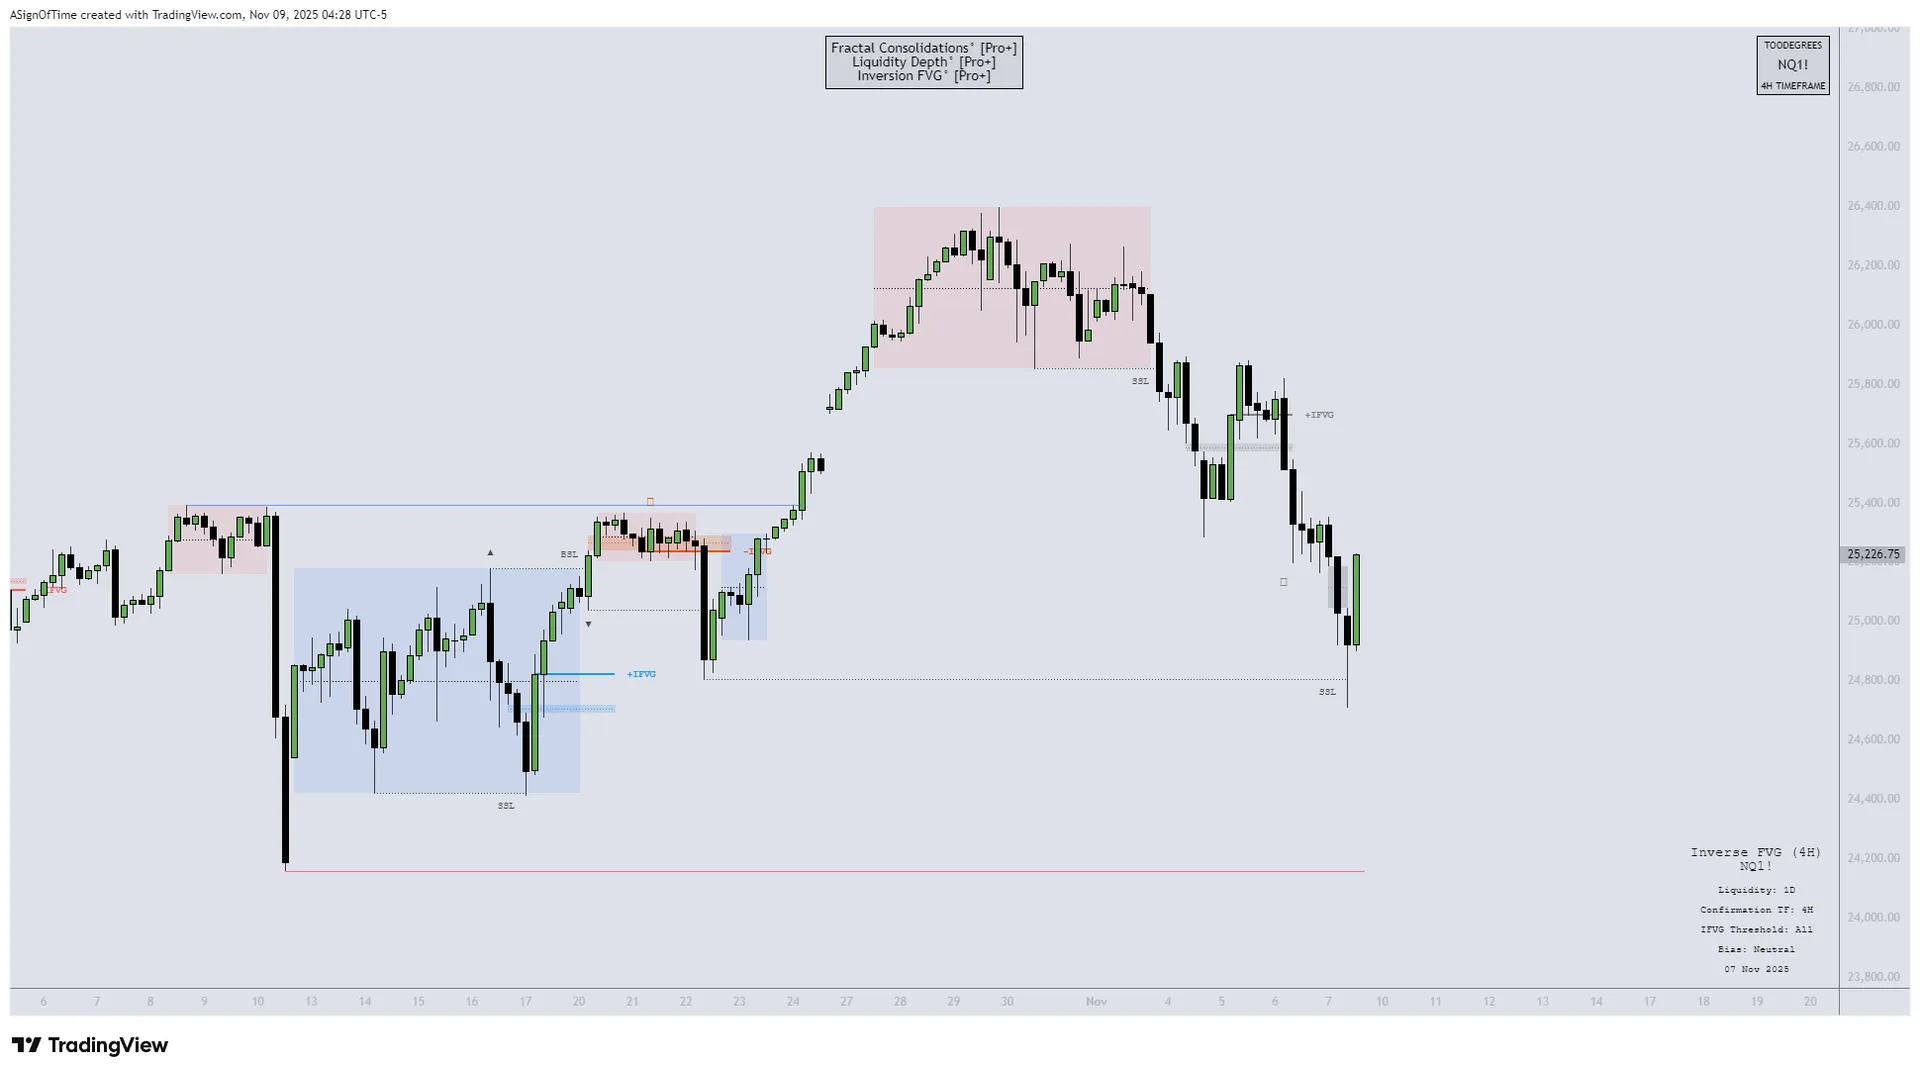
Multi-Asset IPDA — October 1st Anchored
IPDA Lookback anchored at the start of October, measuring Relative Strength across NQ, ES, and YM relative to the 60-day lookback period.
[E-MINI NASDAQ 100]
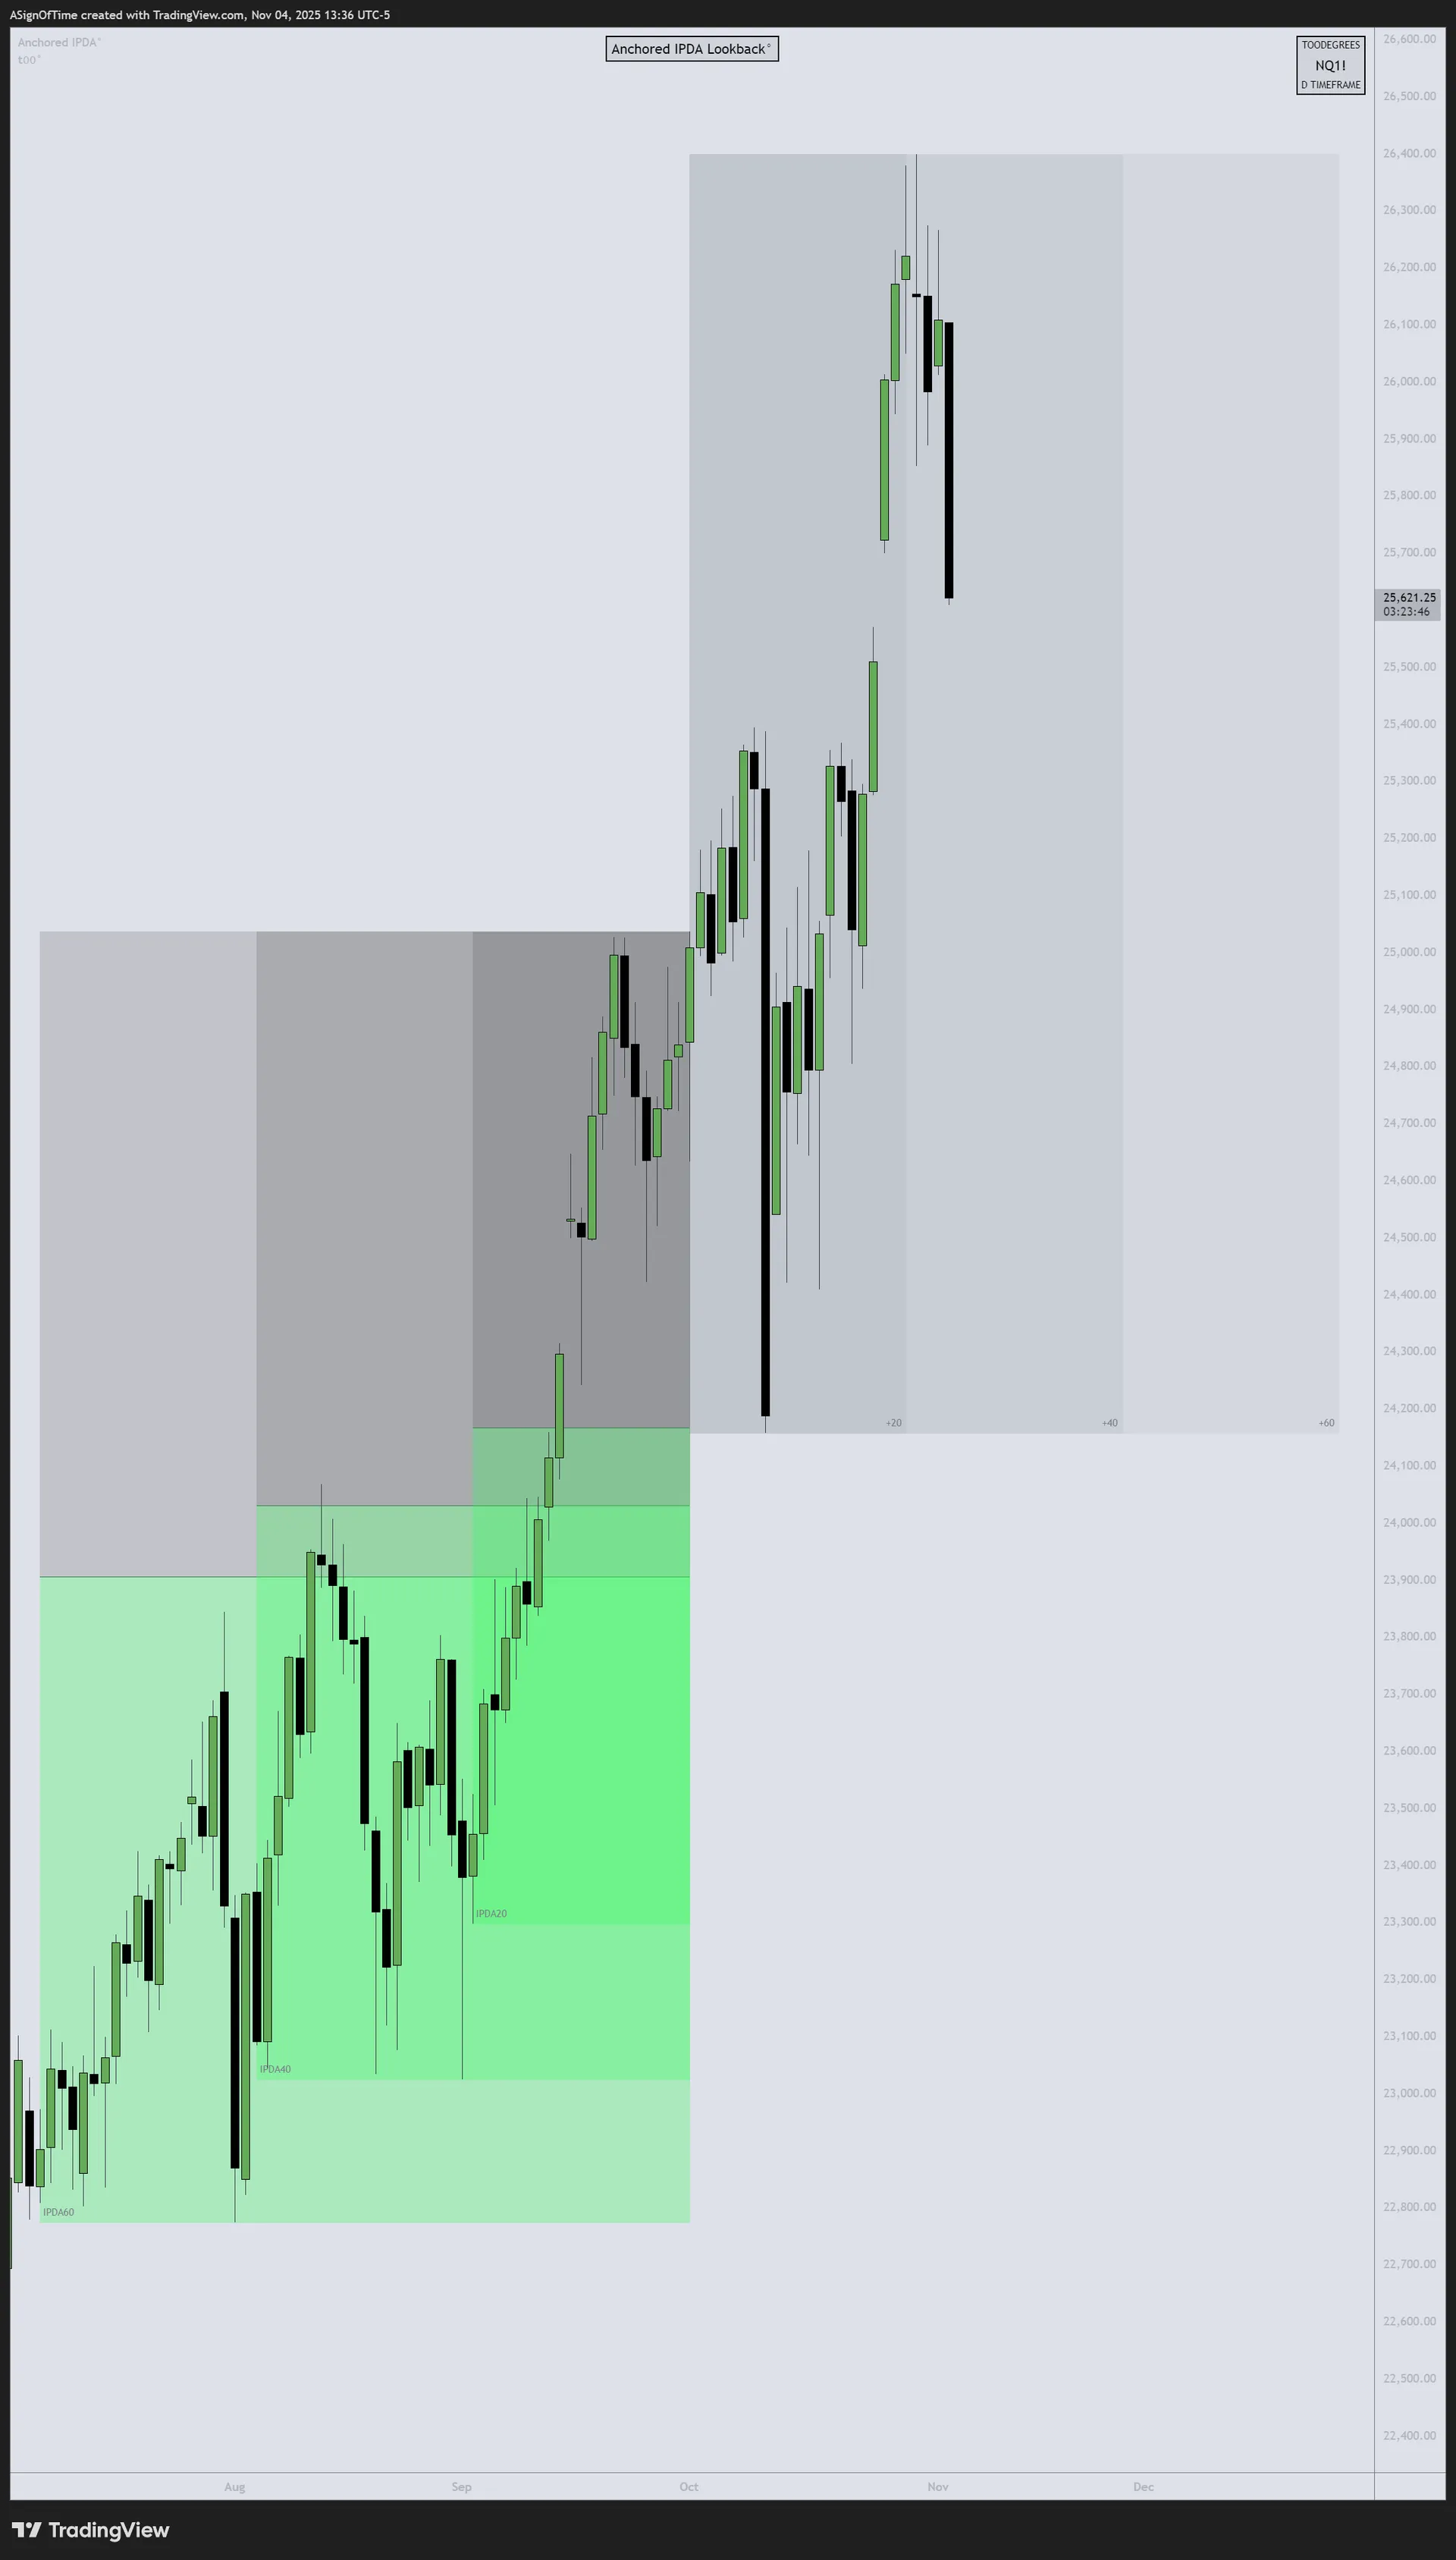
Consolidation Mode
[E-MINI S&P 500]
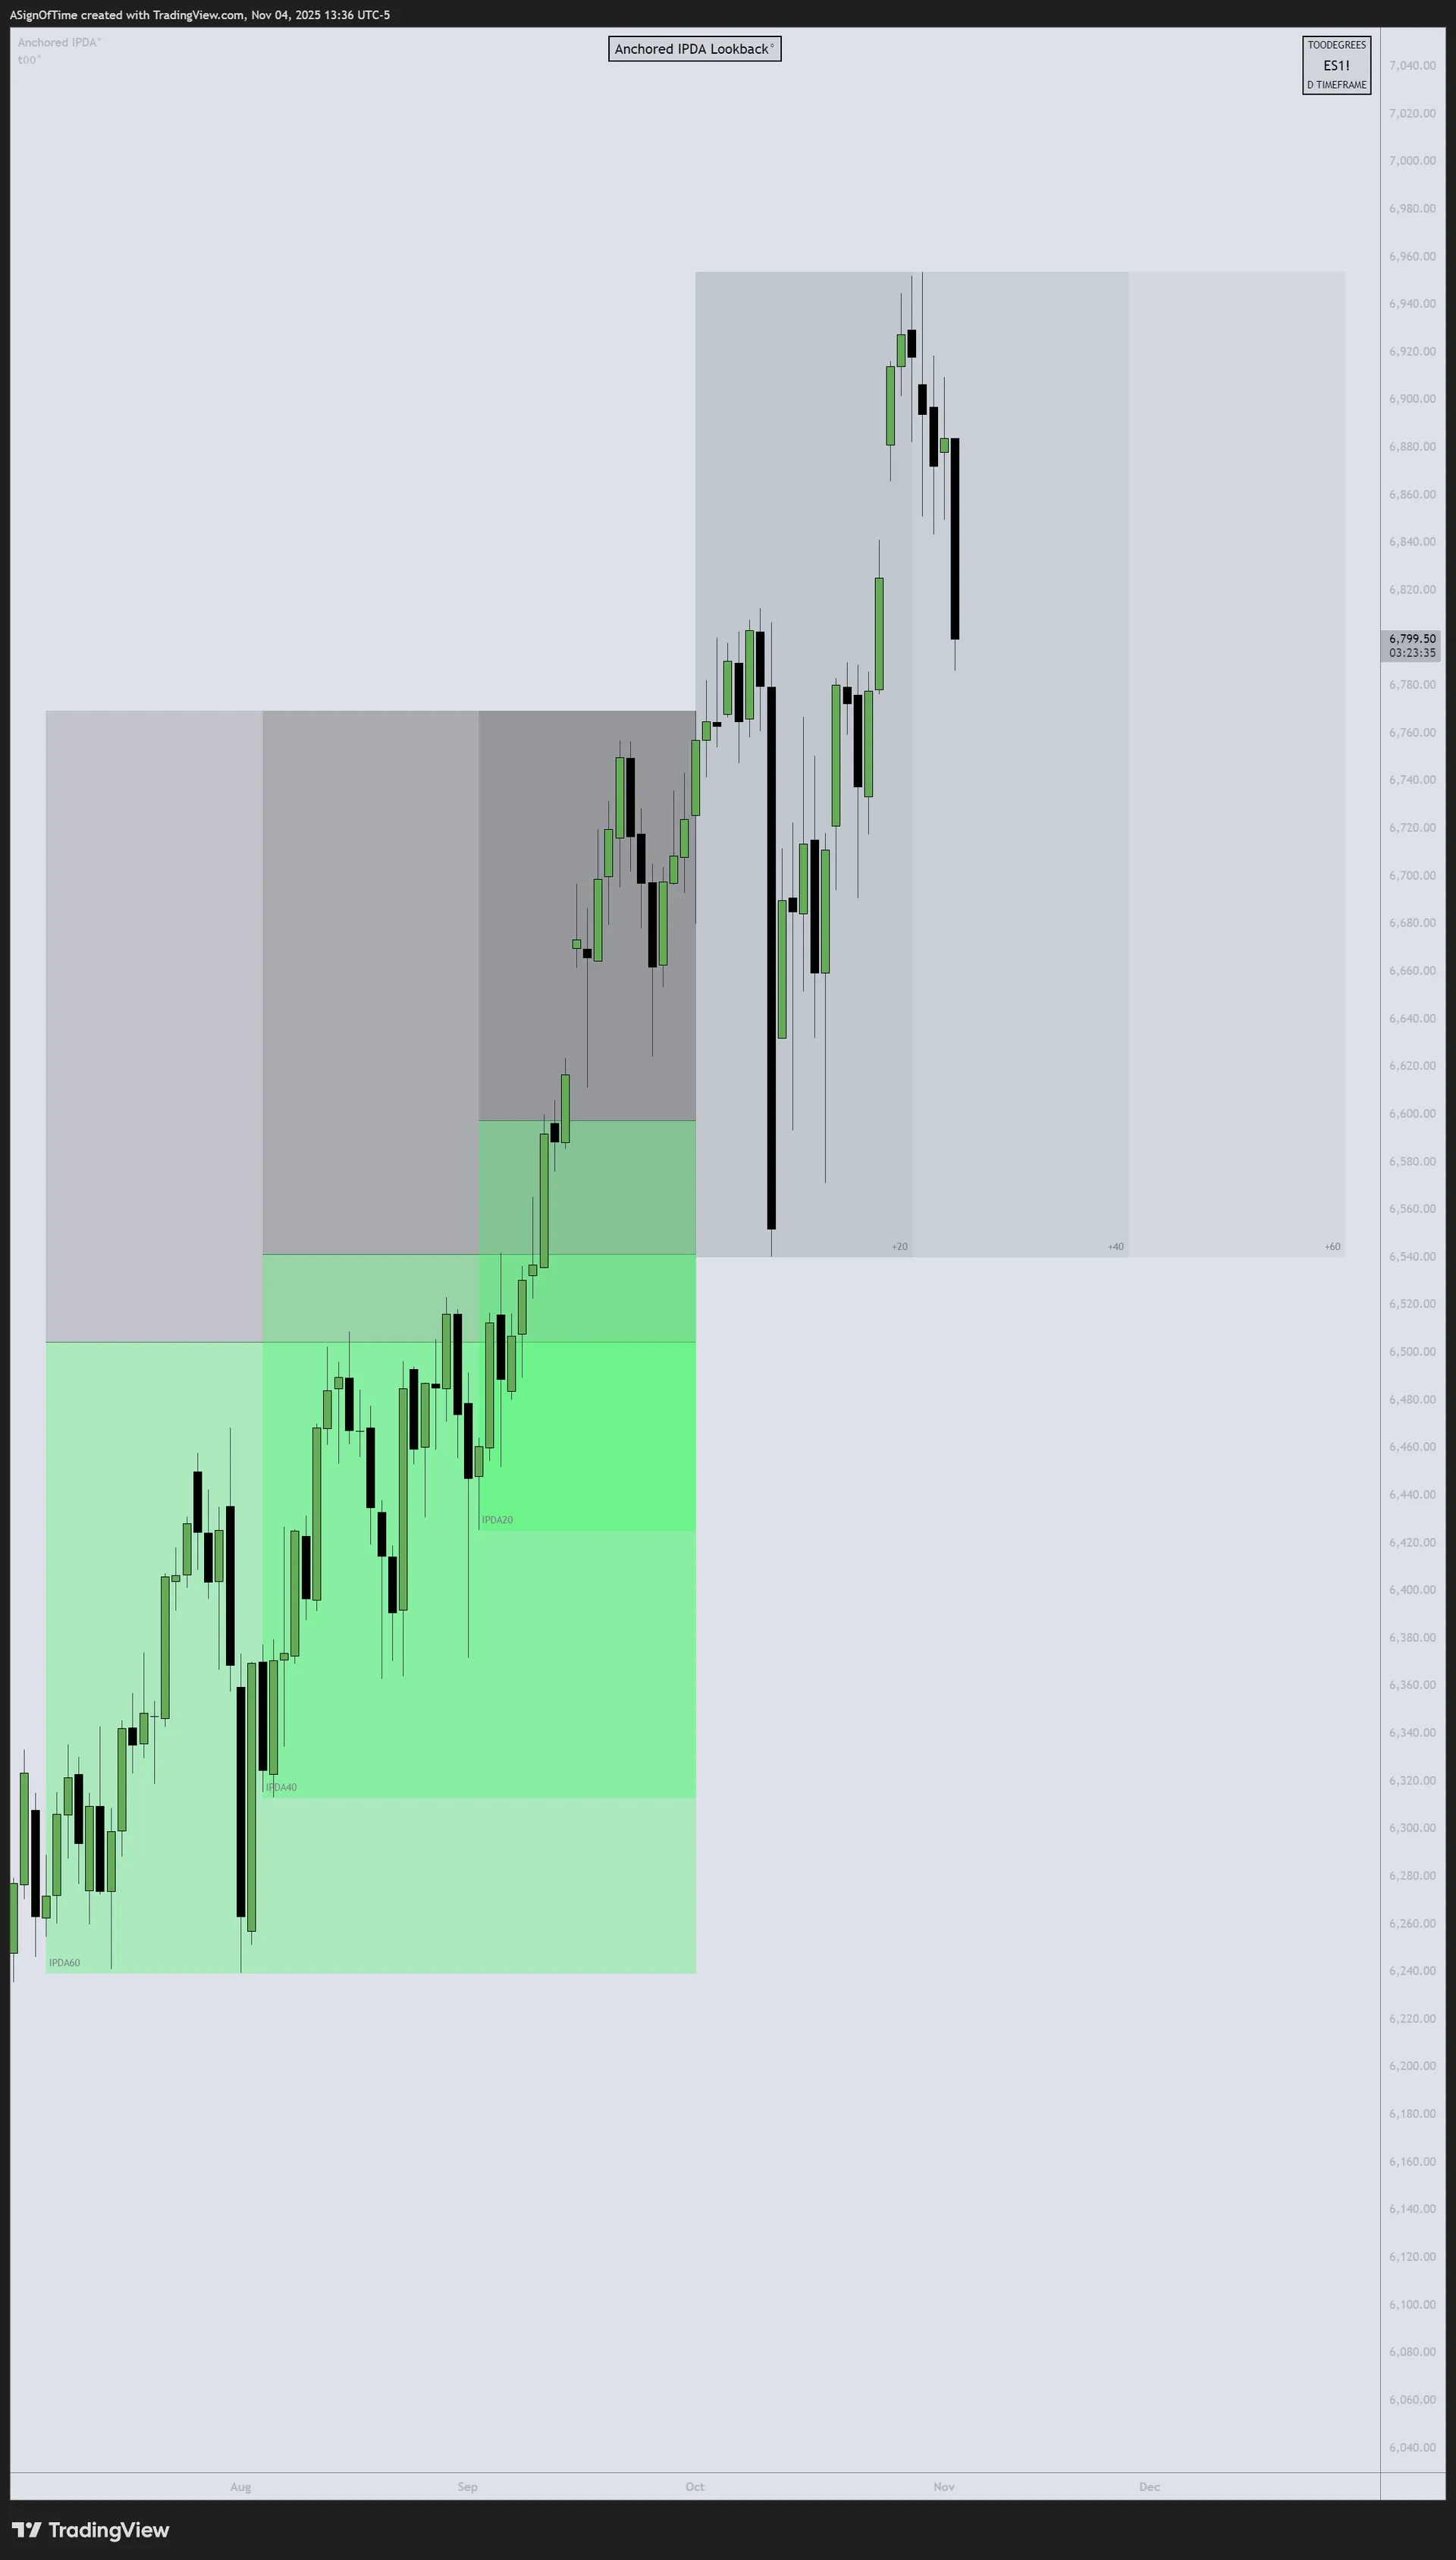
Defensive Stance
[E-MINI DOW JONES]
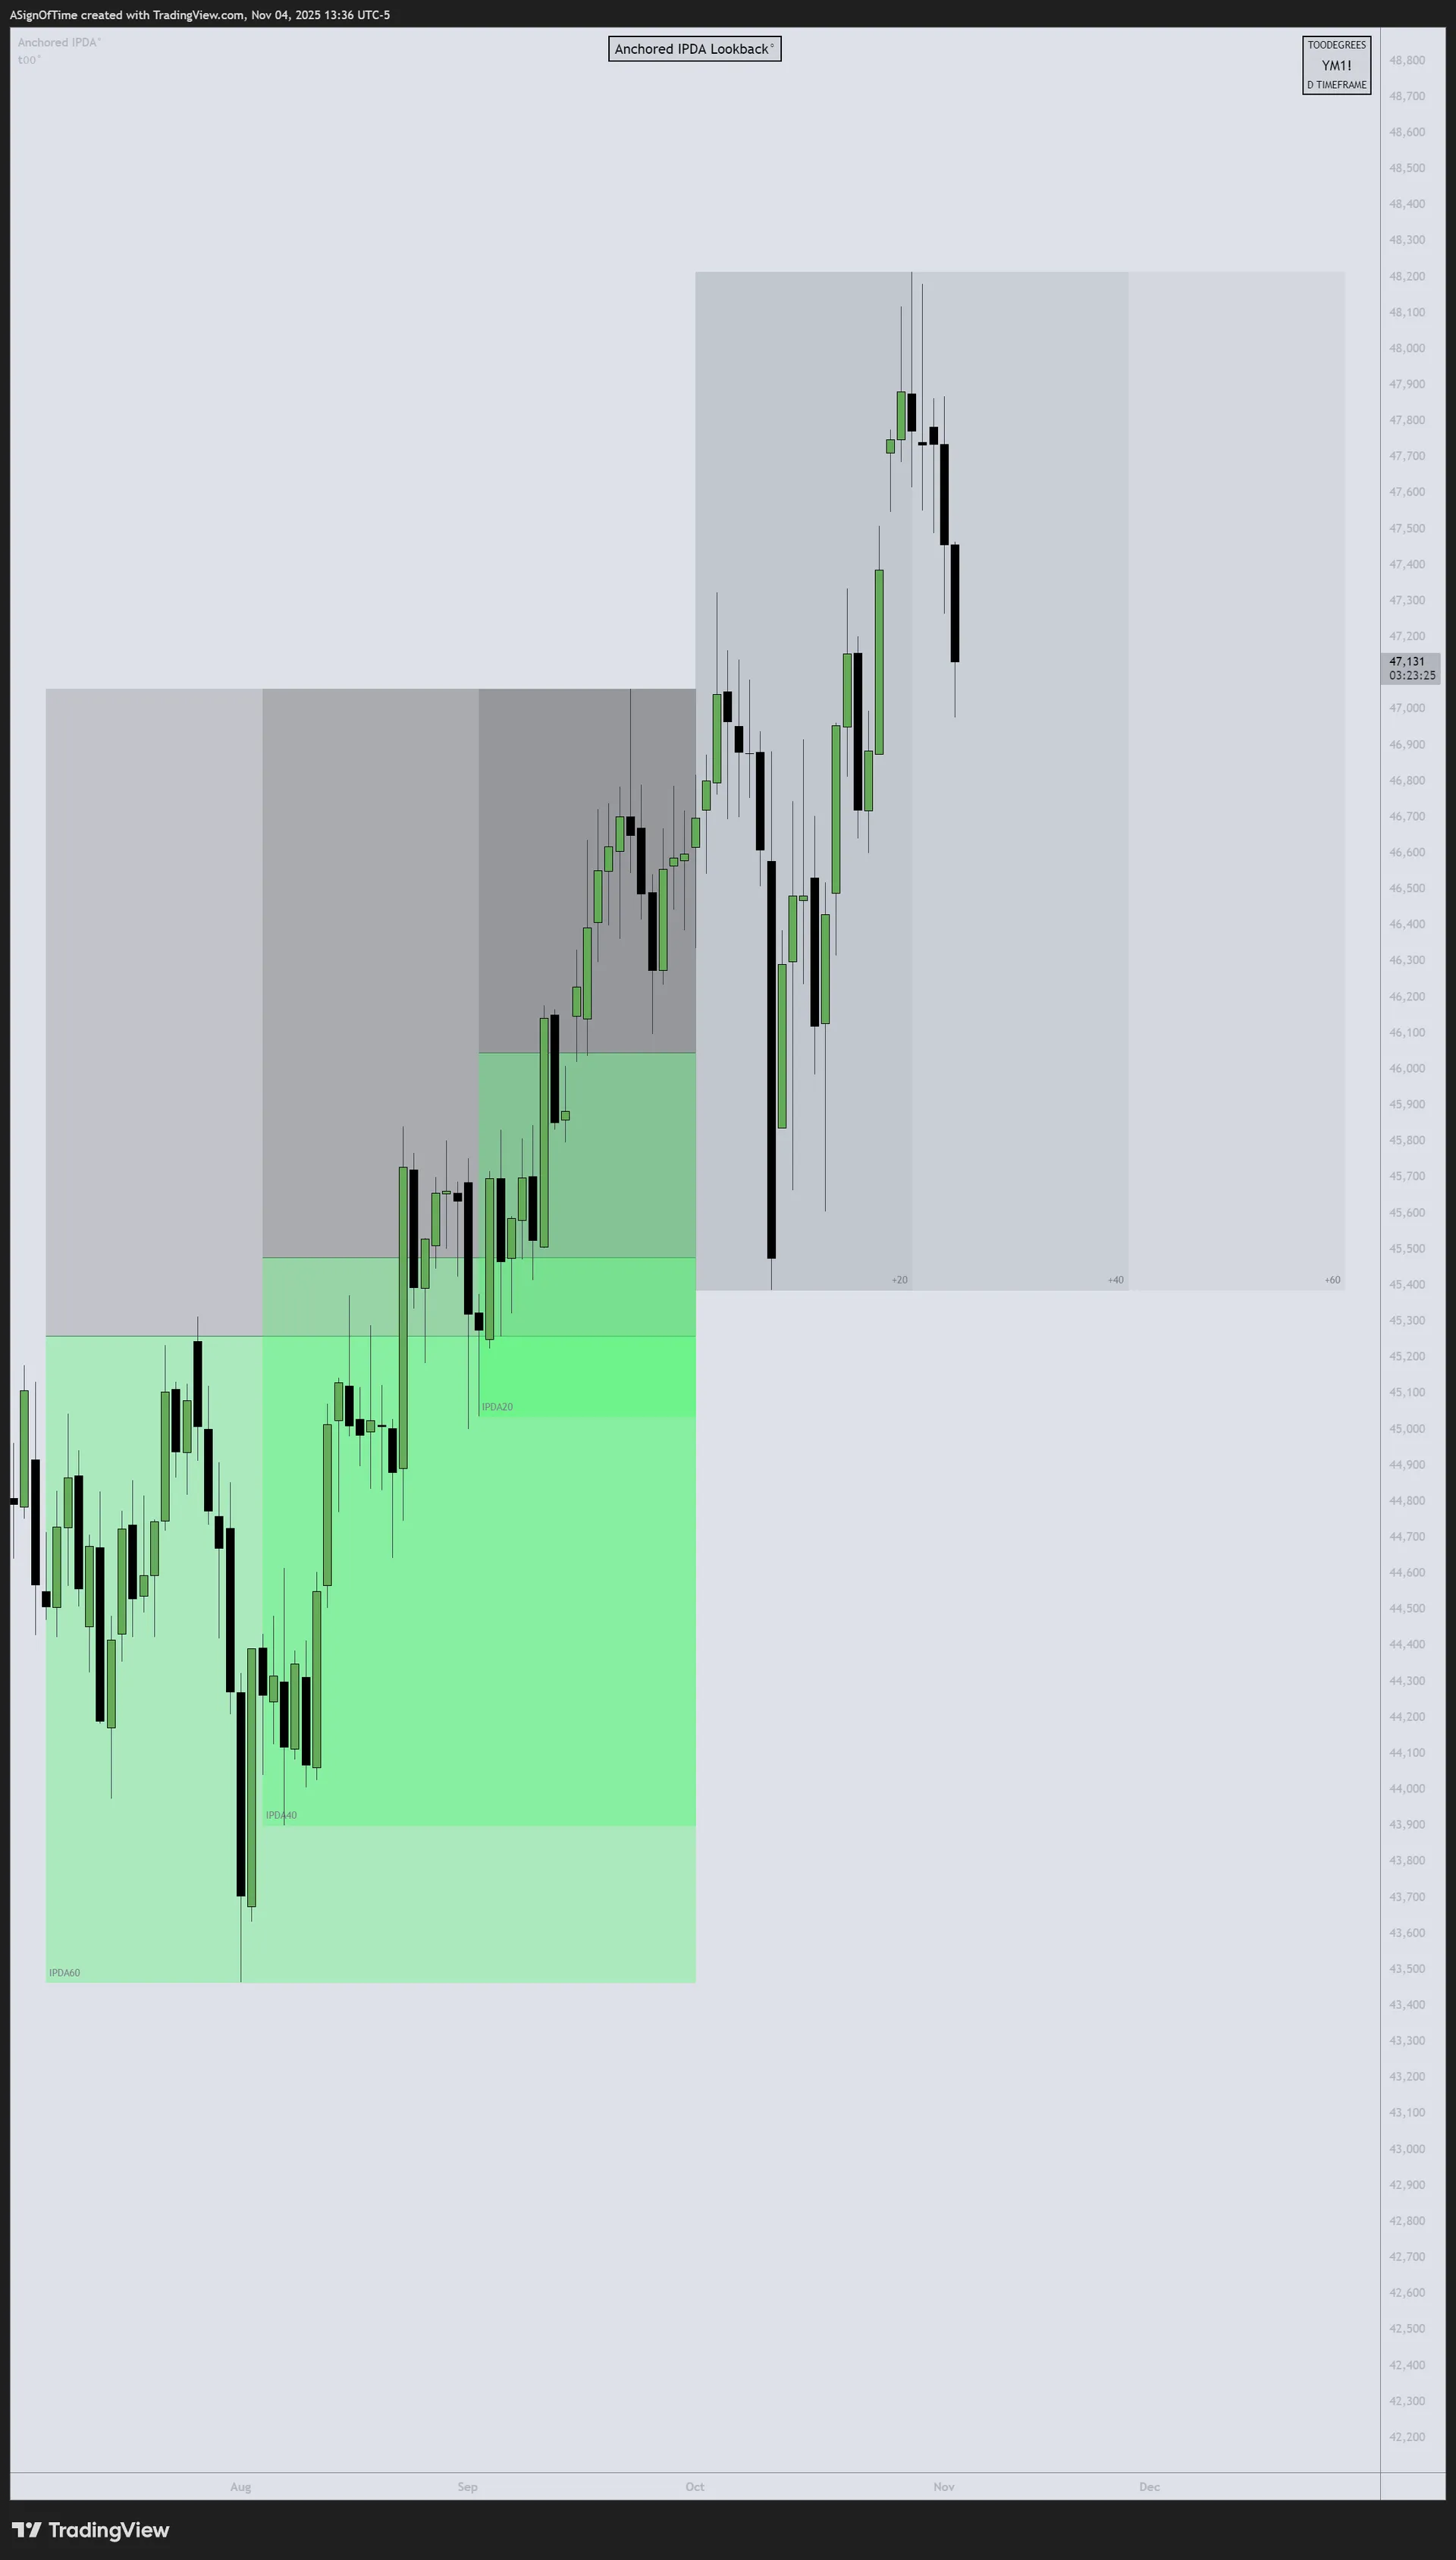
Continued Weakness
Analyst Insight
All three indices traded within tight ranges in October, with limited directional conviction. NQ held relative strength but failed to extend September's gains. ES and YM showed similar defensive behavior, with participants unwilling to commit ahead of election outcomes. The lack of sustained breakouts in either direction suggests coiled energy — post-election clarity could trigger sharp moves as hedges unwind and positioning resets.
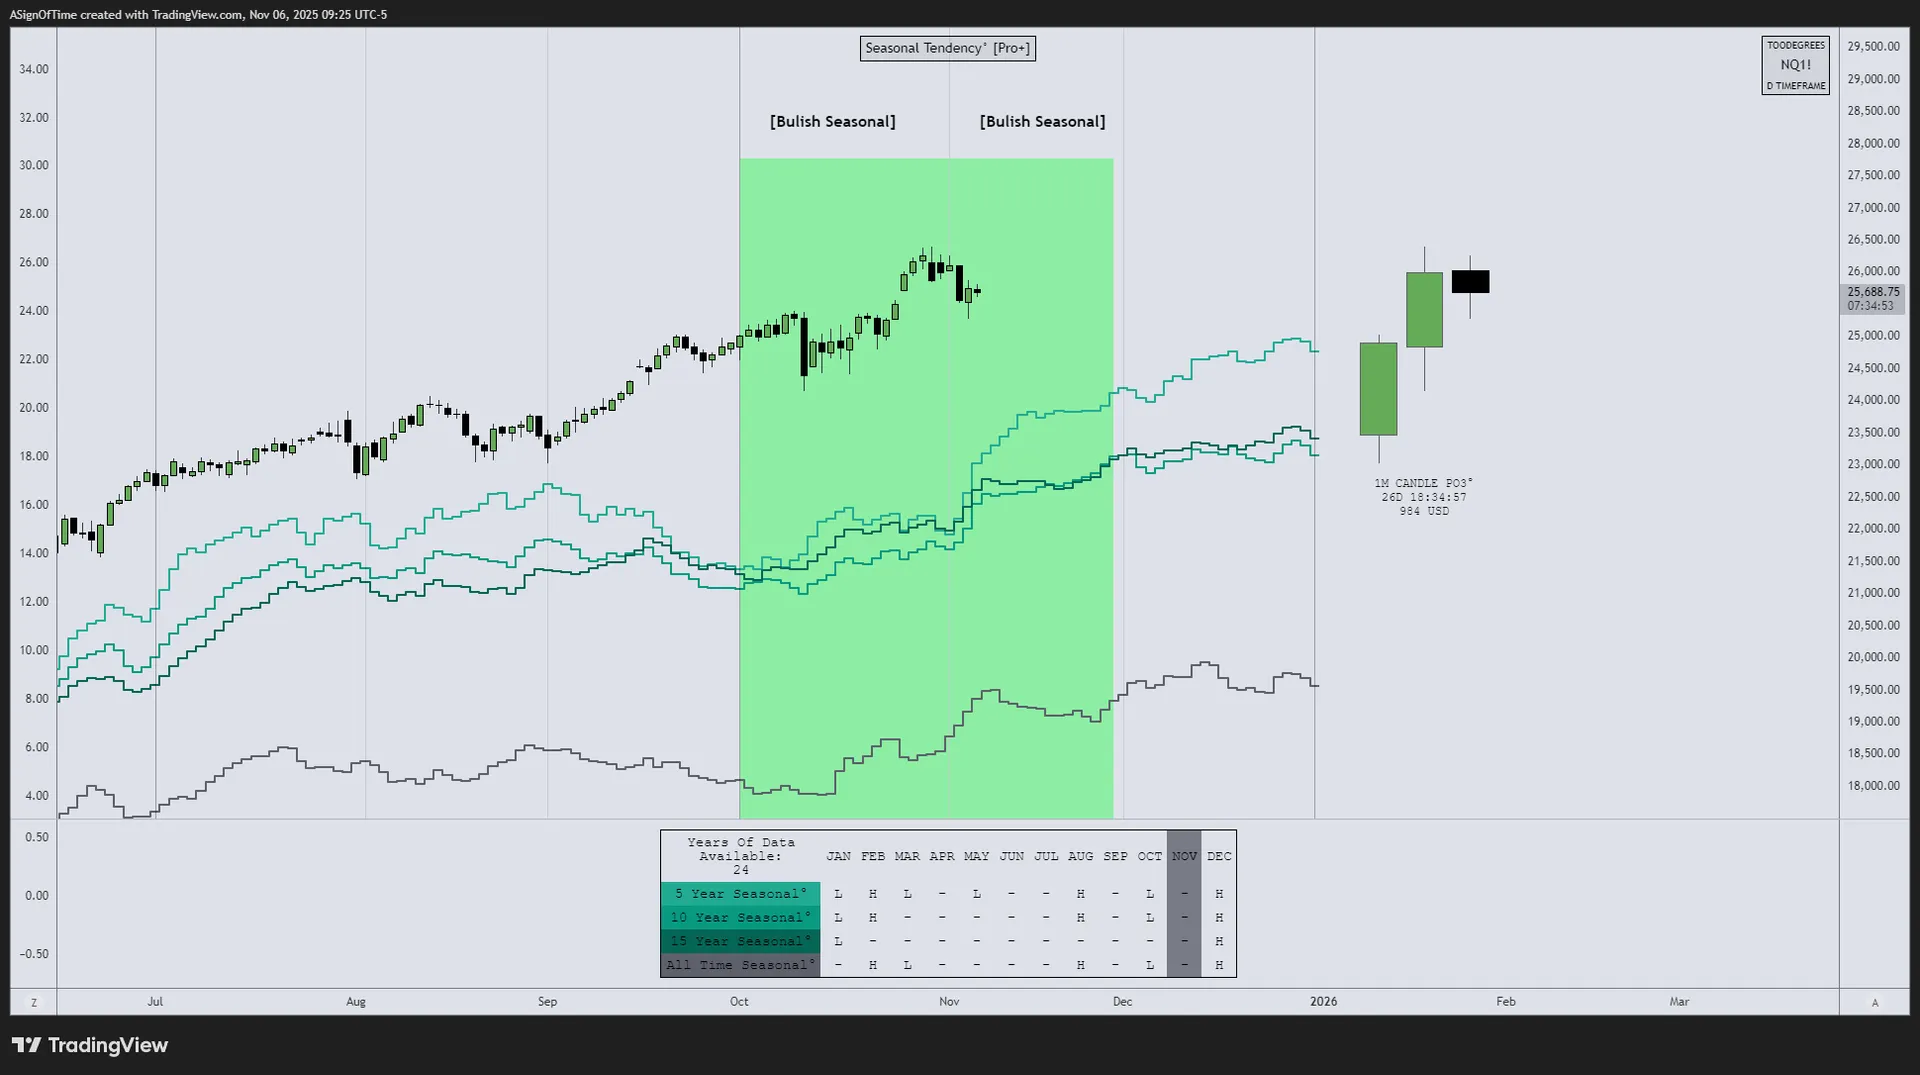
NQ Seasonality Analysis
Seasonal tendencies for the Nasdaq 100 E-Mini Futures. October historically marks a transition period before year-end positioning — the "October effect" can bring volatility, but post-election November often sees relief rallies.
NQ Commitment of Traders
Commercials maintained neutral to slightly short positioning in October, reflecting limited institutional appetite to add risk ahead of the election. The lack of strong directional bets from large players underscores the uncertainty — post-election, COT shifts could signal the next trend.
NQ Open Interest
Open Interest (OI) declined modestly in October, consistent with reduced speculative participation. Election-driven uncertainty kept traders on the sidelines — OI typically rebuilds once event risk clears and conviction returns.
Section 3
Inter-Market Dynamics — Currency & Bond Markets
October Results — Currency Markets
In October, the U.S. Dollar Index (DXY) climbed approximately +2.2%, extending its Q3 strength as global uncertainty and pre-election safe-haven flows supported the greenback. EUR/USD fell roughly –2.0%, pressured by dovish ECB signals and weak Euro-area growth data. GBP/USD dropped –1.8%, with UK fiscal concerns and broad dollar strength weighing on sterling.
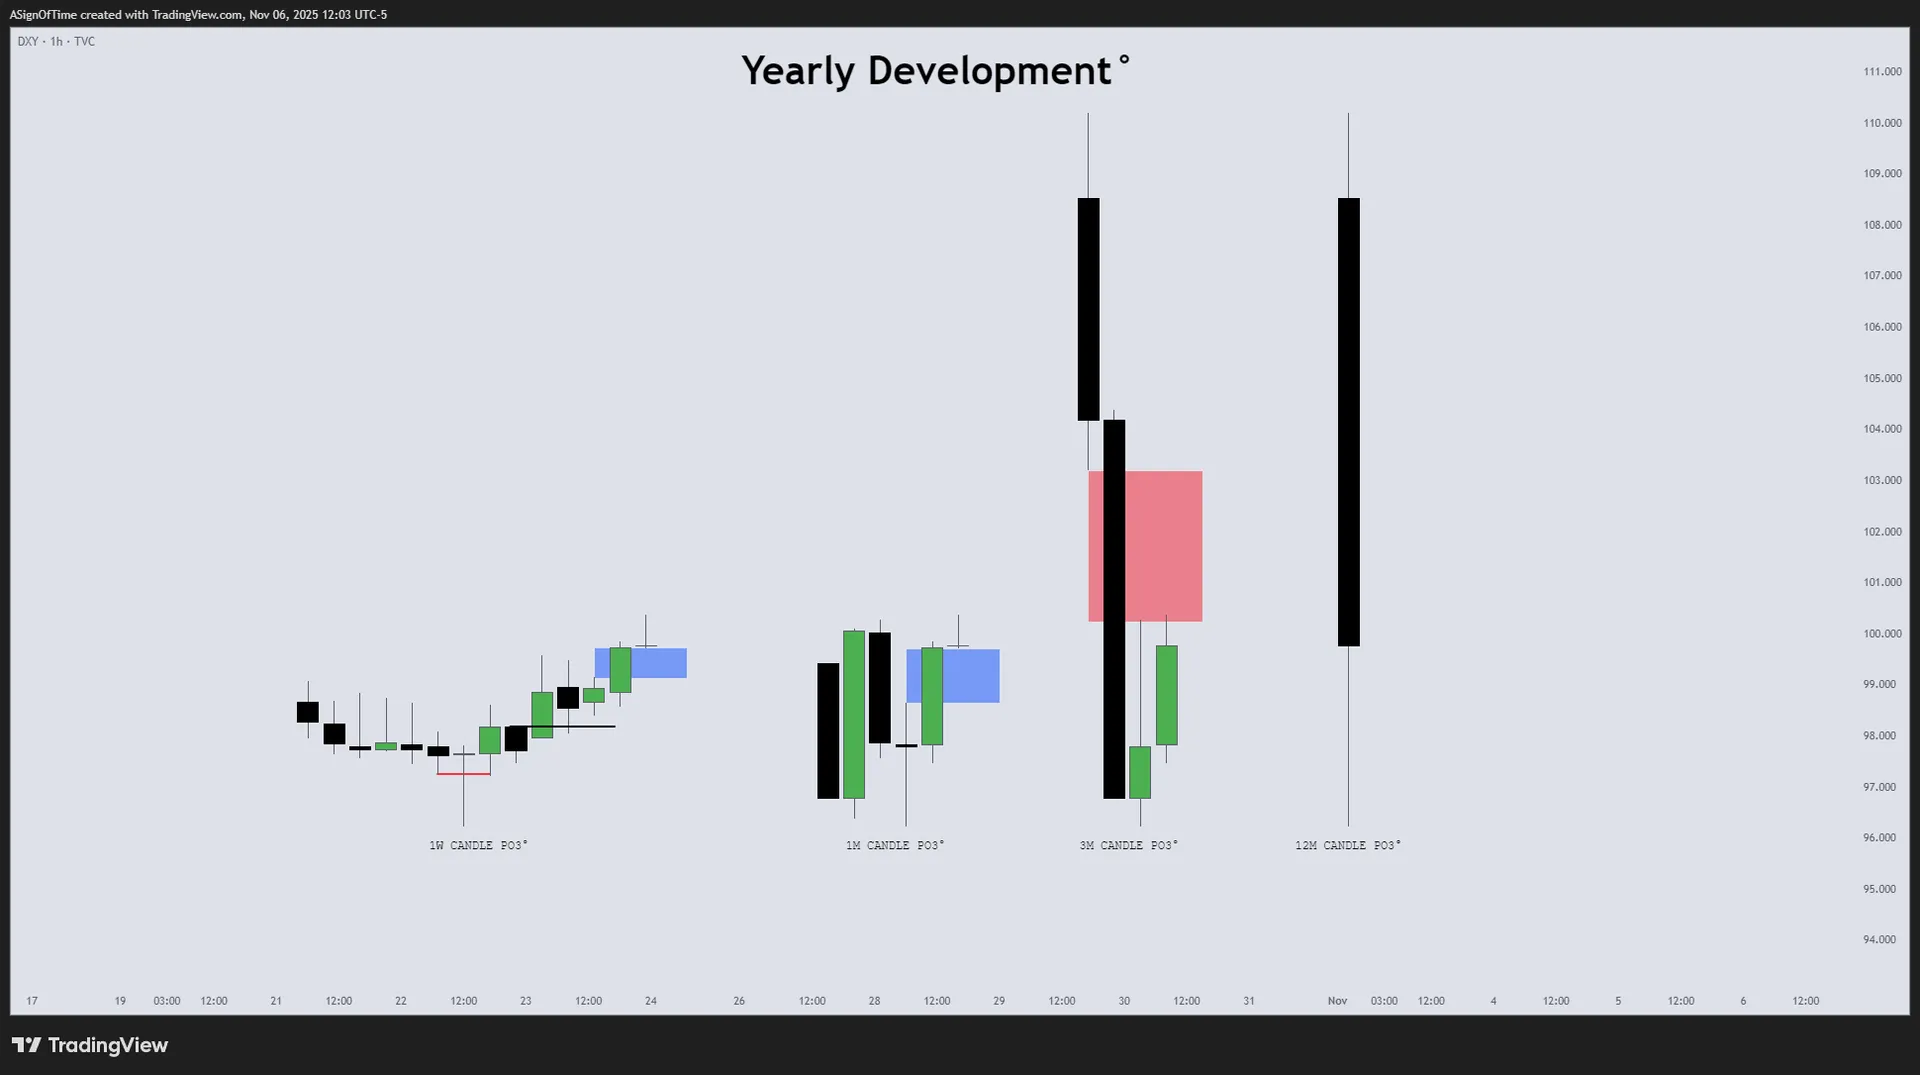
DXY Monthly Recap
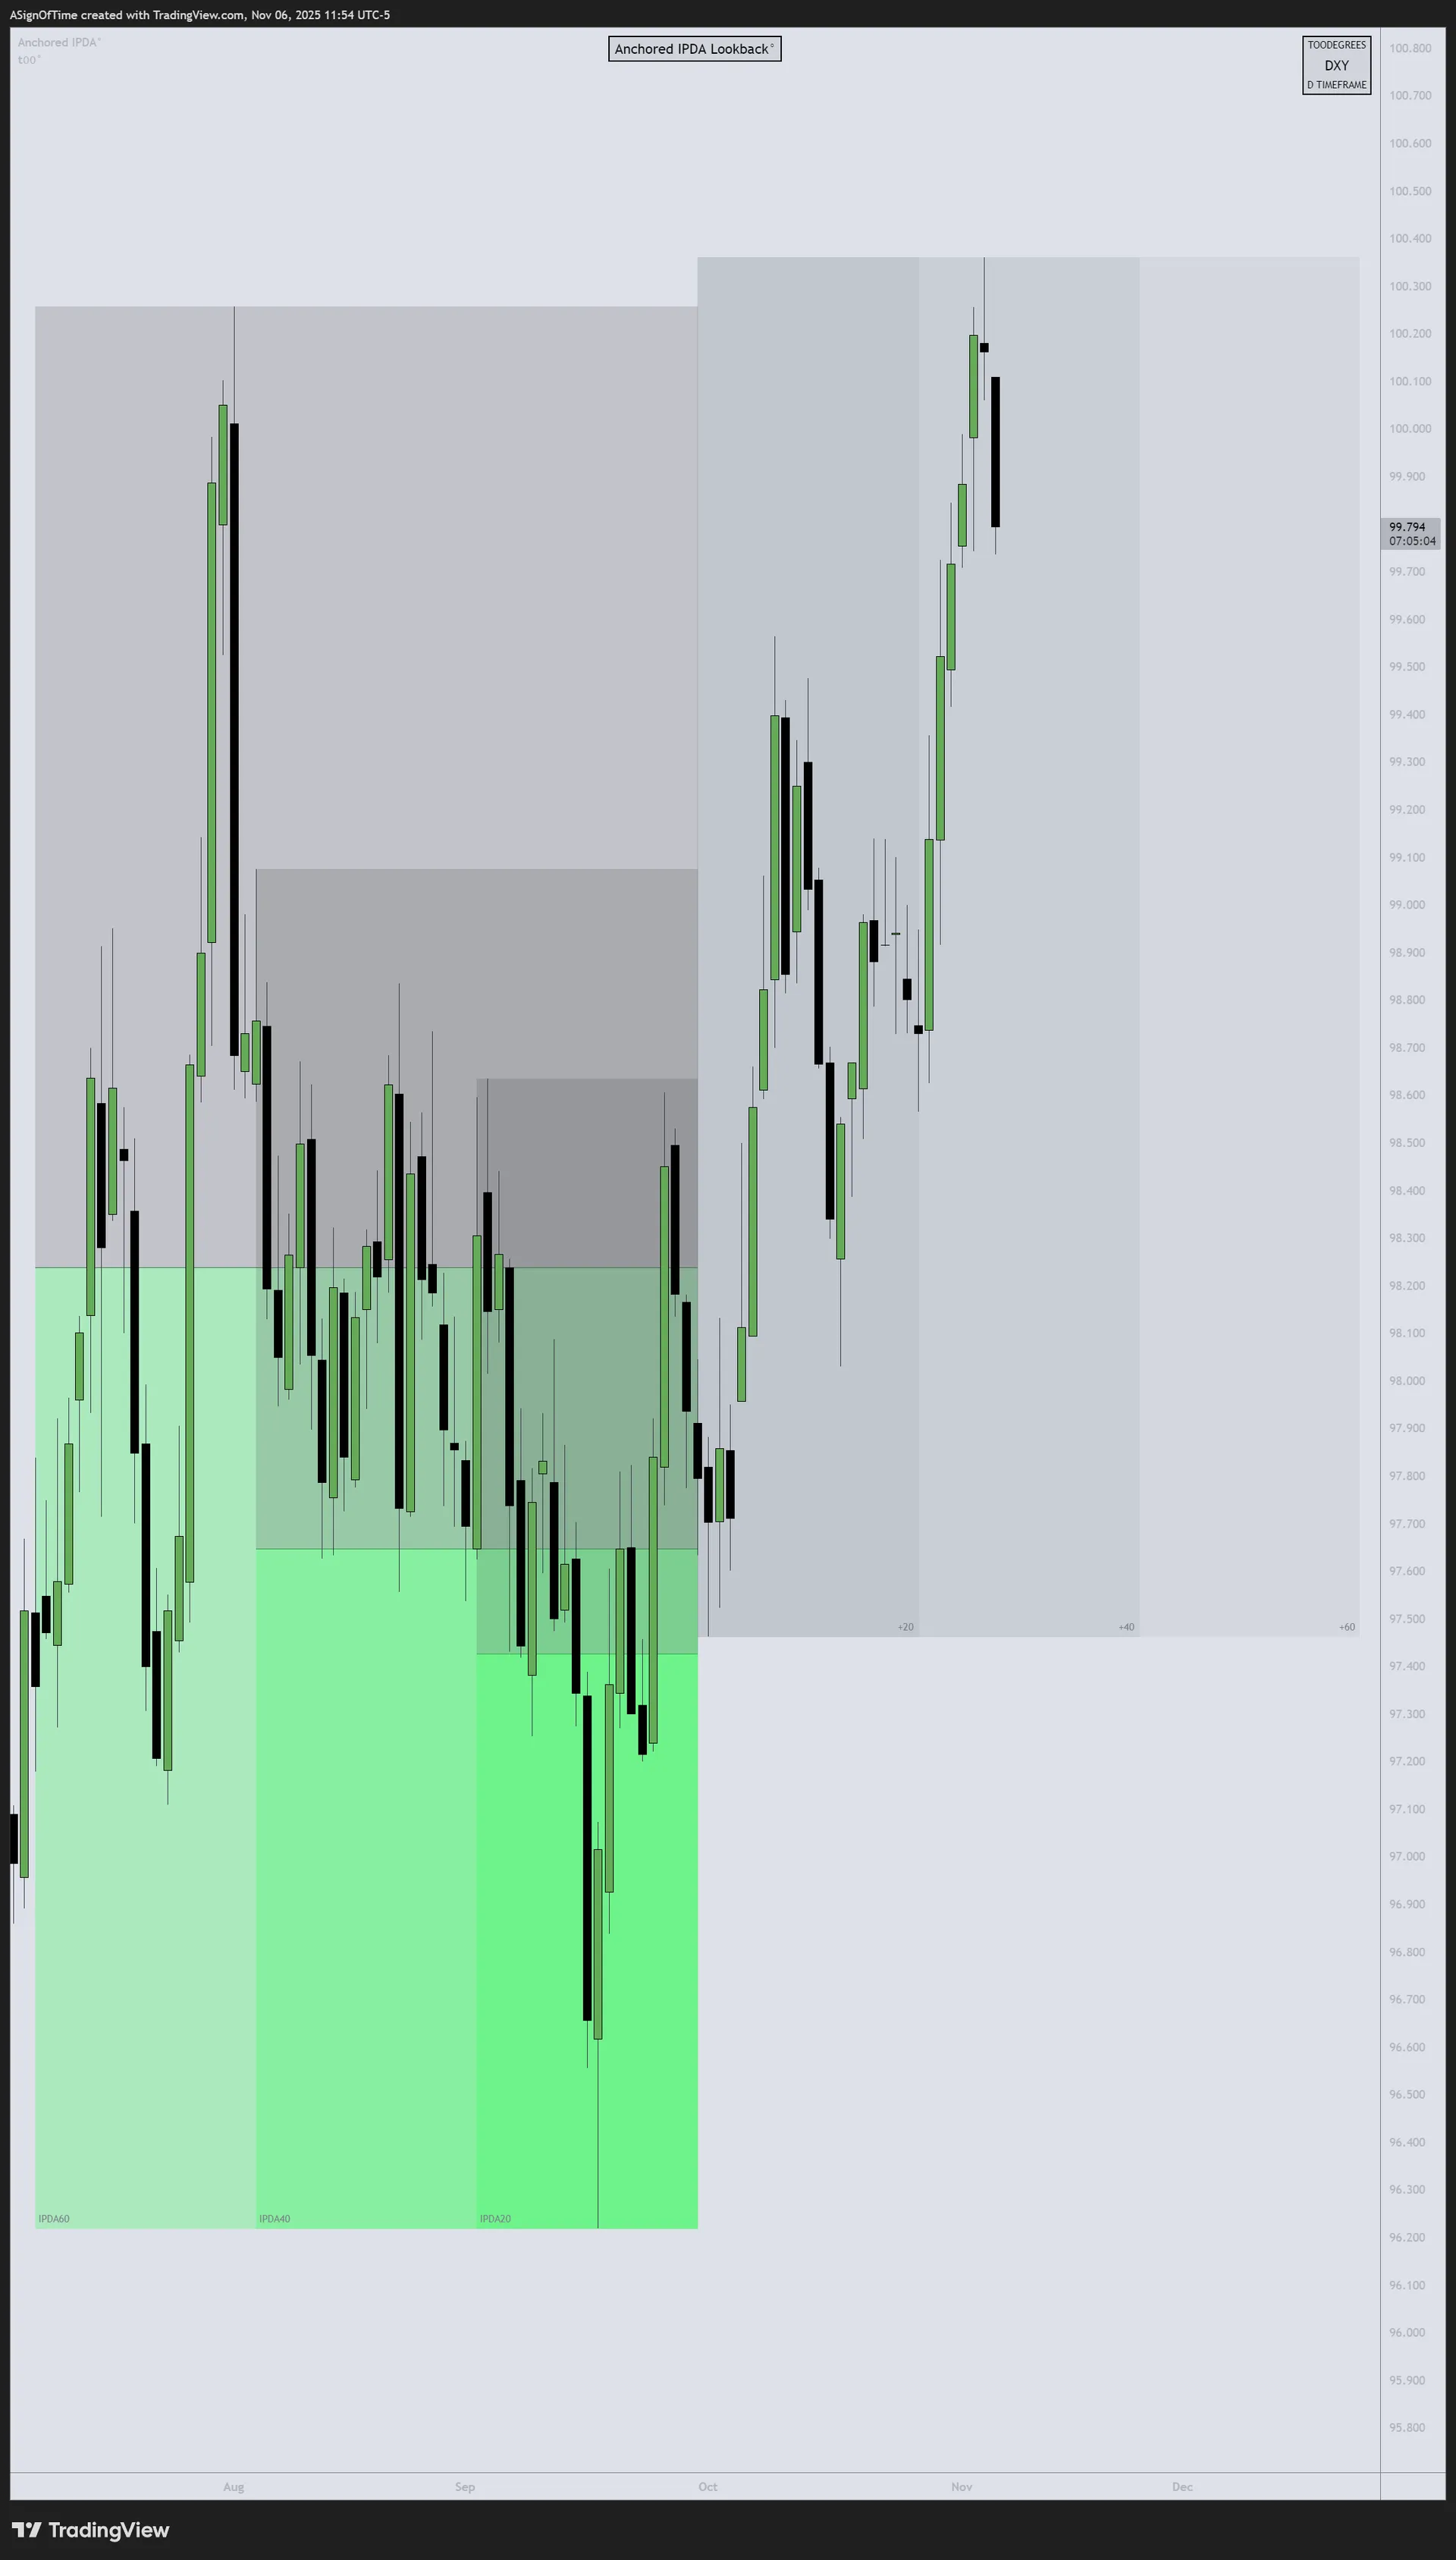
DXY — IPDA Analysis
DXY broke above its October-anchored IPDA range, building on Q3's reversal and confirming the dollar's renewed strength. The move was supported by both safe-haven demand and improving U.S. economic data relative to global peers — COT data shows commercials maintaining strong long positioning.
Inter-Market Dynamics Summary
| Metric | NQ | DXY | T-Bonds |
|---|---|---|---|
| Orderflow | Bearish → Neutral | Bullish → Bullish | Bullish → Mixed |
| Seasonality | Bearish → Neutral | Bullish → Bullish | Bullish → Neutral |
| Open Interest | Stable → Declining | Building → Strong Build | Bullish → Mixed |
| COT Report | Neutral → Slightly Short | Strong Long → Strong Long | Bullish → Neutral |
| Interest Rate | — | 4.75%–5.0% | — |
Format: Previous Report → Current Report
Section 4
Additional Resources
Free TradingView Tools
Interest Rate & GDP Dashboard
by toodegrees — Free on TradingView
ICT Anchored IPDA Ranges
by toodegrees — Free on TradingView
ICT Commitment of Traders
by toodegrees — Free on TradingView
Seasonal Open Interest
by toodegrees — Free on TradingView
Community Resources
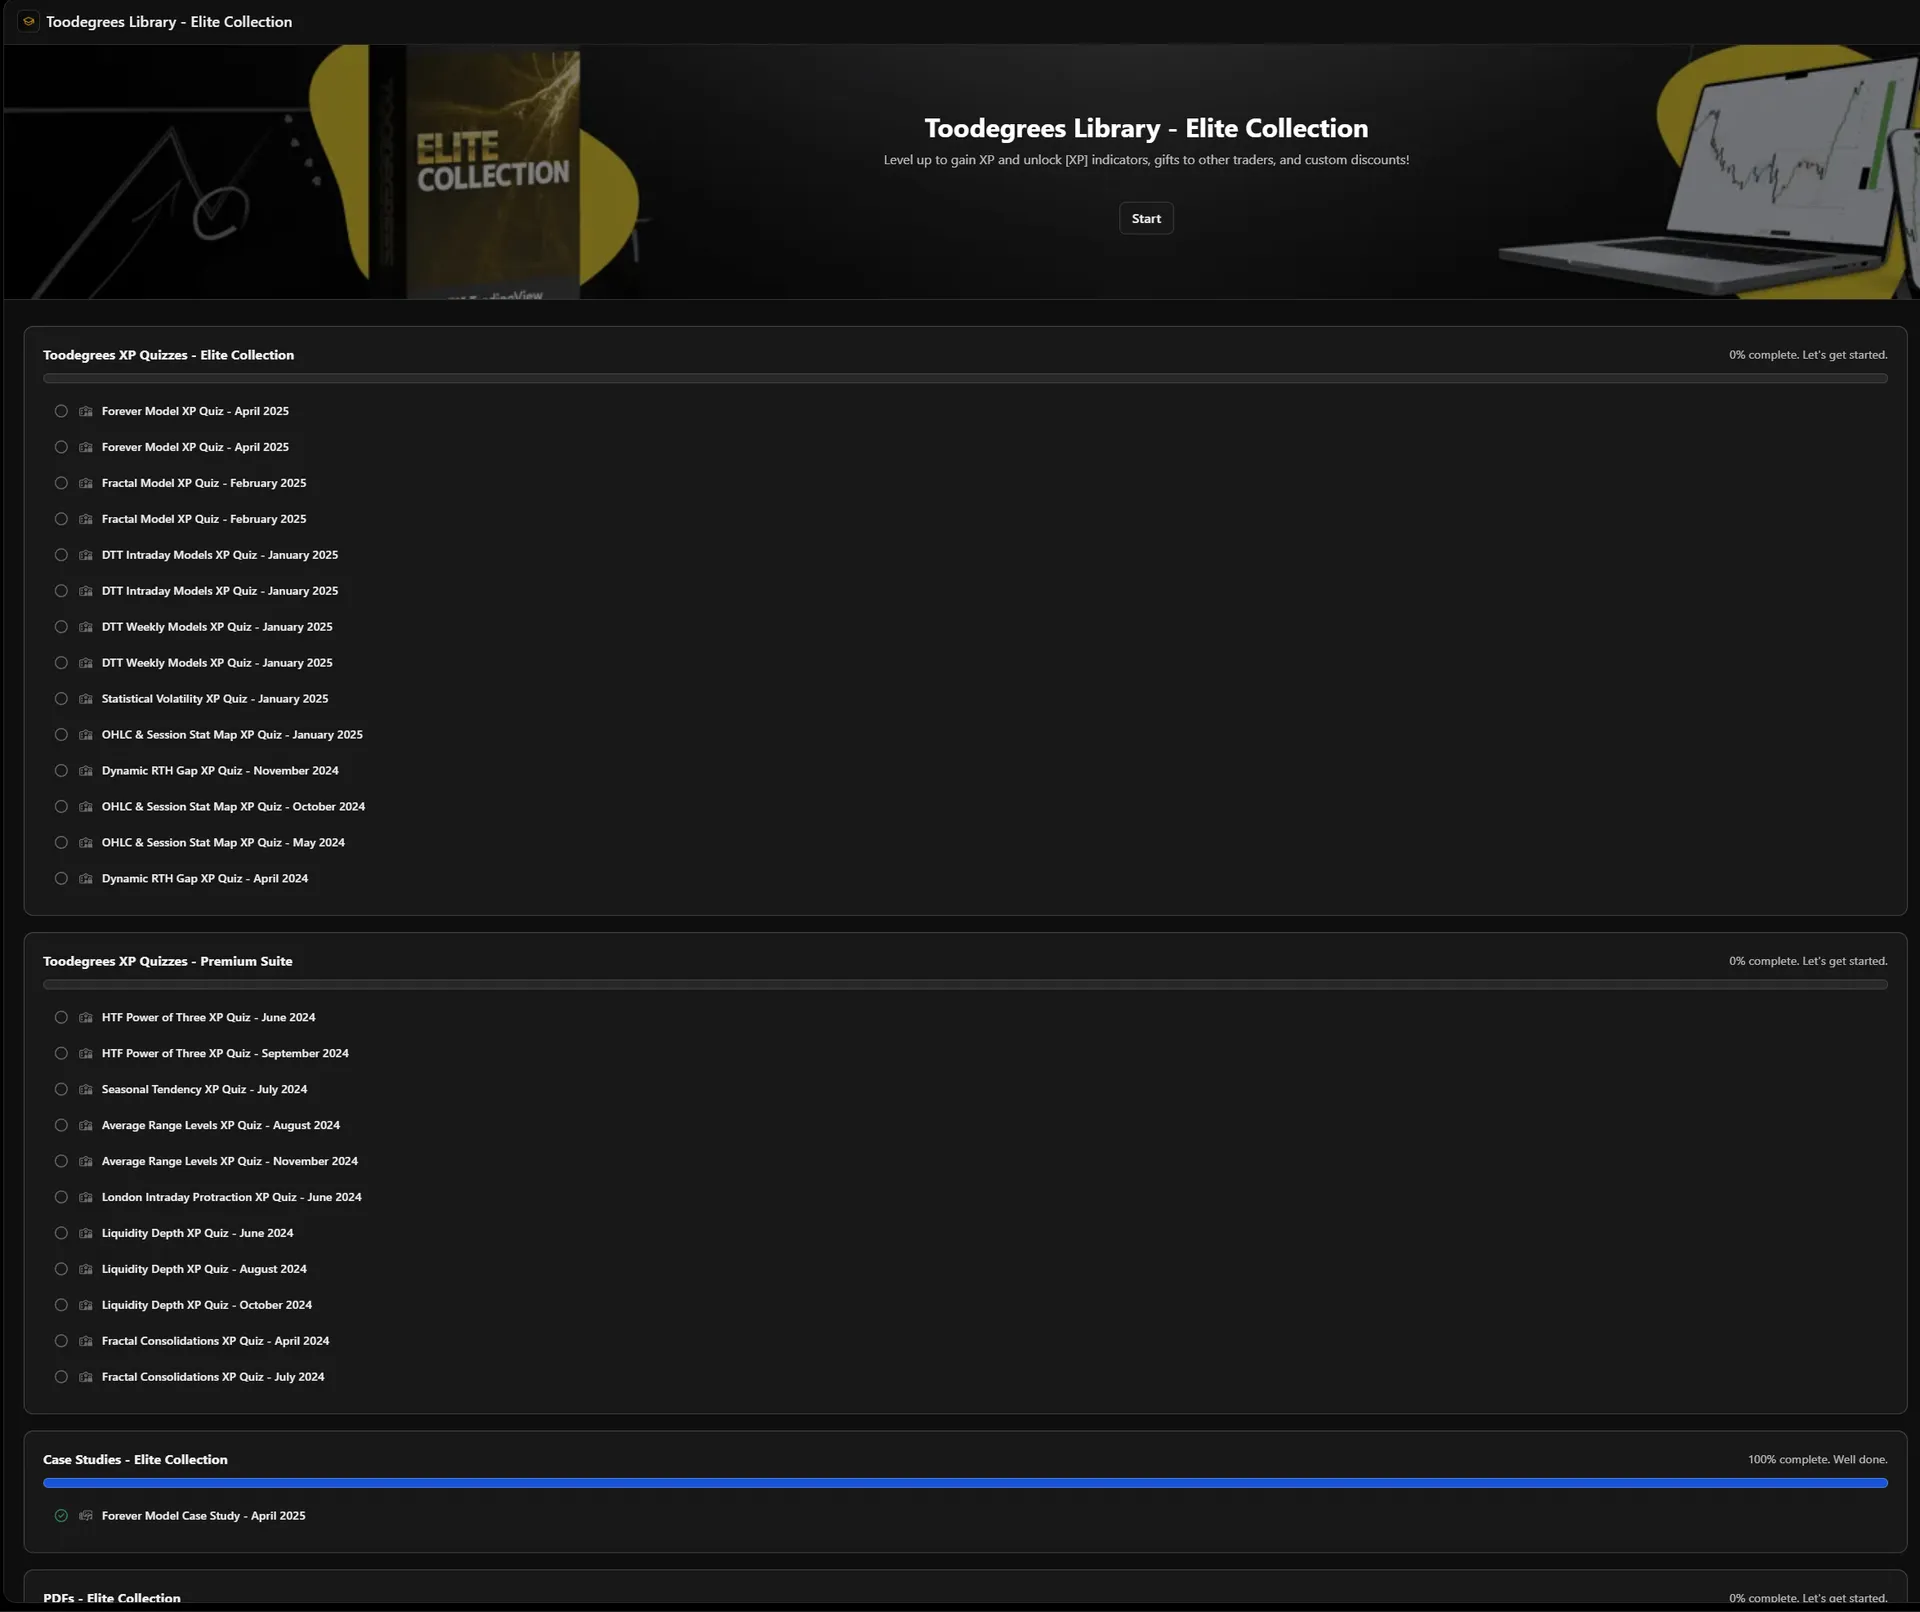
Toodegrees Library
Access all EOM Reports & premium content
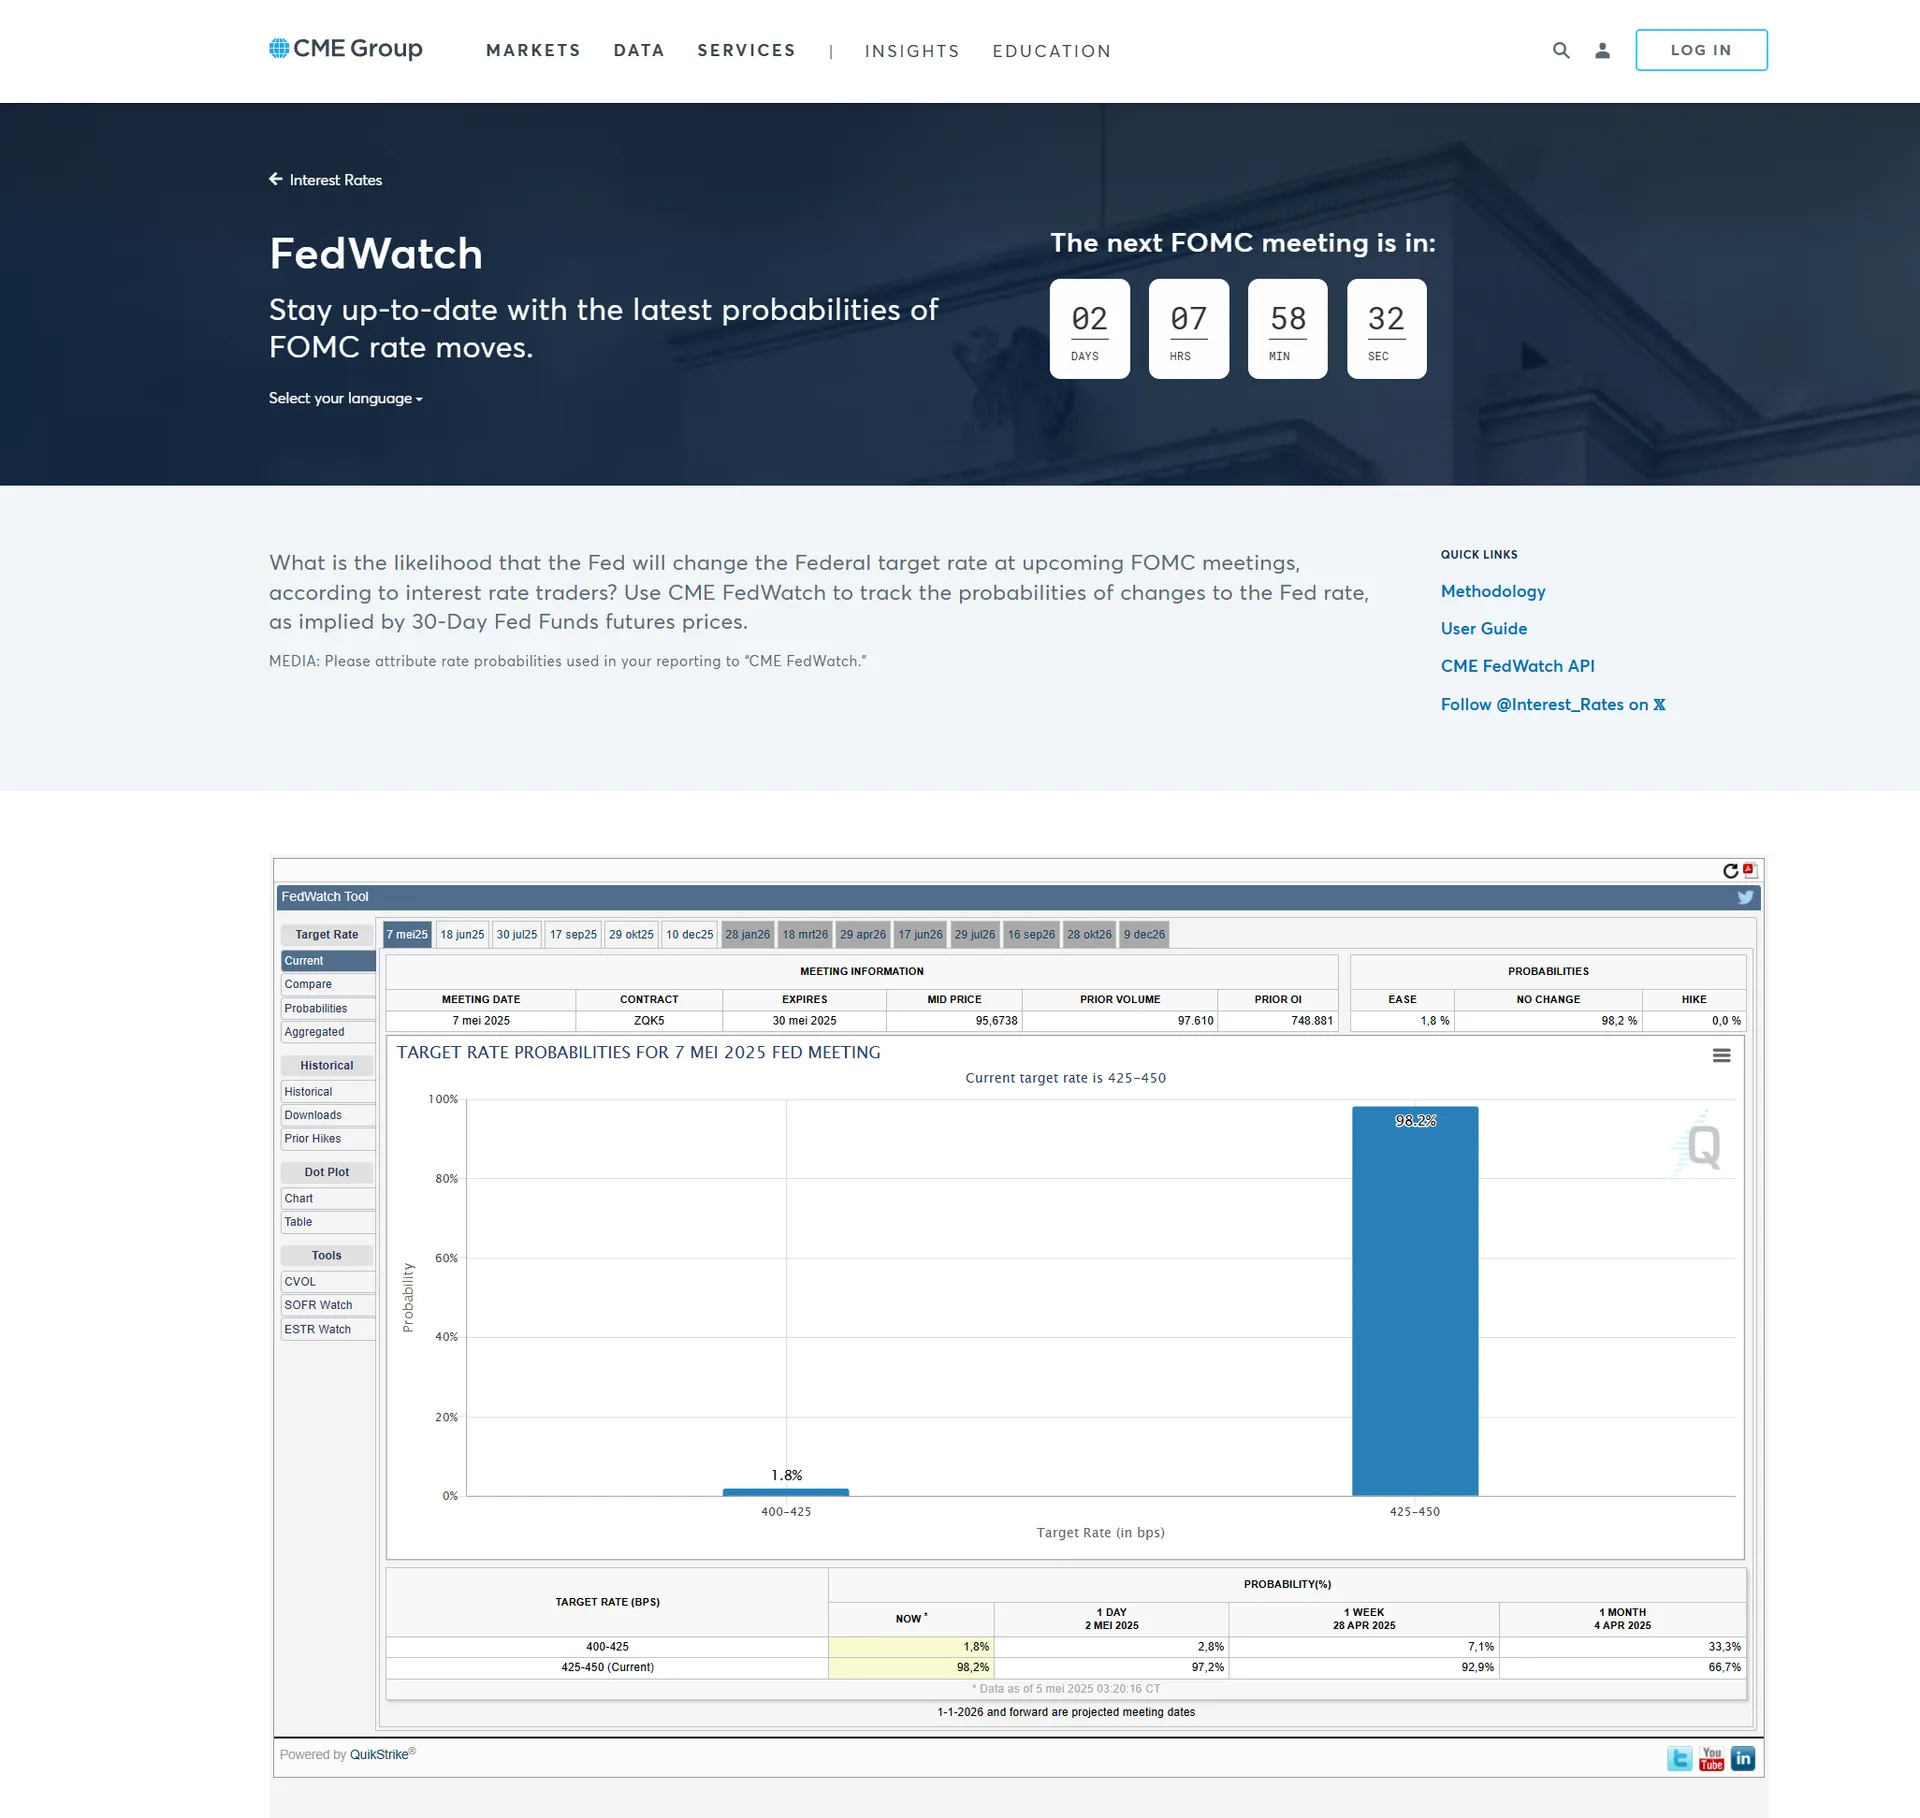
CME FedWatch Tool
Track Federal Reserve rate probability

October EOM Livestream
Full October analysis walkthrough on YouTube
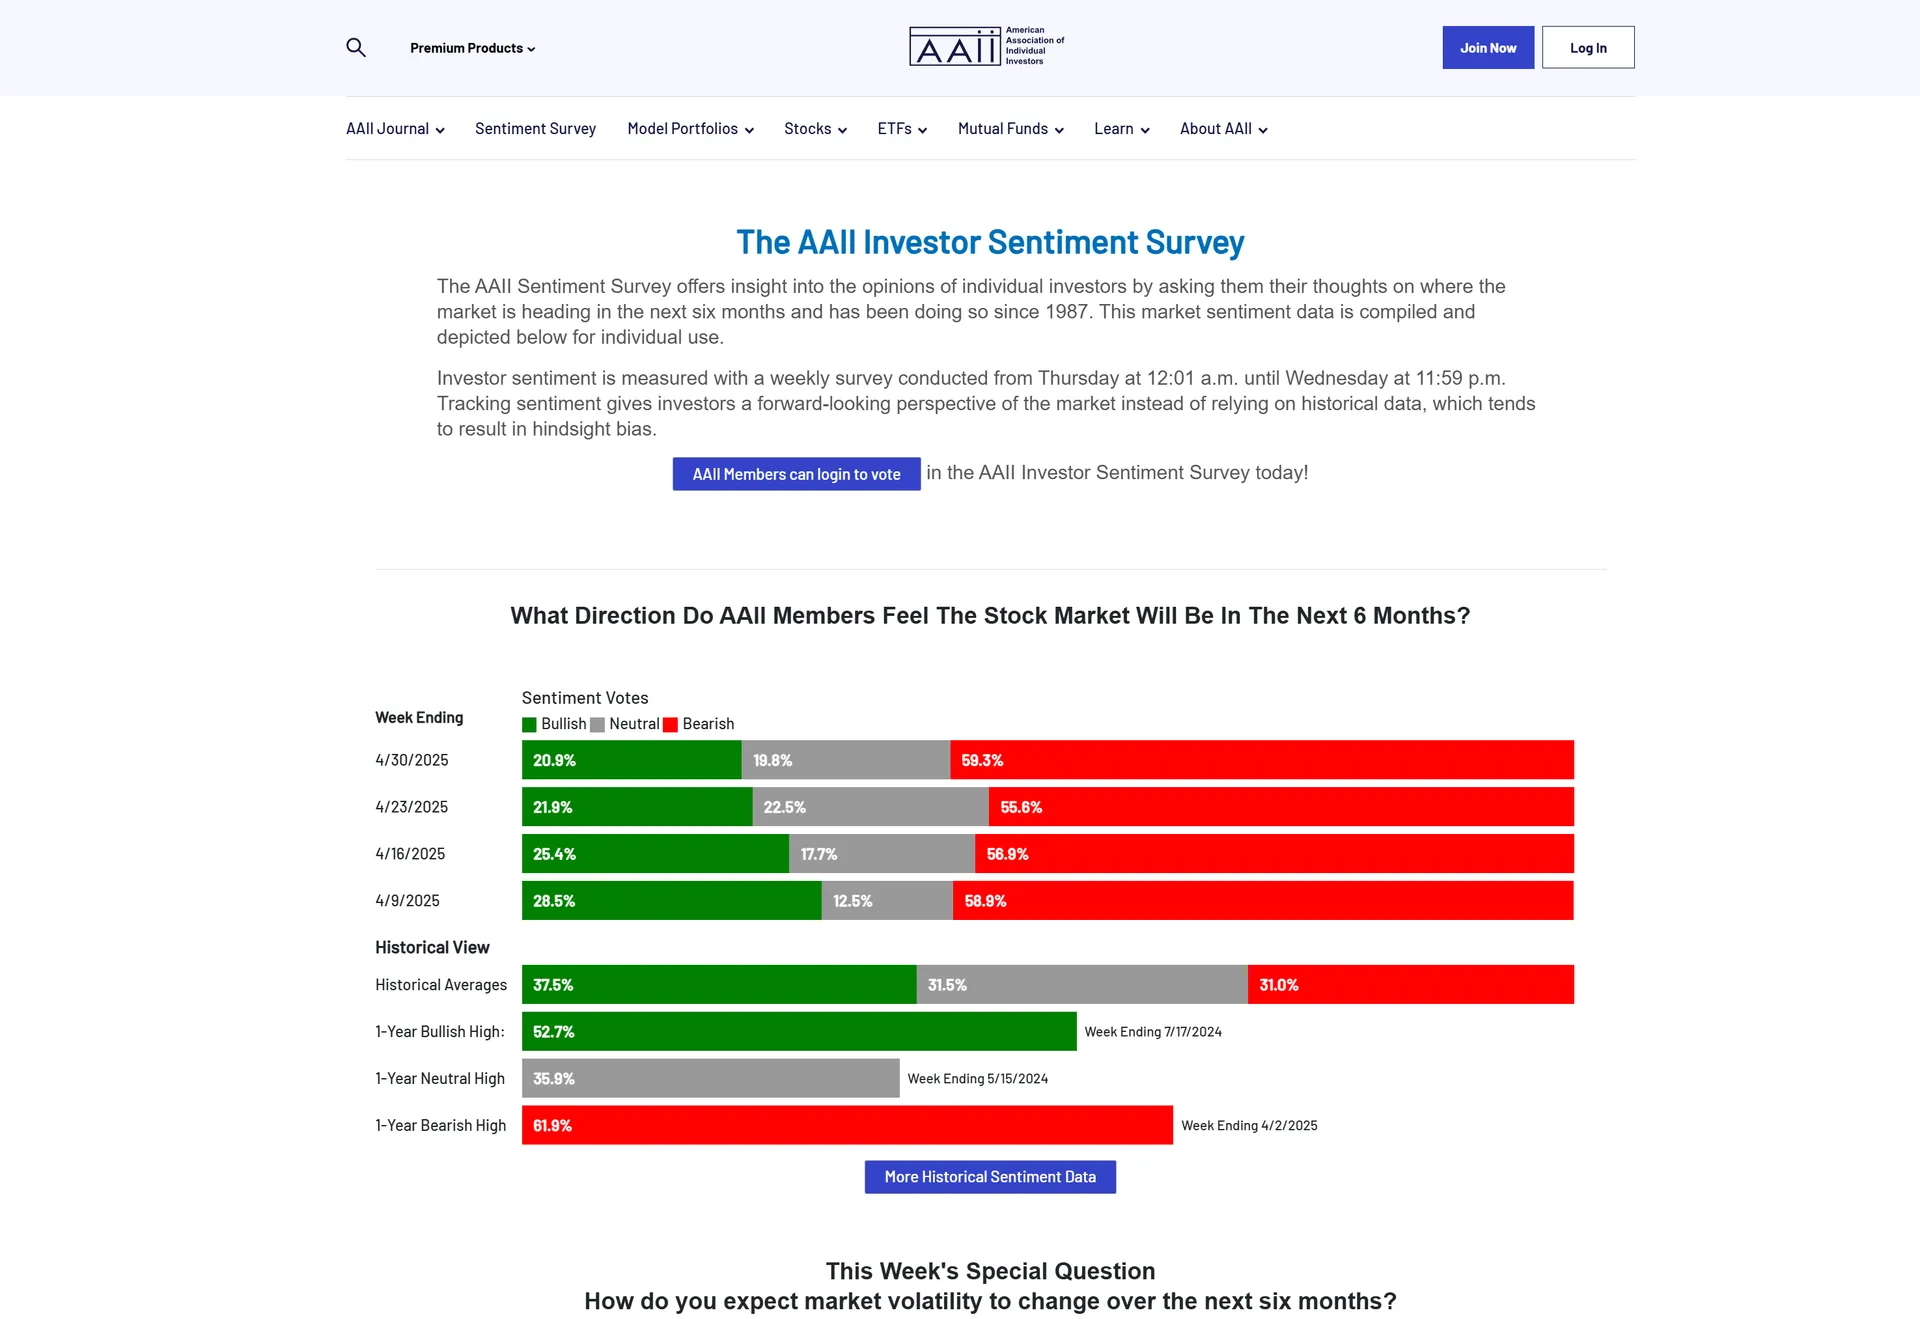
AAII Investor Sentiment Survey
Historical sentiment data & video breakdown
Follow Toodegrees
Section 5
Conclusion — Analysis Recap
October brought consolidation and caution as markets awaited the U.S. Presidential Election. NQ, ES, and YM all traded within tight ranges, with limited conviction in either direction. DXY extended its strength, benefiting from safe-haven demand and relative U.S. economic resilience. With the election just days away, November will bring clarity — and likely sharp directional moves as hedges unwind and positioning resets.
COT data shows commercials holding DXY longs while reducing equity exposure — a defensive institutional stance. OI declines across equity futures suggest participants waiting on the sidelines. Overall, October marked a pause before the storm — post-election outcomes will dictate whether Q4 brings risk-on rallies or further defensive repositioning into year-end.
Toodegrees Library