Q3 2025 EOM Report — Inter Market Dynamics

Written by
A Sign Of Time
Head of Education & Toodegrees Analyst

Section 1
Q3 2025 Recap — US Indices
Welcome to the Q3 2025 End-of-Quarter Market Recap, covering July through September across U.S. equity futures, FX pairs, and Treasury bonds. Q3 saw a dramatic shift from early-quarter optimism to late-quarter volatility, with August's sharp selloff testing investor conviction and September bringing renewed uncertainty heading into Q4.
Recent Events — Fed Rate Cut Cycle Begins
September marked a pivotal shift in monetary policy as the Federal Reserve initiated its first rate cut cycle since 2020, delivering a 50 basis point cut at the September FOMC meeting. The larger-than-expected move signaled the Fed's willingness to act preemptively to support growth, but also raised questions about whether policymakers saw risks that markets had not yet priced in. Equity markets initially rallied on the news, but volatility remained elevated as investors debated whether the cut represented a "soft landing" scenario or a preemptive response to deteriorating conditions.
Key Elements
Dovish Pivot: The 50bp cut exceeded consensus expectations (25bp), signaling the Fed's concern over slowing growth and labor market softness.
Market Reaction: Initial rally was short-lived, as investors questioned whether the Fed was "behind the curve" or simply acting with caution.
Q4 Uncertainty: With the easing cycle underway, attention now shifts to the pace and magnitude of future cuts — a key driver for Q4 positioning.
Q3 Results — US Index Futures
Over Q3, U.S. equity futures showed mixed performance. The Nasdaq-100 ($NQ) gained +1.2% for the quarter, supported by AI momentum in July before pullback in August and recovery in September. The S&P 500 ($ES) declined -0.4%, reflecting broader sector weakness mid-quarter. The Dow Jones ($YM) fell -2.1%, with value and industrial names lagging throughout the period.
$NQ = E-Mini Nasdaq 100 Futures · $ES = E-Mini S&P 500 Futures · $YM = E-Mini Dow Jones Futures
Sentiment Analysis
AAII Investor Sentiment (Q3 Average): Bullish sentiment averaged 35.2% — below the long-term average of 37.5%. Bearish averaged 36.8%, reflecting the August spike. Fear & Greed Index (Q3 Exit): 52 — Neutral. The quarter showed a clear shift from early optimism to mid-quarter fear and late-quarter cautious stabilization. Positioning remains defensive heading into Q4, with elevated cash levels and hedging activity suggesting investors are bracing for continued volatility.
Section 2
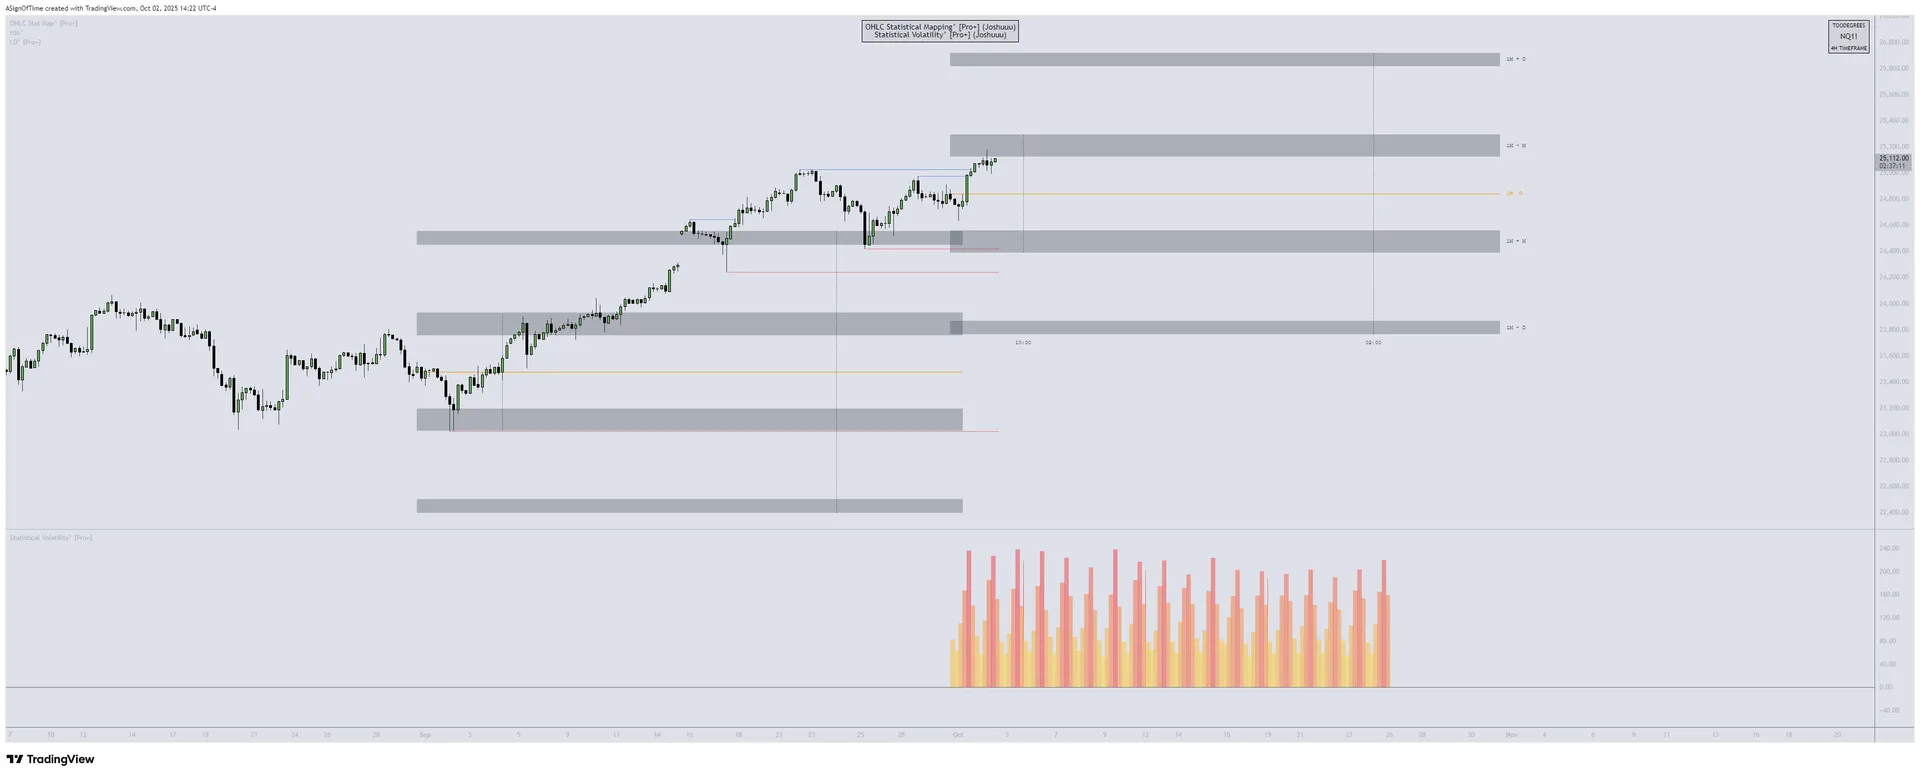
Technical Analysis — Nasdaq 100
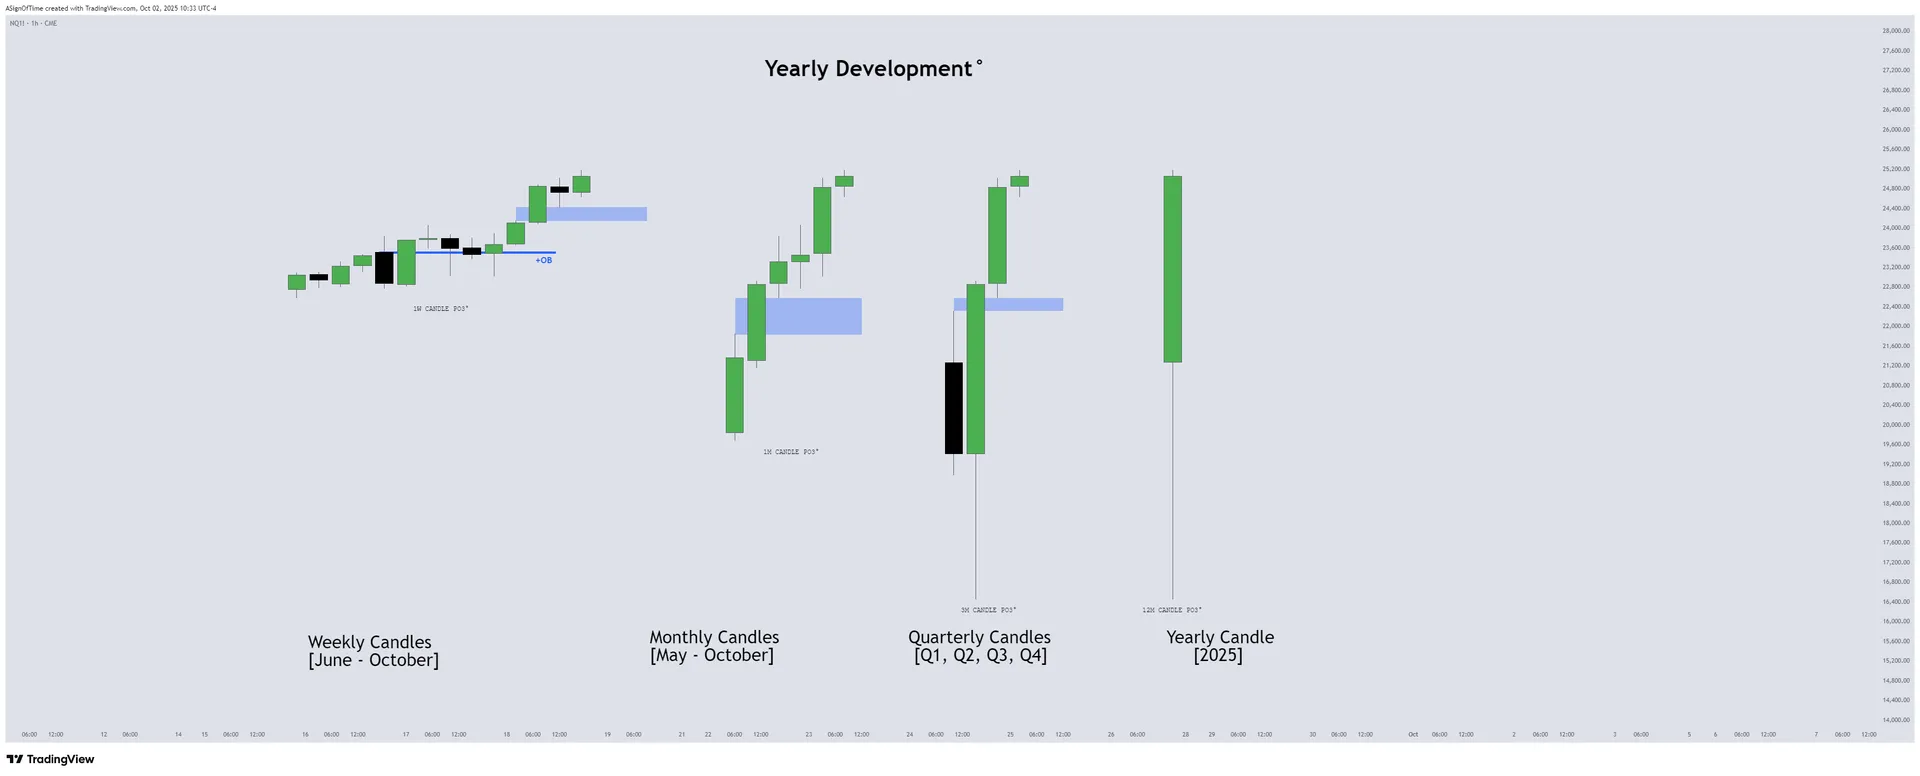
NQ Quarterly Recap — HTF Power of Three Dashboard
Q3 presented a classic example of accumulation, manipulation, and distribution at the quarterly timeframe. July's advance pushed NQ to fresh all-time highs (accumulation), August's sharp selloff swept liquidity and shook out weak hands (manipulation), and September's recovery attempt tested whether distribution would follow or if buyers could reclaim control. By quarter-end, NQ remained range-bound between Q3 highs and lows — setting up a critical inflection point for Q4.
Multi-Asset IPDA — Q3 Anchored
IPDA Lookback anchored at the start of Q3 (July 1st), measuring Relative Strength across NQ, ES, and YM relative to the 60-day lookback period.
[E-MINI NASDAQ 100]
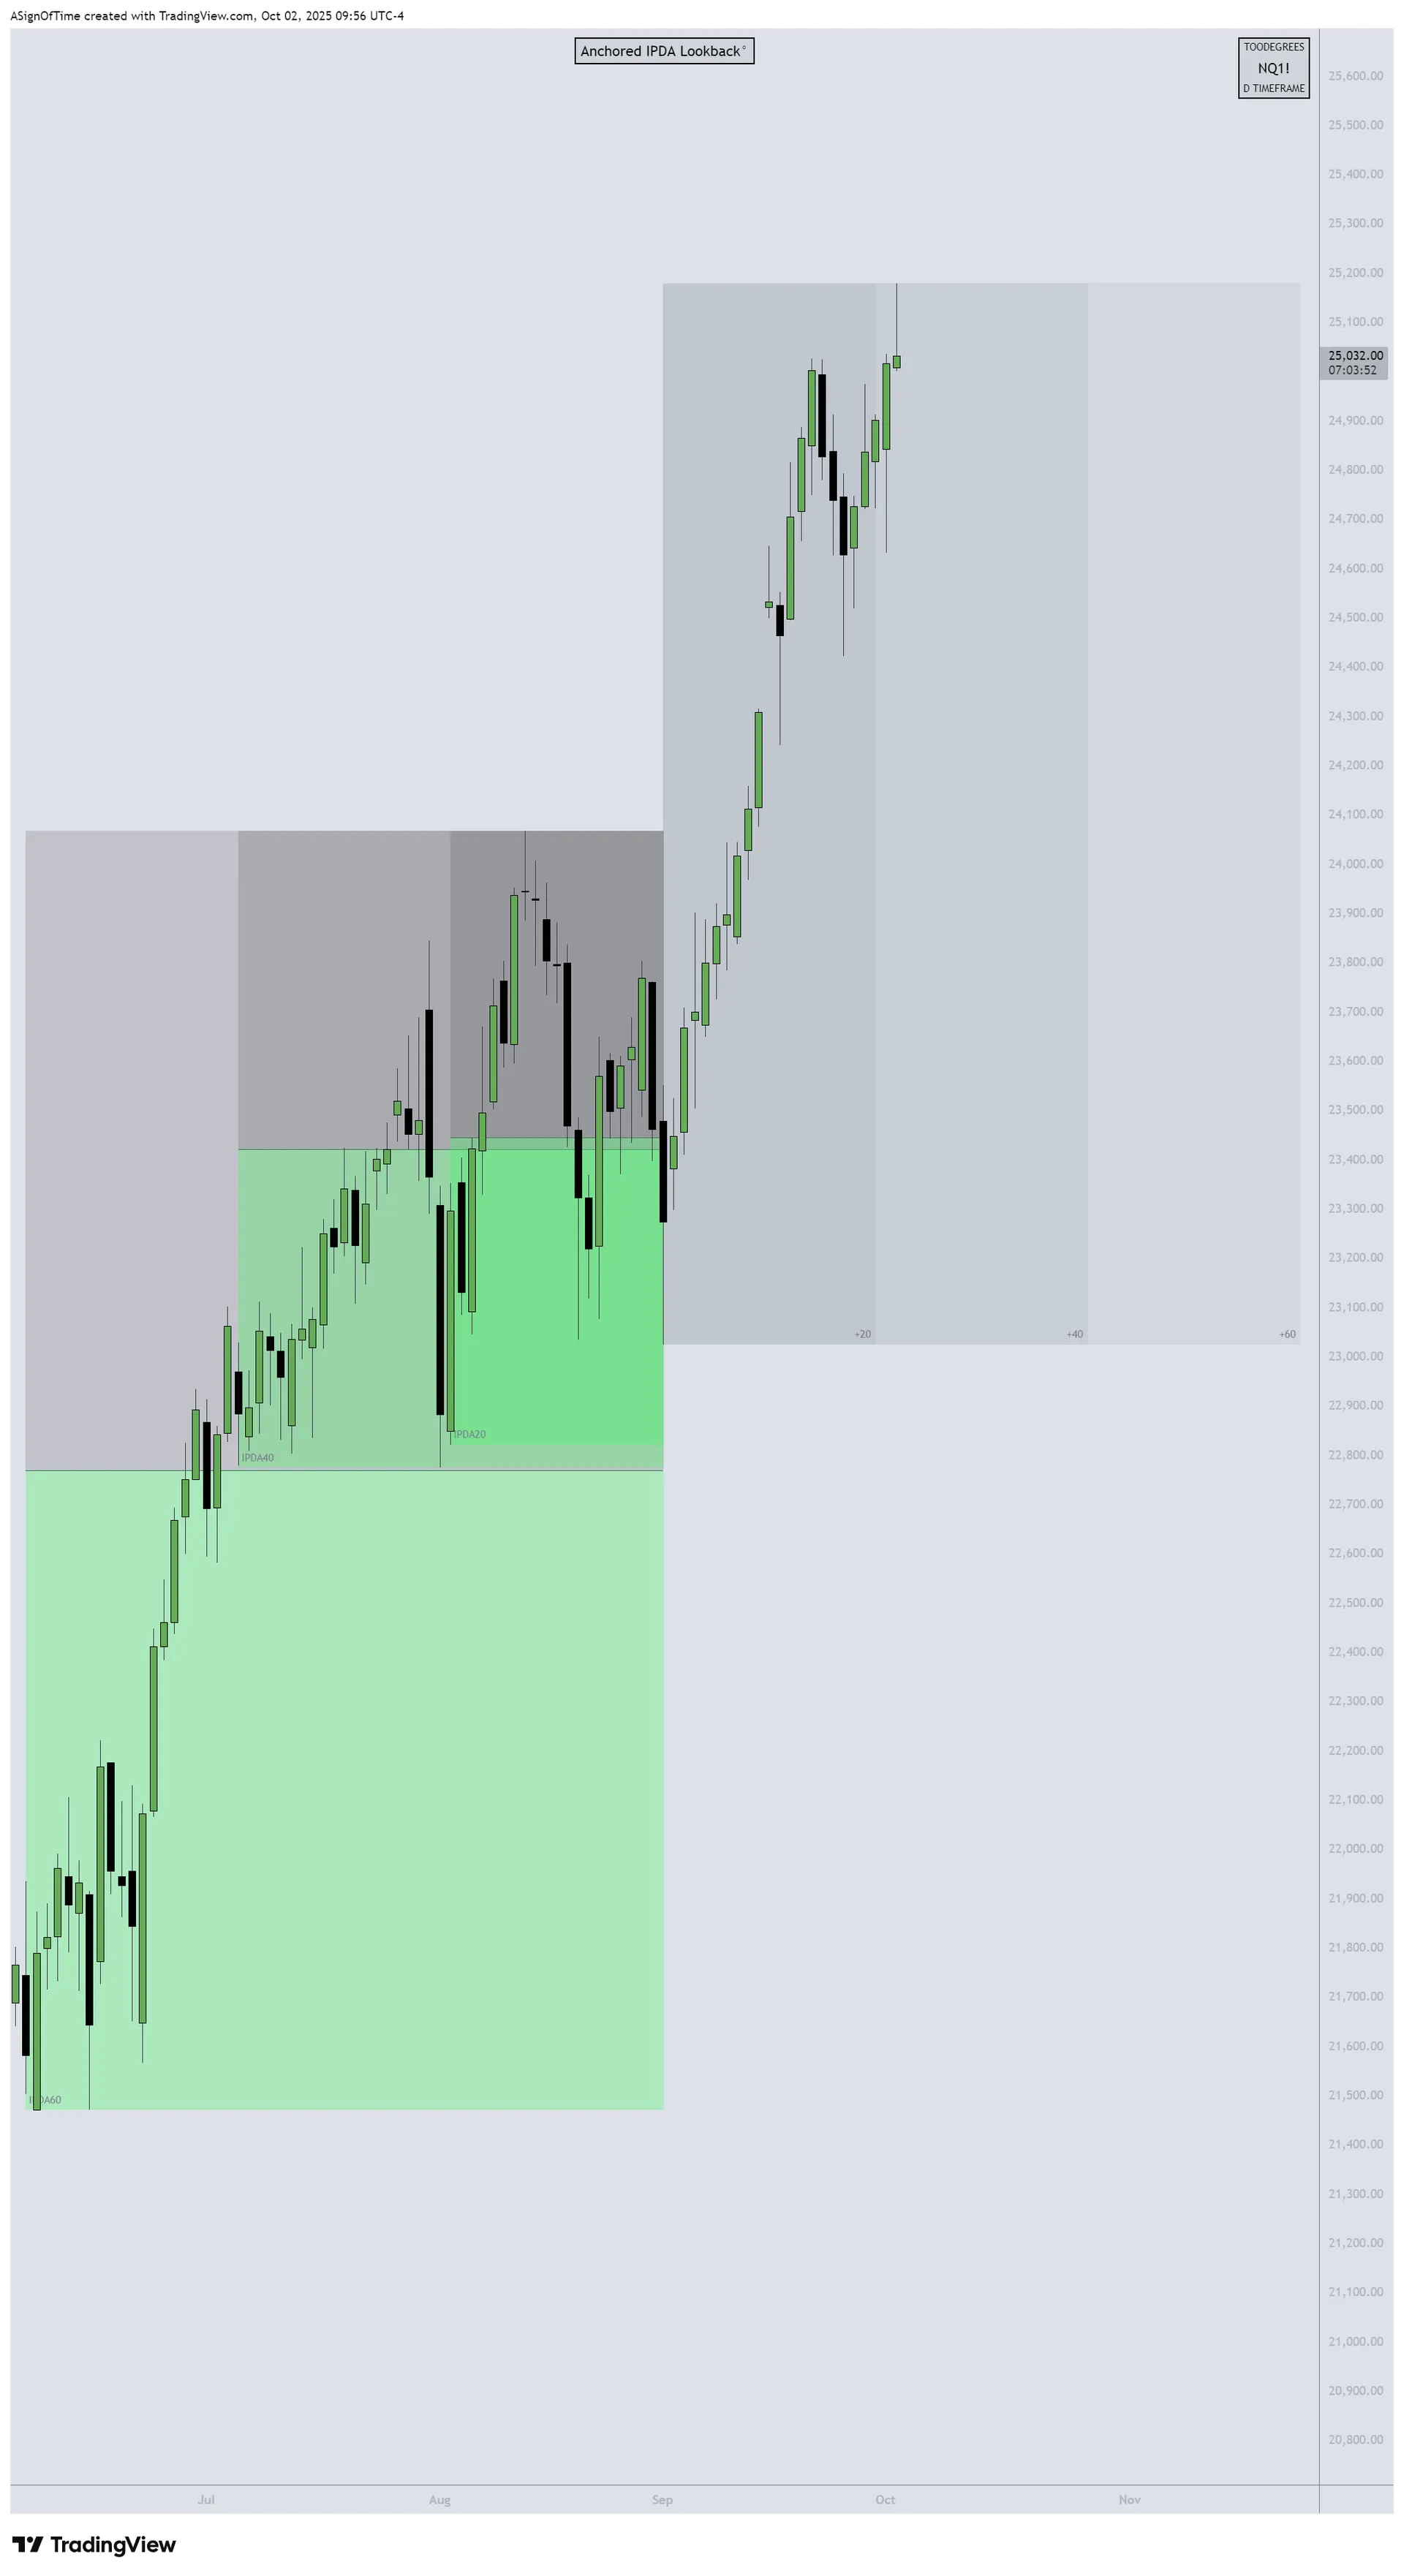
Relative Outperformance
[E-MINI S&P 500]
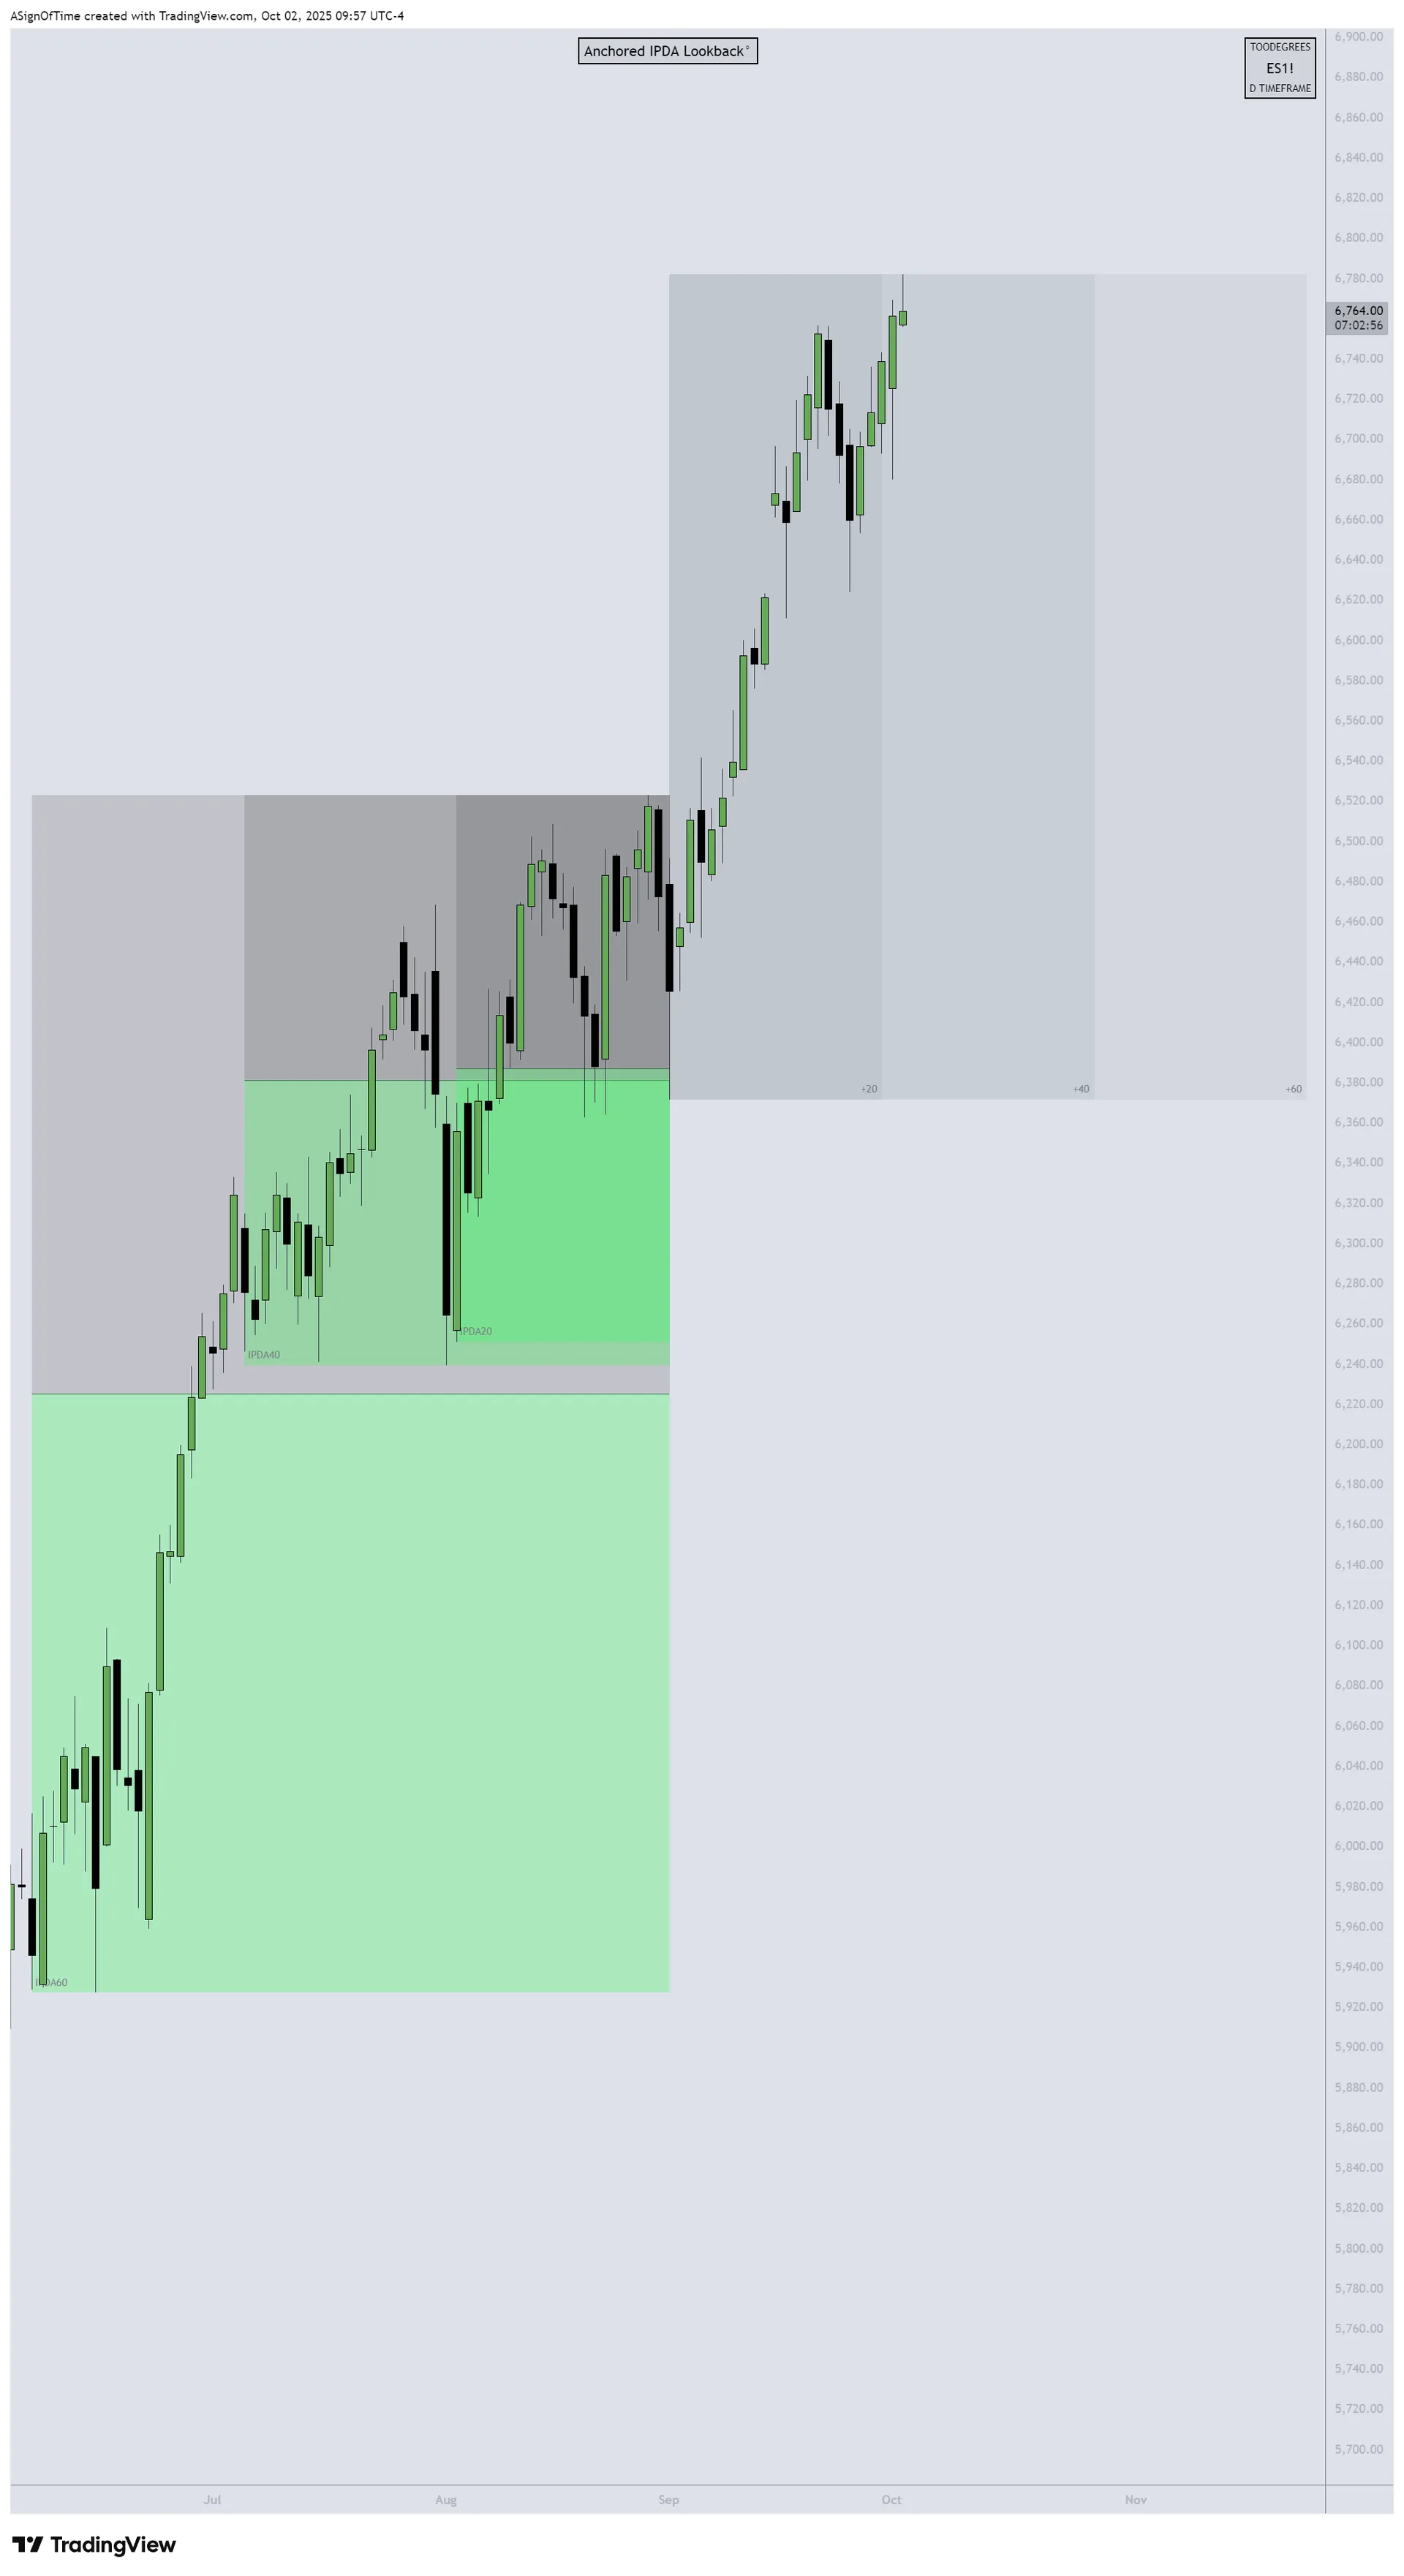
Mixed Performance
[E-MINI DOW JONES]
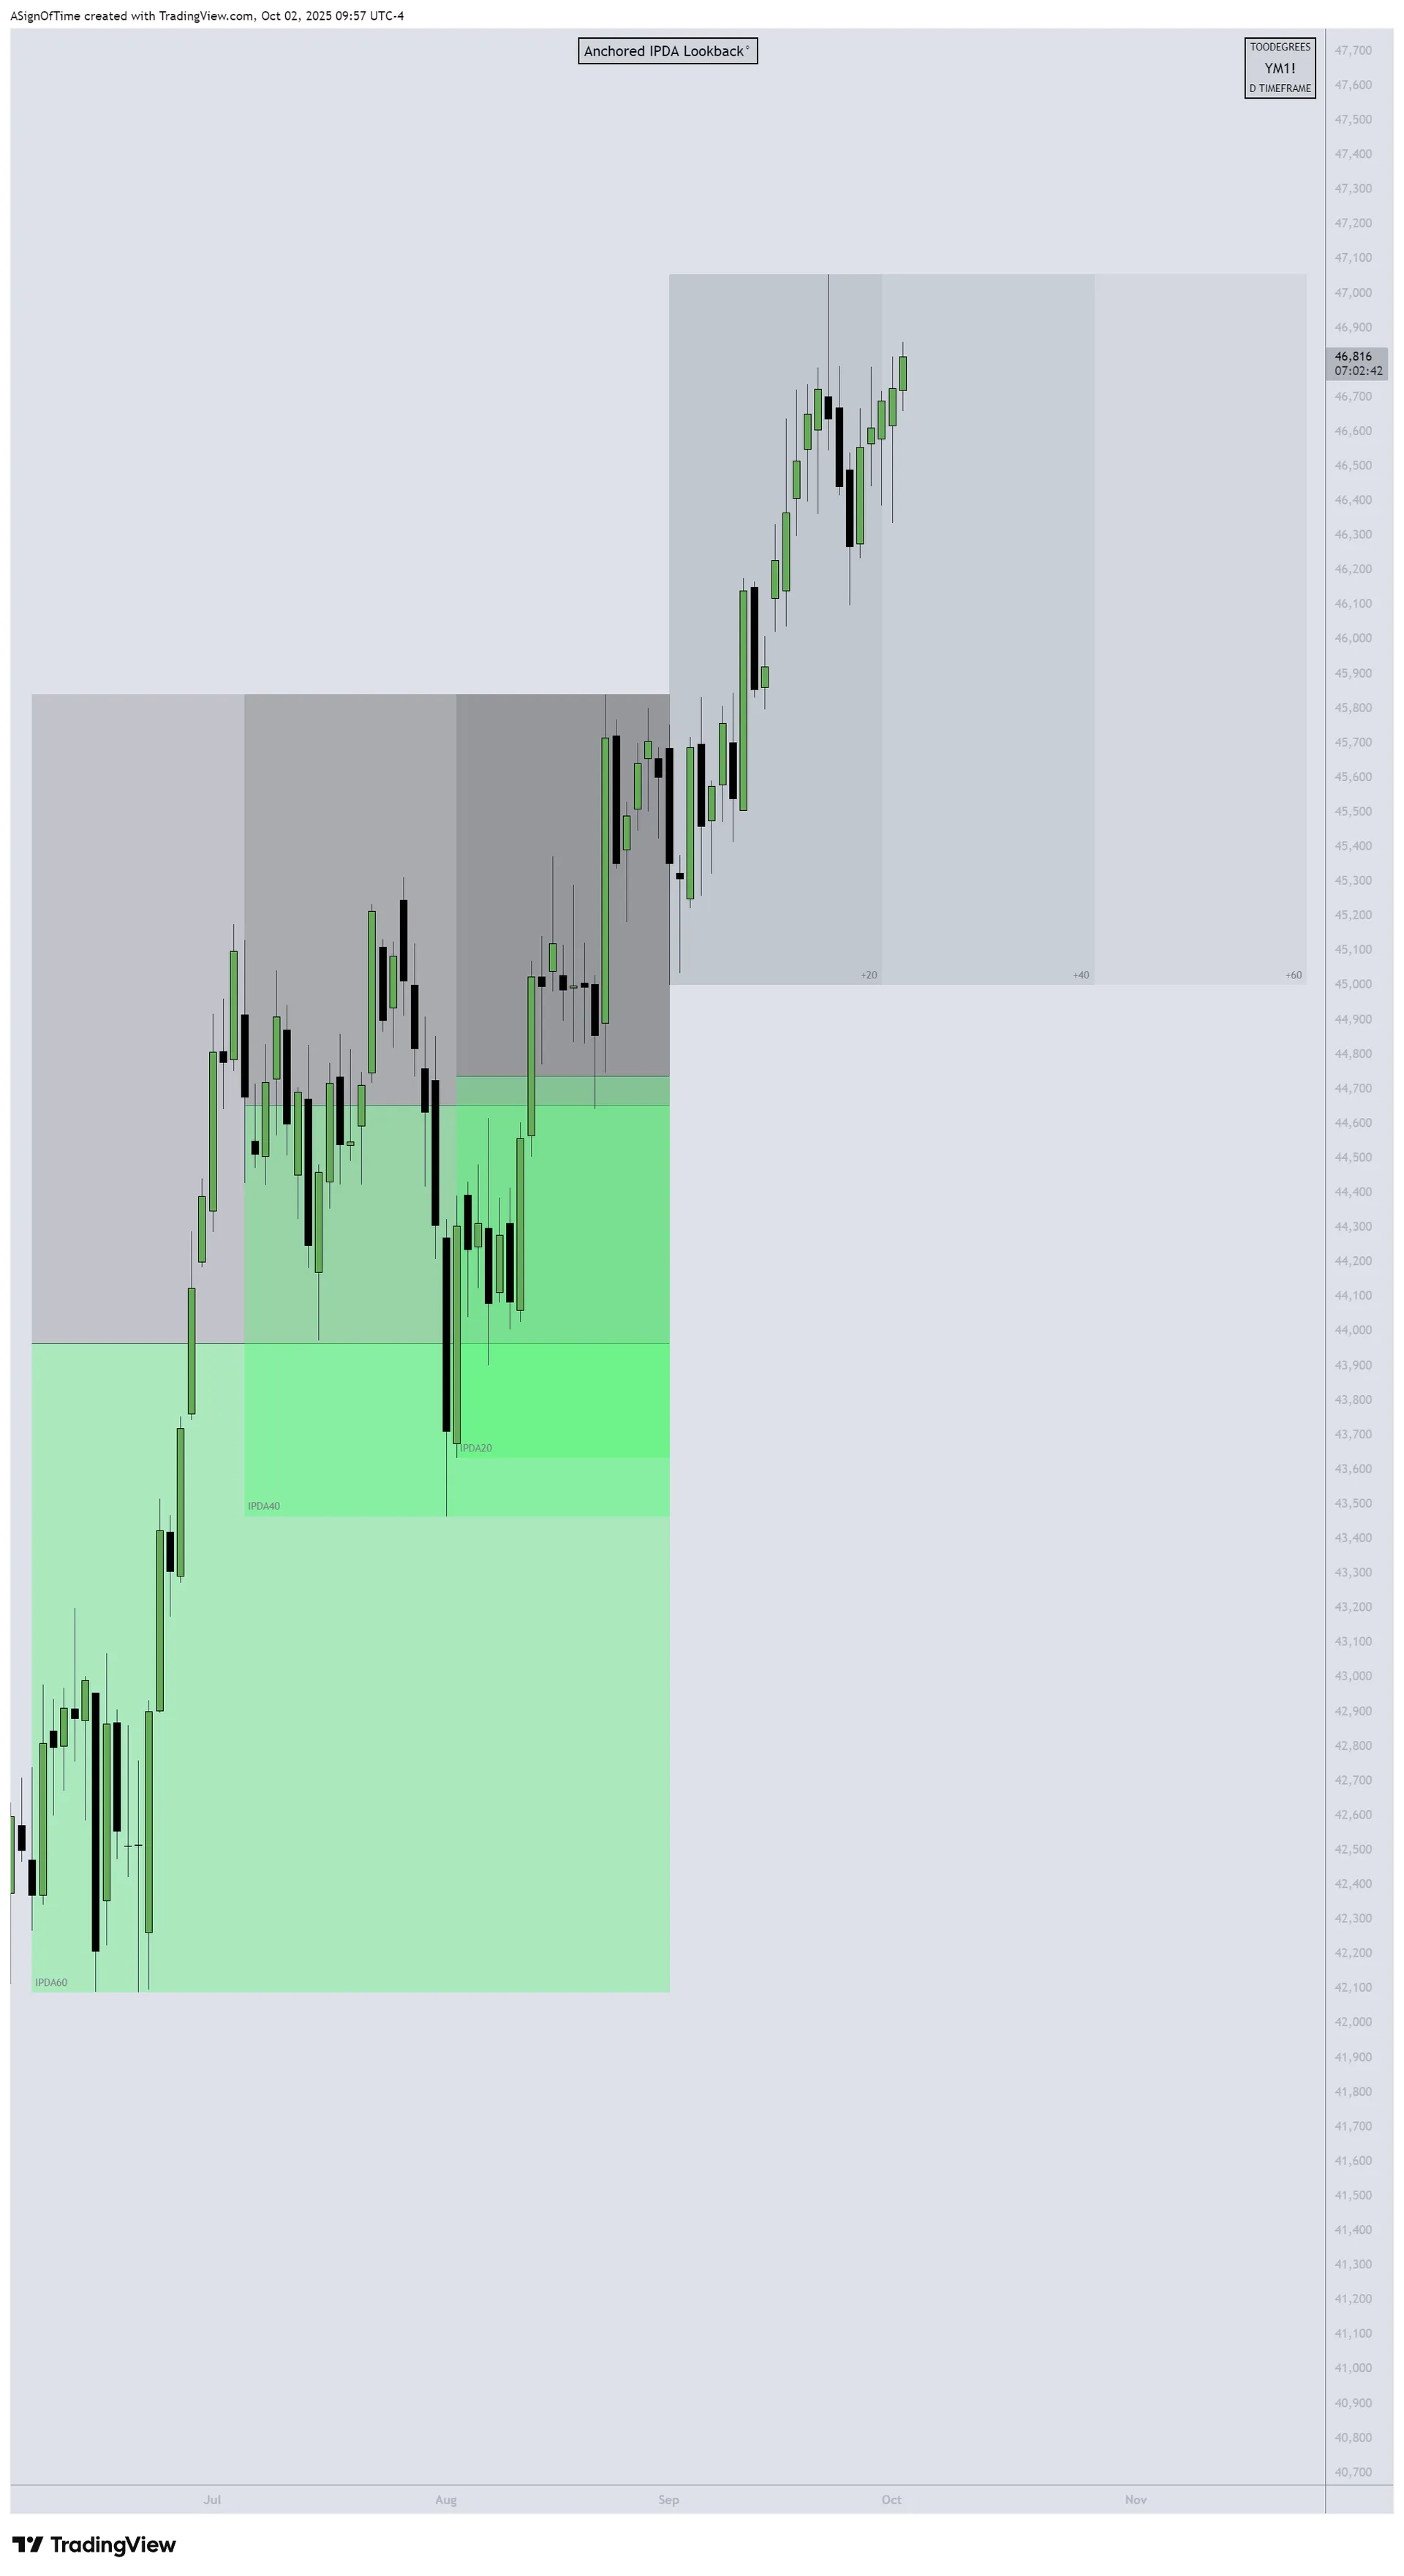
Clear Underperformance
Analyst Insight
NQ showed the strongest relative performance over Q3, reclaiming much of the August decline and maintaining leadership in the tech-driven rally. ES struggled to hold gains, oscillating between July highs and August lows. YM was the clear laggard, with value and industrial sectors failing to participate in the recovery attempts. This divergence highlights the narrowing breadth of the market — a theme that could define Q4 positioning.
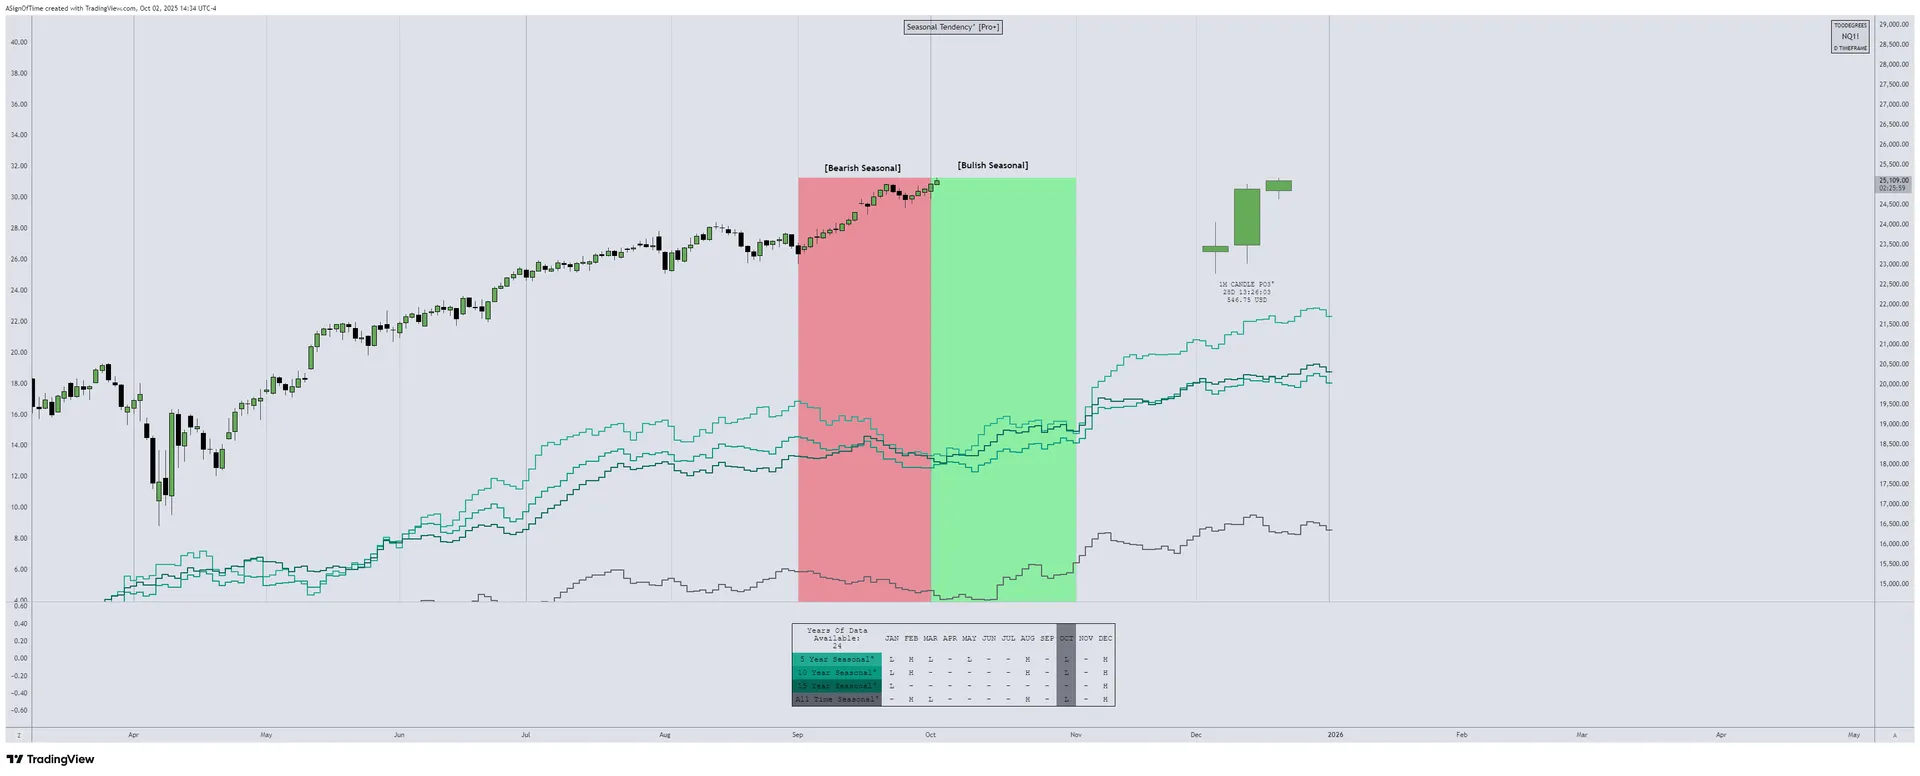
NQ Seasonality Analysis
Seasonal tendencies for the Nasdaq 100 E-Mini Futures across Q3. The quarter encompassed both summer complacency (July) and autumn volatility (August-September), providing a complete view of the seasonal transition.
NQ Commitment of Traders
Over Q3, commercials transitioned from net long reduction (July) to neutral positioning (August) and mixed signals (September). The shift reflects the quarter's volatility and uncertainty — institutions maintained flexibility rather than taking directional bets.
NQ Open Interest
Open Interest (OI) showed mixed behavior over Q3, declining in July, stabilizing in August, and showing mixed patterns in September. The lack of sustained OI growth suggests limited conviction in either direction — a hallmark of range-bound, uncertain markets.
Section 3
Inter-Market Dynamics — Currency & Bond Markets
Q3 Results — Currency Markets
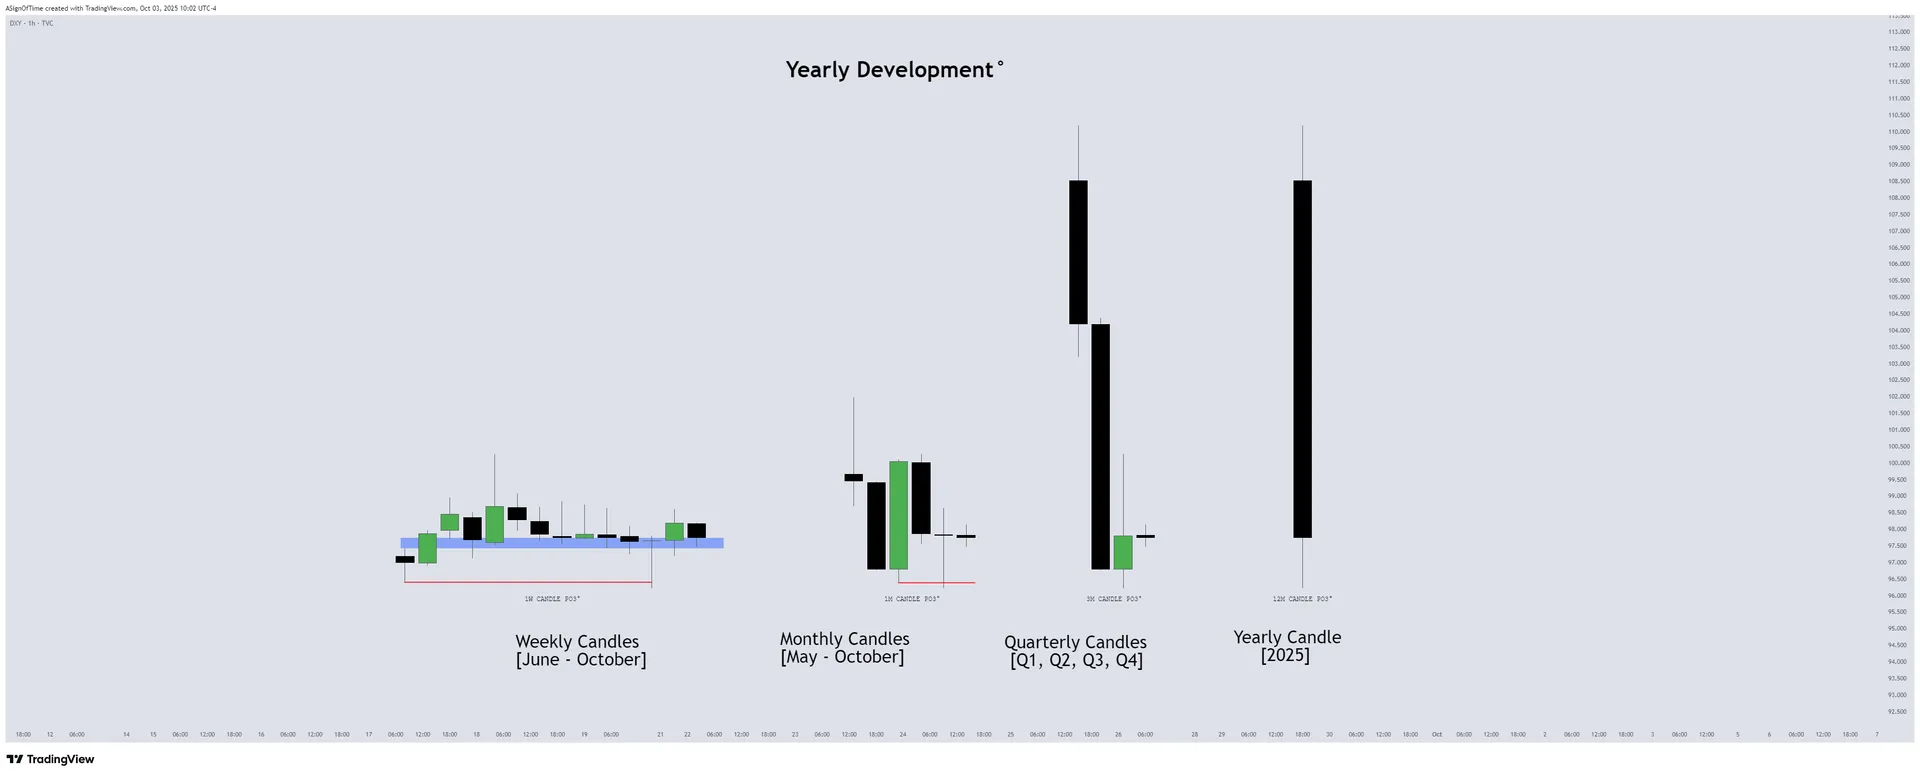
Over Q3, the U.S. Dollar Index (DXY) climbed approximately +4.9%, reversing the H1 2025 decline and regaining ground as global growth concerns and safe-haven demand supported the greenback. EUR/USD fell roughly –4.5%, pressured by ECB dovishness and weaker Euro-area data. GBP/USD dropped –5.2%, with UK fiscal and growth challenges weighing on sterling.
DXY Quarterly Recap
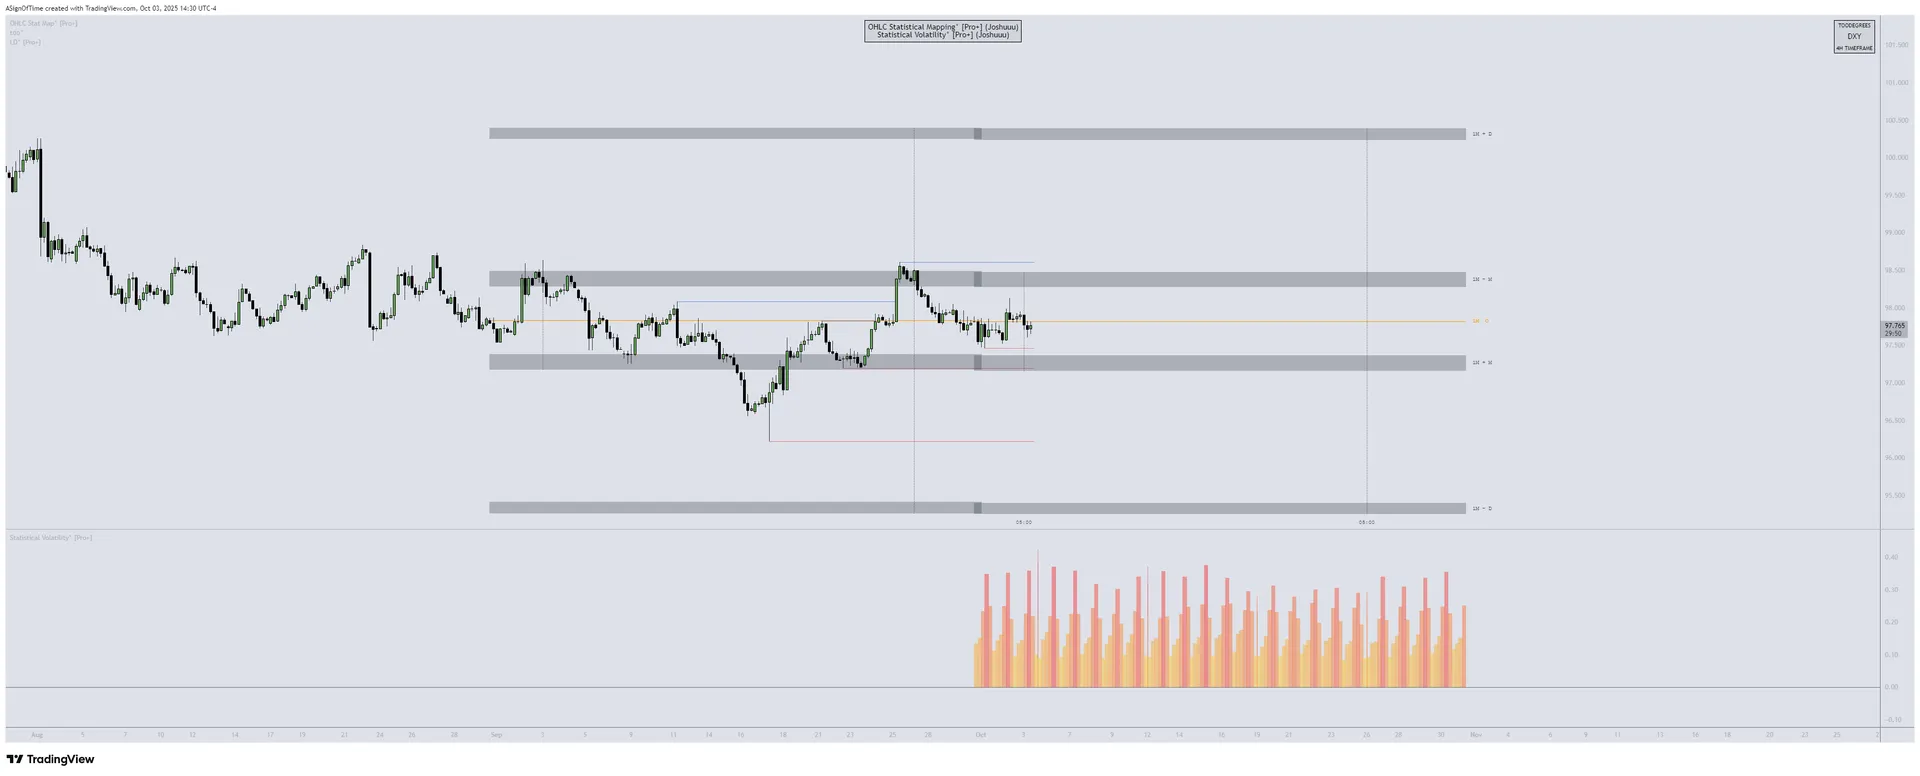
DXY — IPDA Analysis
DXY reversed its H1 2025 decline decisively over Q3, building strength month-by-month. The move was initially driven by short-covering (July), reinforced by safe-haven flows (August), and validated by commercial long-building (September). COT data shows strong institutional positioning for continued dollar strength.
Inter-Market Dynamics Summary
| Metric | NQ | DXY | T-Bonds |
|---|---|---|---|
| Orderflow | Bullish → Neutral | Bearish → Bullish | Sideways → Bullish |
| Seasonality | Bullish → Neutral | Sideways → Bullish | Sideways → Bullish |
| Open Interest | Declining → Mixed | Declining → Building | Mixed → Strong Build |
| COT Report | Reducing → Mixed | Bearish → Strong Long | Mixed → Strong Long |
| Interest Rate | — | 4.25%–4.5% → 4.75%–5.0% | — |
Format: Q2 Exit → Q3 Exit
Section 4
Additional Resources
Free TradingView Tools
Interest Rate & GDP Dashboard
by toodegrees — Free on TradingView
ICT Anchored IPDA Ranges
by toodegrees — Free on TradingView
ICT Commitment of Traders
by toodegrees — Free on TradingView
Seasonal Open Interest
by toodegrees — Free on TradingView
Community Resources
Toodegrees Library
Access all EOM Reports & premium content
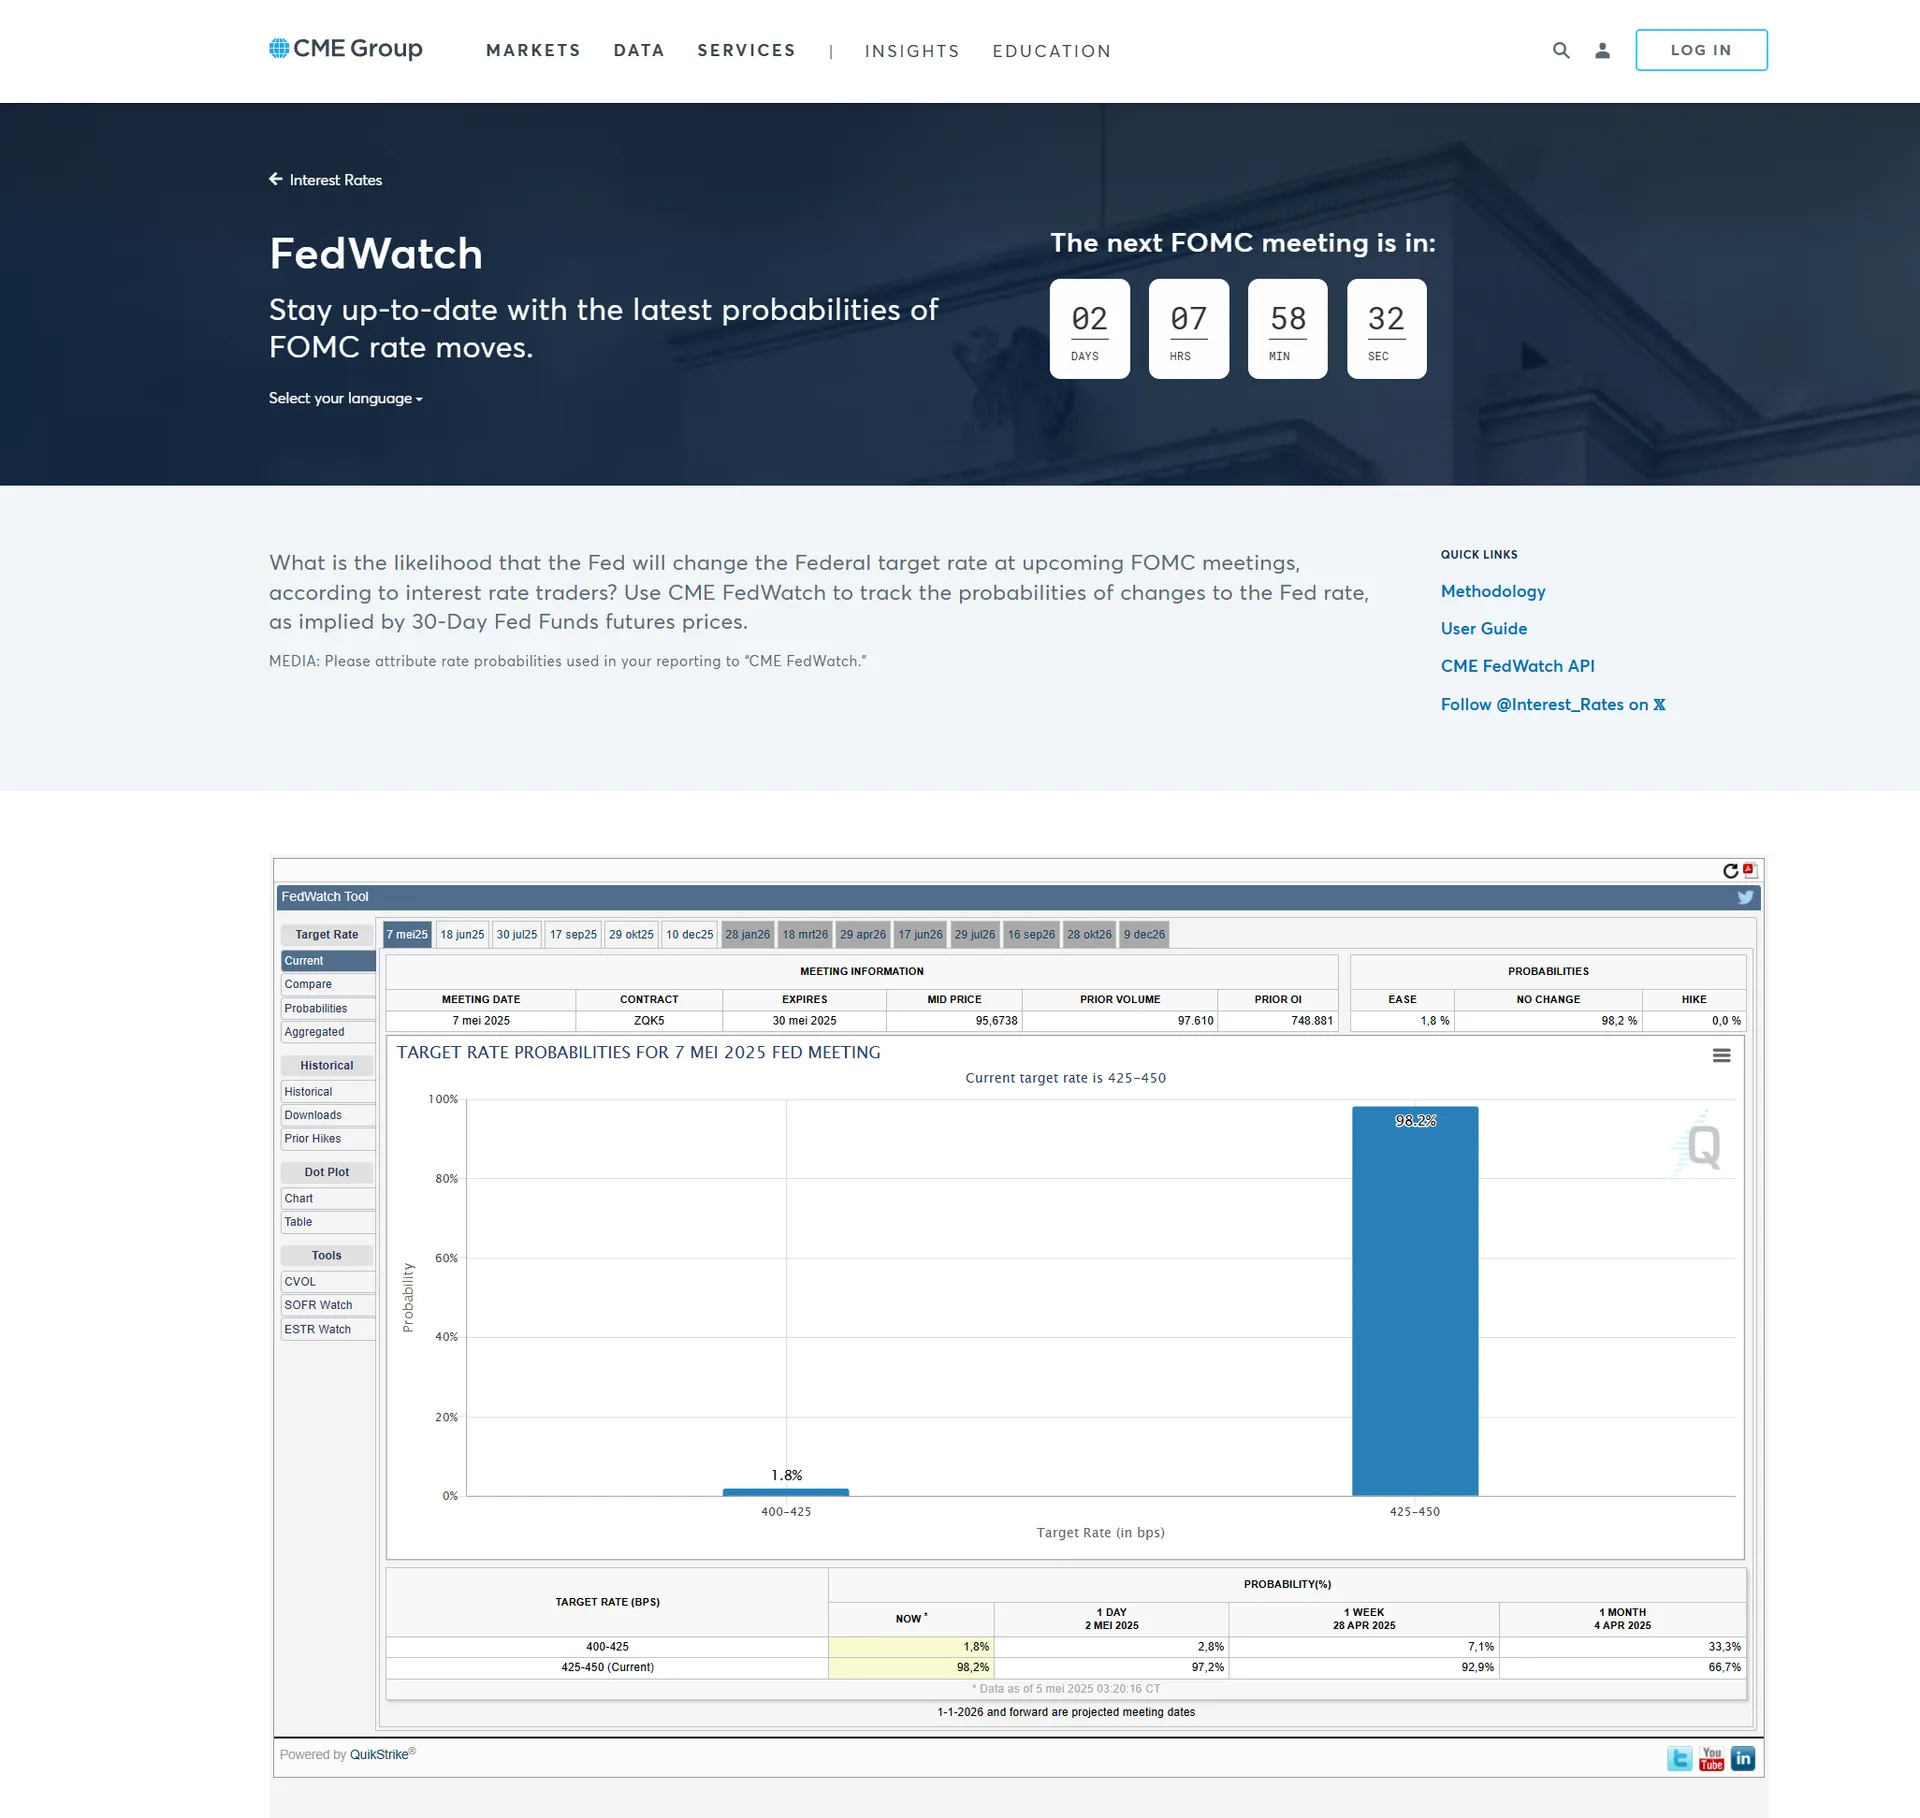
CME FedWatch Tool
Track Federal Reserve rate probability

Q3 EOM Livestream
Full Q3 analysis walkthrough on YouTube
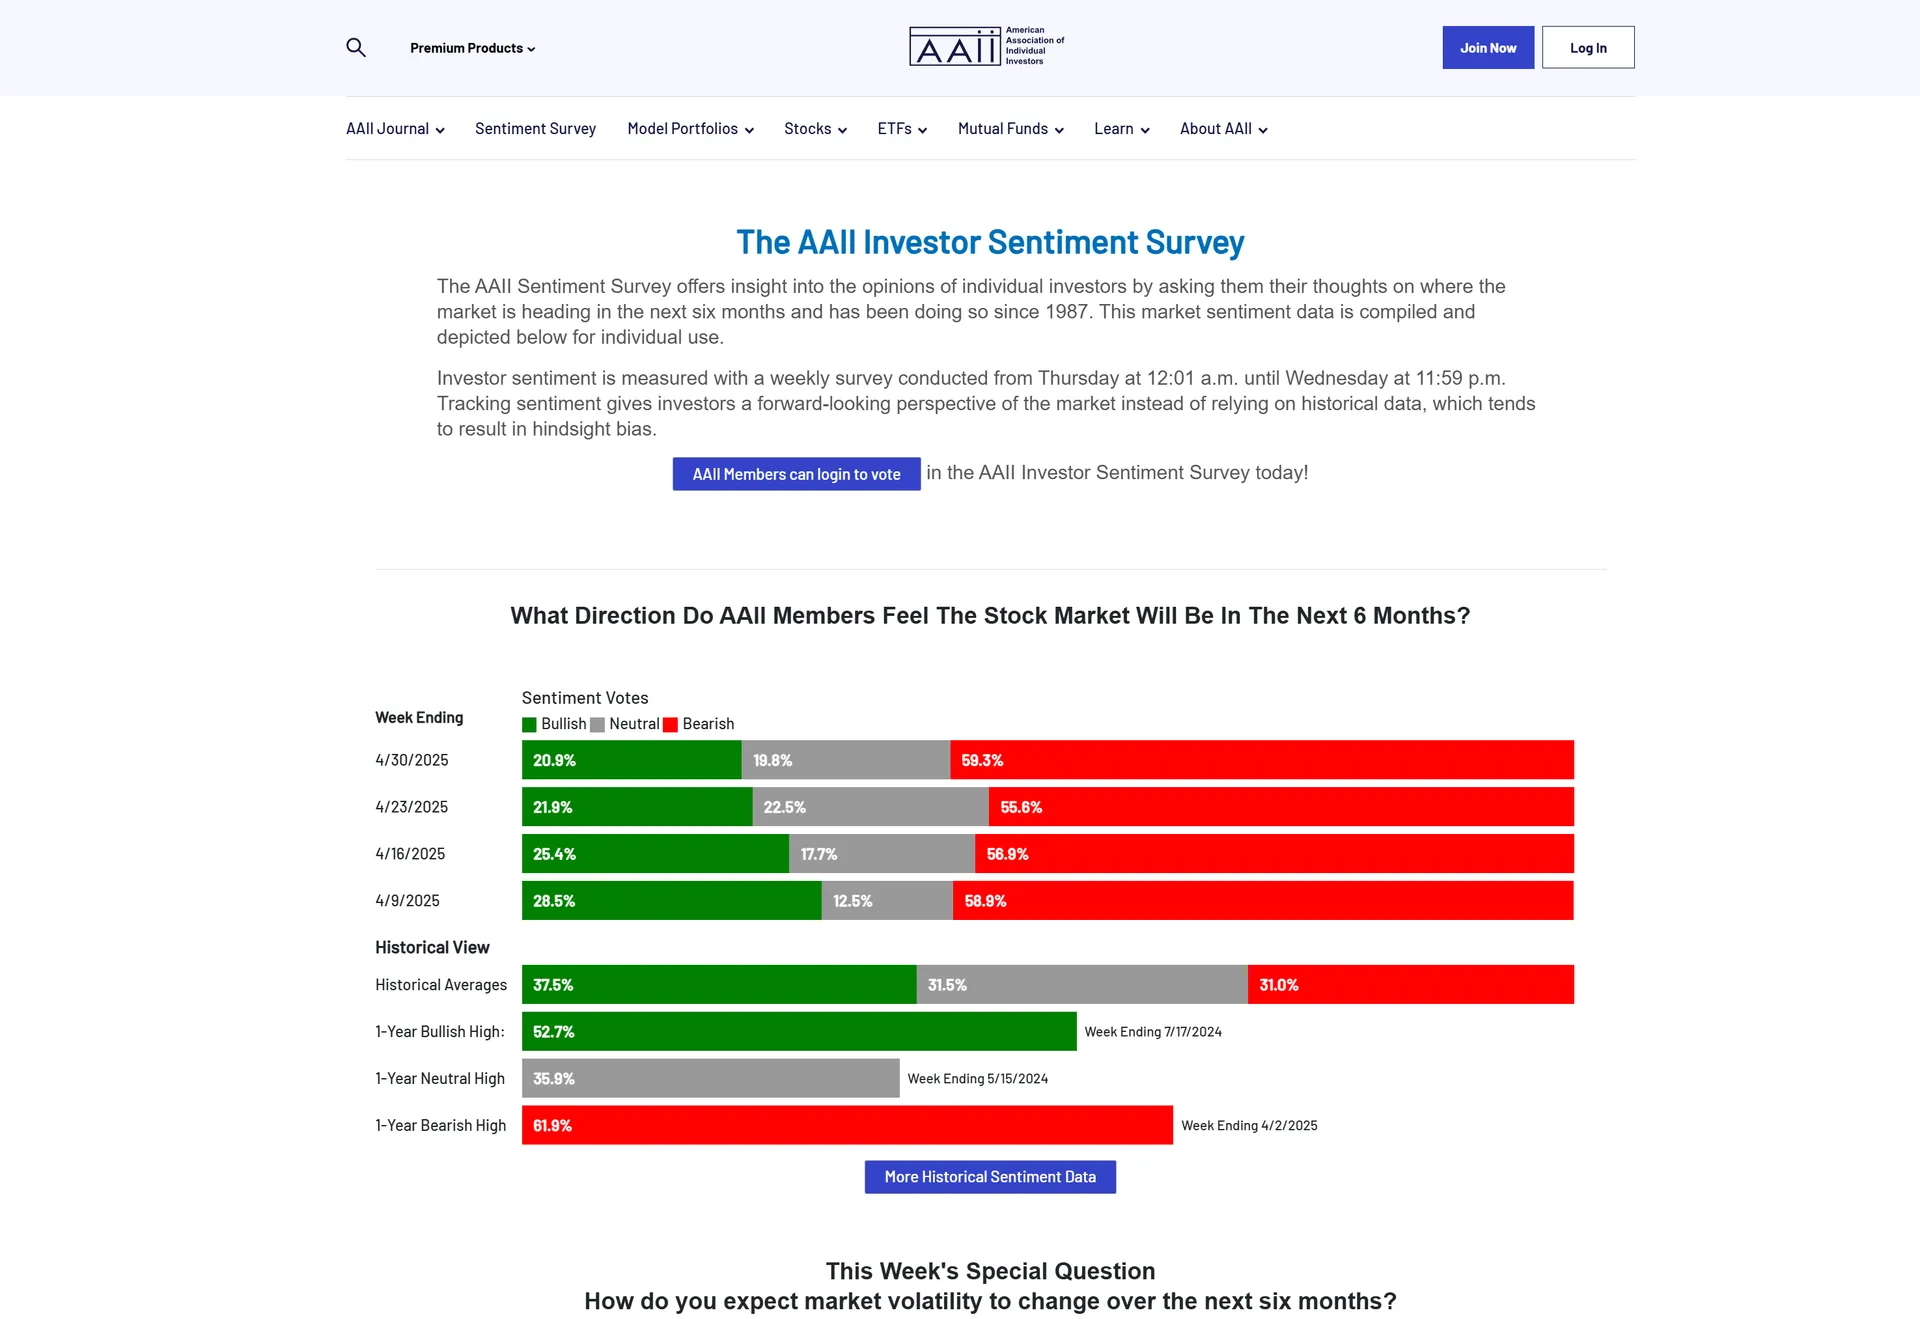
AAII Investor Sentiment Survey
Historical sentiment data & video breakdown
Follow Toodegrees
Section 5
Conclusion — Quarterly Recap
Q3 2025 will be remembered as a quarter of two halves: optimism in July followed by volatility in August and cautious stabilization in September. The Fed's 50bp rate cut marked a decisive shift in policy stance, but whether this represents a timely pivot or a reactive move to deteriorating conditions remains unclear. NQ maintained relative leadership, ES struggled to hold gains, and YM lagged — a narrowing breadth dynamic that could define Q4.
In FX, DXY reversed its H1 decline, with safe-haven flows and global growth concerns supporting the dollar. EUR/USD and GBP/USD weakened sharply on deteriorating economic data. Treasury futures rallied as growth concerns resurfaced and the Fed began easing. COT data shows commercials building long exposure in both DXY and bonds — suggesting institutional positioning for a more defensive macro environment. Overall, Q3 marked a transition from growth optimism to policy-driven uncertainty, setting the stage for a critical Q4.
Toodegrees Library