Reviewing EURUSD Through The Eyes Of Stat Map

Written by
A Sign Of Time
Head of Education & Toodegrees Analyst
This week's spotlight turns to EURUSD, where price action aligned neatly with both the daily and session Stat Map. When paired with reference points such as prior highs, lows, and ICT PD Arrays, these statistical zones provide a structured view of intraday retracements and broader directional moves.
Adding depth to the analysis, A Sign of Time examines the broader backdrop influencing the Euro's direction.
EURUSD 15-Minute Timeframe — Daily Stat Map
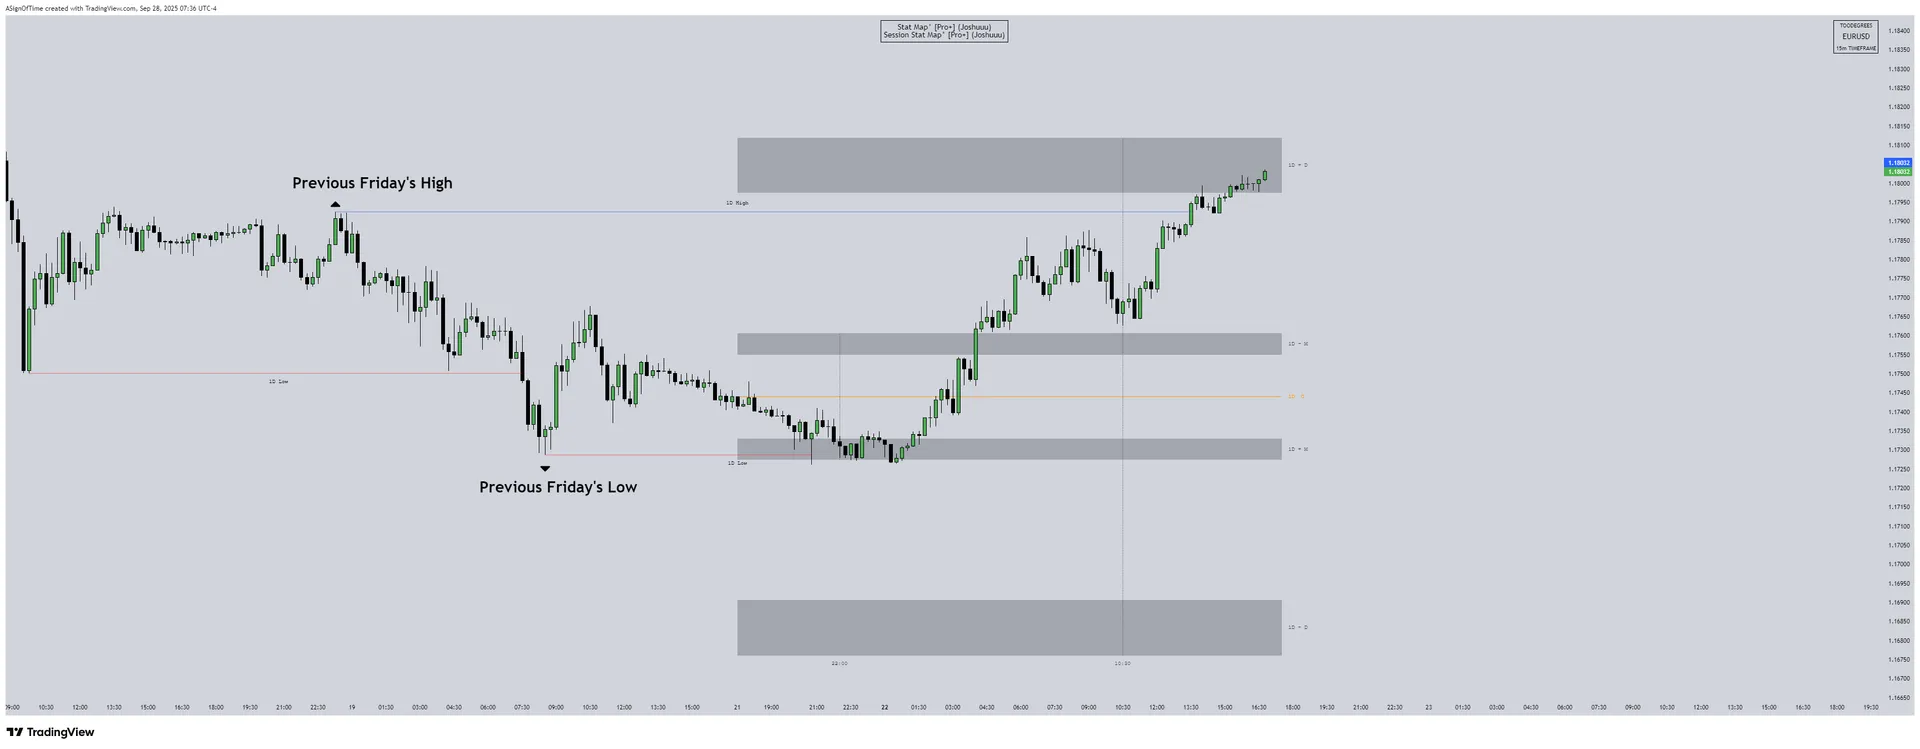
On Monday, September 22, EURUSD began the weekly range by immediately running for the previous Friday's low, tapping into the Daily Bullish Manipulation Zone highlighted on the Stat Map. This set the stage for a potential reversal, with momentum gathering as the London session began. After liquidity was taken, price reversed and pushed higher, running through trailed stops and extending into Friday's high and the Daily Bullish Distribution.
The value of this framework comes from the way Stat Map manipulation and distribution areas align with key reference points such as the previous day's high and low. When combined with broader market context including old highs, lows, and ICT PD Arrays, it provides a structured lens for interpreting price phases and managing expectations around liquidity targets.
EURUSD — Session Stat Map Addition
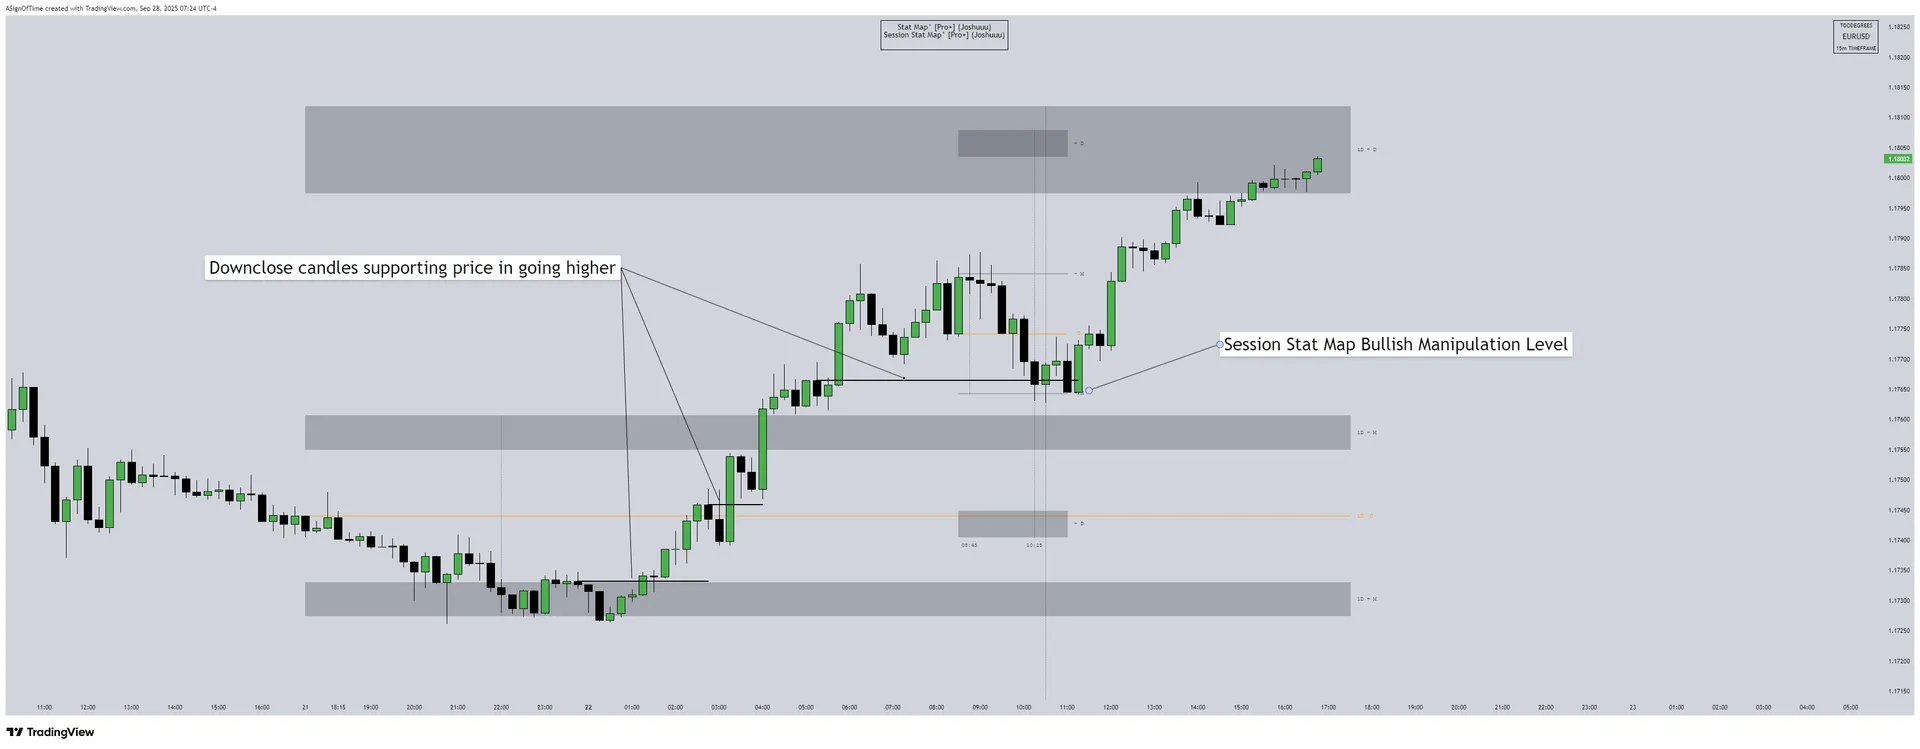
Taking a closer look at the EURUSD example from Monday, the Session Stat Map is now placed within the Daily Stat Map to refine the view of the move. For this example, the New York session window is defined from 8:30 AM to 11:00 AM EST. Within this window, price retraced into the Session Stat Map bullish manipulation level, offering a fractal reflection of the delivery unfolding on the Daily Stat Map.
In trending conditions, downclose candles often serve as support once price reclaims them. For an uptrend to sustain, this signature should hold its integrity, providing a platform for continuation as the move develops.
This example shows how the Session Stat Map, calibrated to the New York Killzone, refines the read of intraday retracements within the broader daily expansion by highlighting areas where structure is expected to hold and momentum can rebuild.
![Session Stat Map [Pro+] — Historical average derived session levels](/images/d9c145baa05b06991e544377c3d32b4900c6cec6.webp)
Featured Indicator
Session Stat Map
A SIGN OF TIME Analyst Channel
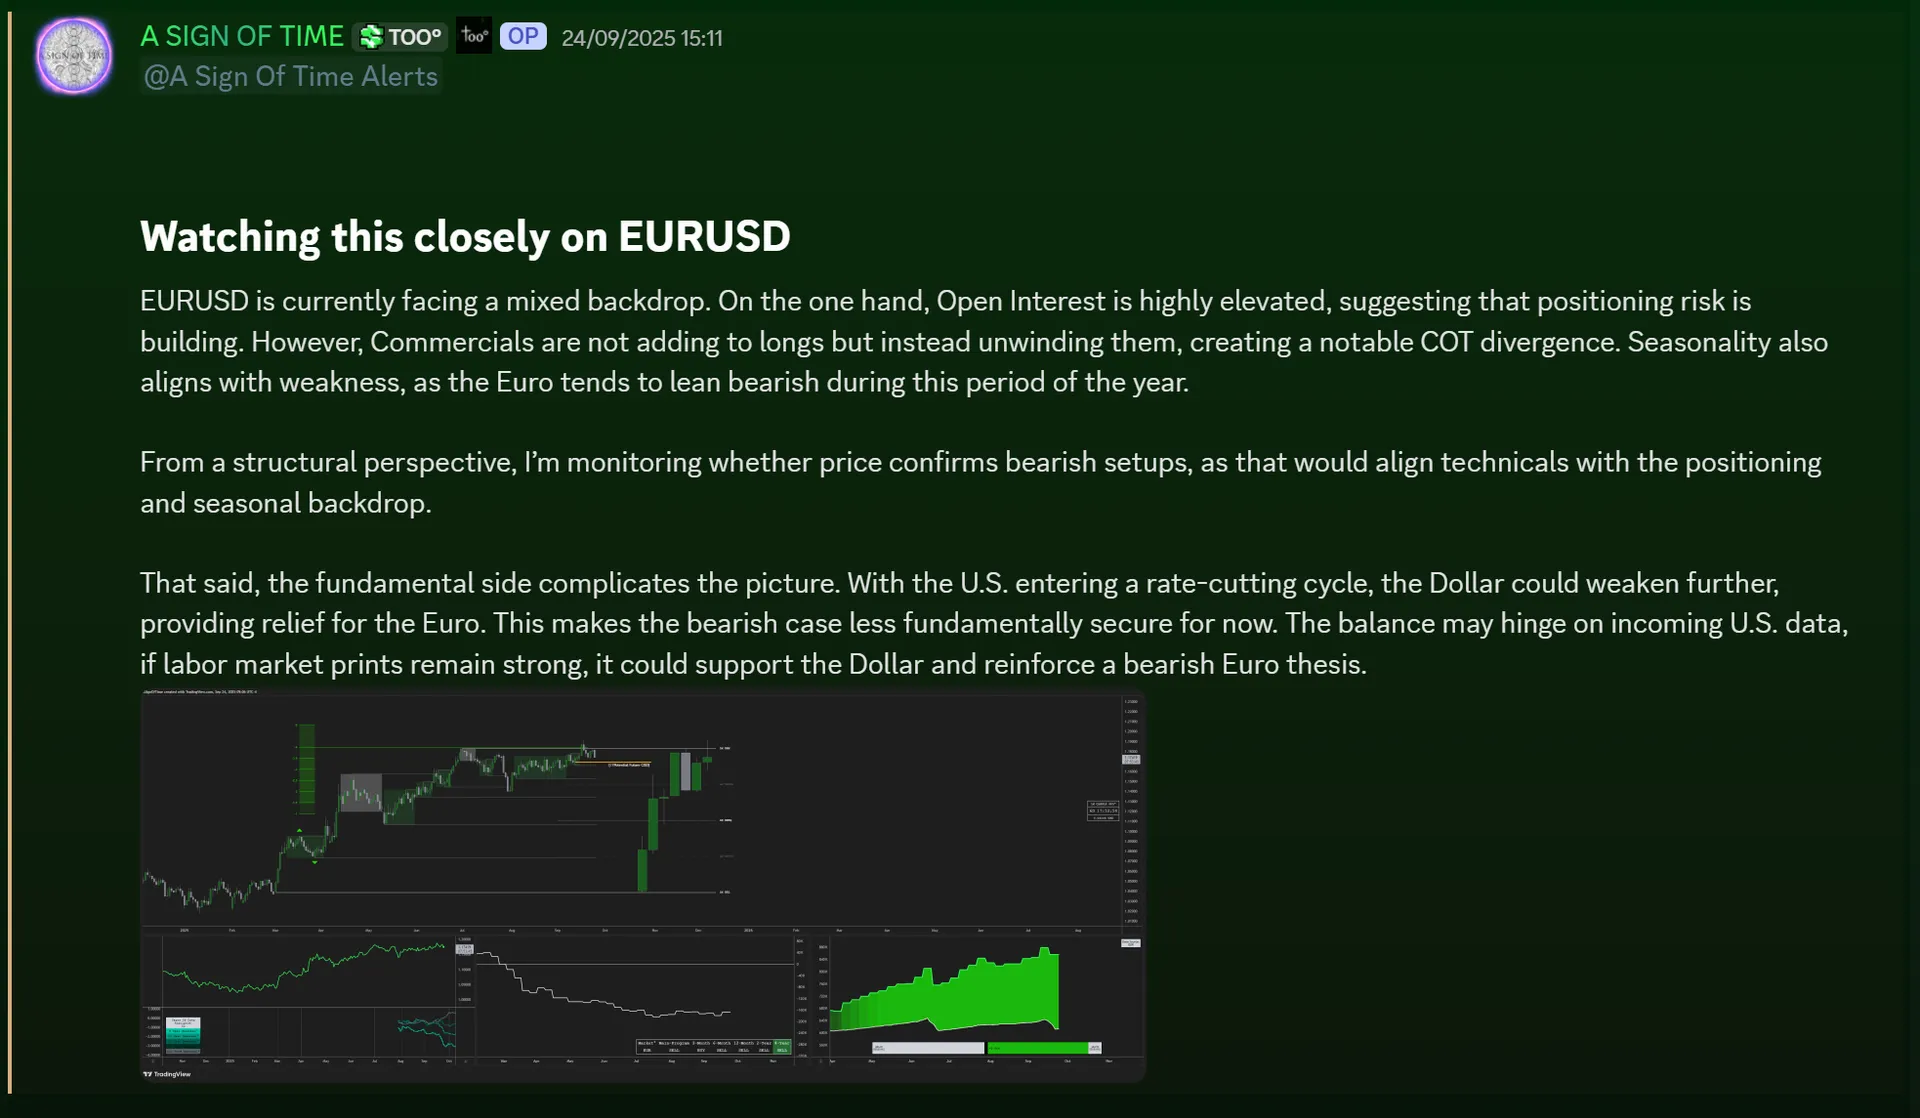
A Sign of Time is tracking EURUSD within a mixed backdrop of elevated Open Interest, COT divergences, and seasonal weakness. Although the overall structure leans bearish, the U.S. rate-cutting cycle adds another layer of complexity, making upcoming data releases critical for establishing a stronger directional bias.
Explore A Sign of Time's full market breakdowns and stay updated with ongoing insights inside the Escape Discord!